Boynton Beach: Fire Incidents, Florida (FL)
Where are fire incidents reported in Boynton Beach, FL
Something went wrong! Please refresh the page.
| Fire incidents reported | |
|---|---|
| Sreet name | Count |
| I 95 | 364 |
| N CONGRESS AVE | 288 |
| S FEDERAL HWY | 146 |
| N SEACREST BLVD | 104 |
| BOYNTON BEACH BLVD | 96 |
| N FEDERAL HWY | 94 |
| S SEACREST BLVD | 86 |
| W BOYNTON BEACH BLVD | 82 |
| W GATEWAY BLVD | 66 |
| W WOOLBRIGHT RD | 52 |
| CONGRESS AVE | 50 |
| SEACREST BLVD | 44 |
| E BOYNTON BEACH BLVD | 42 |
| E OCEAN AVE | 42 |
| MINER RD | 42 |
| FEDERAL HWY | 40 |
| HIGH RIDGE RD | 38 |
| N OCEAN BLVD | 36 |
| NE 4TH ST | 36 |
| NW 12TH AVE | 36 |
| S CONGRESS AVE | 36 |
| STATE ROAD 7 | 36 |
| E WOOLBRIGHT RD | 34 |
| MILITARY TRL | 34 |
| STONEHAVEN DR | 34 |
| CORPORATE DR | 30 |
| OLD BOYNTON RD | 28 |
| WOOLBRIGHT RD | 28 |
| LAWRENCE RD | 26 |
| MEADOWS CIR | 26 |
| Other | 453 |
2003 - 2018 National Fire Incident Reporting System (NFIRS) incidents
- Incident types reported to NFIRS in Boynton Beach, FL
- 38,43067.2%Rescue & EMS
- 4,3147.5%Good Intent Call
- 4,0387.1%Service Call
- 3,9236.9%Hazardous Condition
- 3,7896.6%False Alarm
- 2,5494.5%Fire
- Fire incident types reported to NFIRS in Boynton Beach, FL
- 1,05941.5%Outside Fires
- 69227.1%Structure Fires
- 66626.1%Mobile Property/Vehicle Fires
- 1325.2%Other
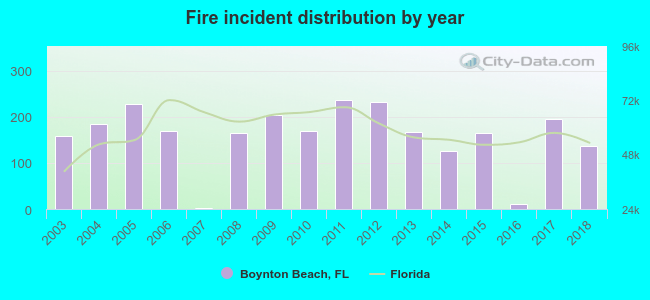 According to the data from the years 2003 - 2018 the average number of fire incidents per year is 159. The highest number of reported fire incidents - 236 took place in 2011, and the least - 2 in 2007. The data has a decreasing trend.
The average number of yearly fire incidents per 10k residents in Boynton Beach, FL compared to nearest cities:
(Note: Based on data for the last 3 years, including only cities with population 5,000 and above)
| Boynton Beach: | 15.6 |
| Lantana: | 26.1 |
| Delray Beach: | 25.0 |
| Lake Worth: | 28.6 |
| Palm Springs: | 22.6 |
| Greenacres: | 14.3 |
| Boca Raton: | 21.4 |
| West Palm Beach: | 39.1 |
| Palm Beach: | 41.6 |
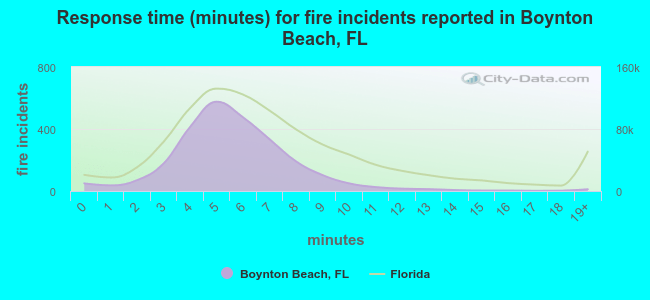 The median response time based on all reported fire incidents is 5 minutes. This is lower than the Florida median value.
The median response time in Boynton Beach, FL compared to nearest cities:
(Note: Based on data for all years, including only cities with at least 500 fire incidents)
| Boynton Beach: | 5 minutes |
| Delray Beach: | 5 minutes |
| Lake Worth: | 6 minutes |
| Greenacres: | 5 minutes |
| Boca Raton: | 6 minutes |
| West Palm Beach: | 6 minutes |
| Wellington: | 7 minutes |
| Deerfield Beach: | 6 minutes |
| Riviera Beach: | 5 minutes |
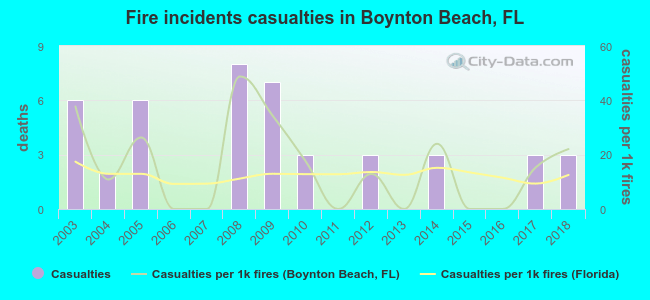 According to the data from the years 2003 - 2018 the average number of fire-related yearly casualties is 3. The highest number of casualties - 8 took place in 2008, and the lowest - 0 in 2006. The data has a dropping trend.
The average number of casualties per 1,000 fires is 16. This indicator was the highest - 49 in 2008, and the lowest 0 in 2006. The trend for injuries per 1,000 fires is declining. Compared to the Florida value the number of injuries per 1,000 fires is higher.
According to the data from the years 2003 - 2018 the average number of fire-related yearly casualties is 3. The highest number of casualties - 8 took place in 2008, and the lowest - 0 in 2006. The data has a dropping trend.
The average number of casualties per 1,000 fires is 16. This indicator was the highest - 49 in 2008, and the lowest 0 in 2006. The trend for injuries per 1,000 fires is declining. Compared to the Florida value the number of injuries per 1,000 fires is higher.Casualties per 1,000 incidents in Boynton Beach, FL compared to nearest cities:
(Note: Based on data for all years, including only cities with at least 500 fire incidents)
| Boynton Beach: | 17.3 |
| Delray Beach: | 25.3 |
| Lake Worth: | 38.4 |
| Greenacres: | 34.9 |
| Boca Raton: | 25.2 |
| West Palm Beach: | 23.5 |
| Wellington: | 29.8 |
| Deerfield Beach: | 21.5 |
| Riviera Beach: | 50.2 |
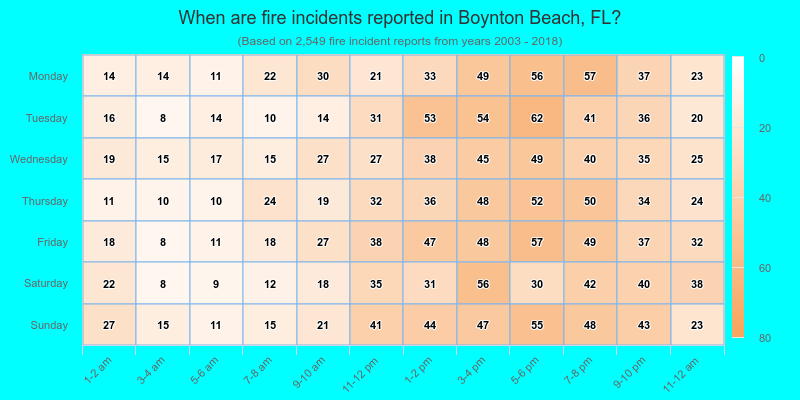
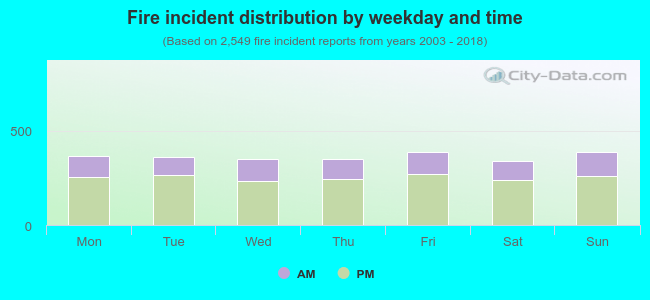 30.8% incidents where reported in the morning and 69.2% in the evening. The most fires (15.3%) took place on Friday, and the least (13.4%) on Saturday.
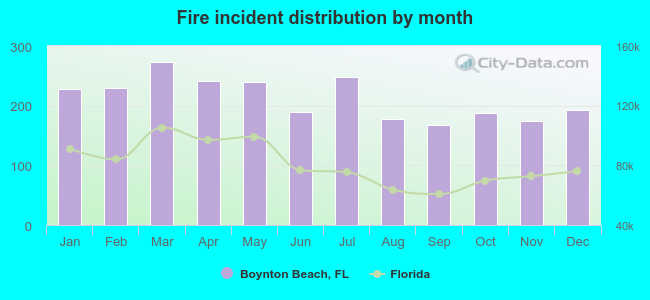 Based on the 2,549 reports from years 2003 - 2018 most fires (10.7%) took place during March, and the least (6.6%) in September.
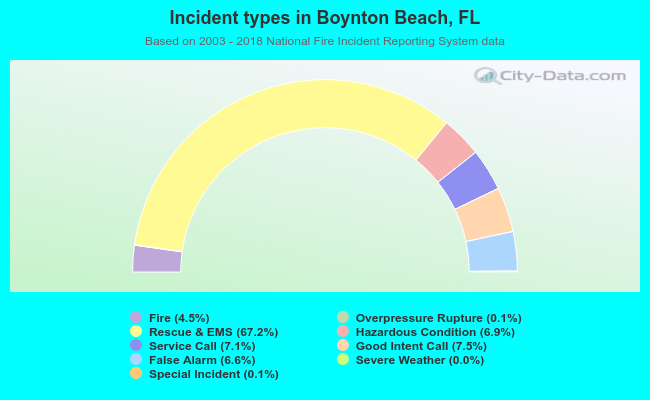 Out of all 57,156 cases reported during the years 2003 - 2018, the most belonged to the categories: Rescue & EMS (67.2%), Good Intent Call (7.5%), and Service Call (7.1%).
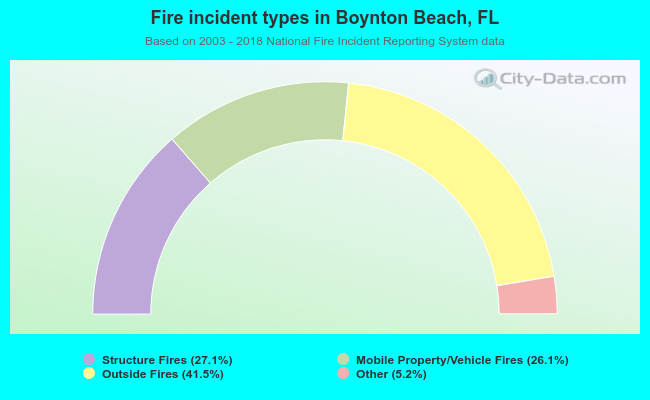 When looking into fire subcategories, the most reports belonged to: Outside Fires (41.5%), and Structure Fires (27.1%).