West Park: Fire Incidents, Florida (FL)
Where are fire incidents reported in West Park, FL
Something went wrong! Please refresh the page.
| Fire incidents reported | |
|---|---|
| Sreet name | Count |
| 21ST ST | 58 |
| 20TH ST | 54 |
| 25TH ST | 48 |
| 27TH ST | 44 |
| 19TH ST | 42 |
| 36TH ST | 42 |
| 18TH ST | 38 |
| PEMBROKE RD | 36 |
| SR 7 | 34 |
| 23RD ST | 32 |
| 40TH AVE | 32 |
| 39TH ST | 30 |
| HALLANDALE BCH | 30 |
| 38TH ST | 28 |
| 26TH ST | 24 |
| 24TH ST | 22 |
| 28TH ST | 22 |
| 40TH ST | 22 |
| 48TH AVE | 22 |
| 32ND AVE | 20 |
| 33RD DR | 20 |
| 56TH AVE | 20 |
| 54TH AVE | 18 |
| 33RD ST | 16 |
| 46TH AVE | 16 |
| 47TH AVE | 16 |
| 56TH TER | 16 |
| 58TH TER | 16 |
| 22ND ST | 14 |
| 32ND BLVD | 14 |
2005 - 2018 National Fire Incident Reporting System (NFIRS) incidents
- Incident types reported to NFIRS in West Park, FL
- 7,57866.8%Rescue & EMS
- 1,38212.2%Good Intent Call
- 7226.4%Hazardous Condition
- 6916.1%Service Call
- 6345.6%Fire
- 3332.9%False Alarm
- Fire incident types reported to NFIRS in West Park, FL
- 33152.2%Structure Fires
- 15624.6%Outside Fires
- 12720.0%Mobile Property/Vehicle Fires
- 203.2%Other
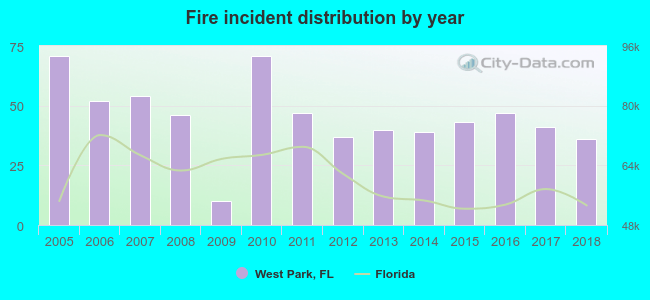 Based on the data from the years 2005 - 2018 the average number of fires per year is 45. The highest number of reported fires - 71 took place in 2005, and the least - 10 in 2009. The data has a dropping trend.
The average number of yearly fire incidents per 10k residents in West Park, FL compared to nearest cities:
(Note: Based on data for the last 3 years, including only cities with population 5,000 and above)
| West Park: | 27.7 |
| Pembroke Park: | 42.9 |
| Hollywood: | 20.1 |
| Hallandale Beach: | 0.3 |
| Hallandale: | 24.5 |
| North Miami Beach: | 12.4 |
| Aventura: | 9.7 |
| Miramar: | 10.3 |
| Sunny Isles Beach: | 12.6 |
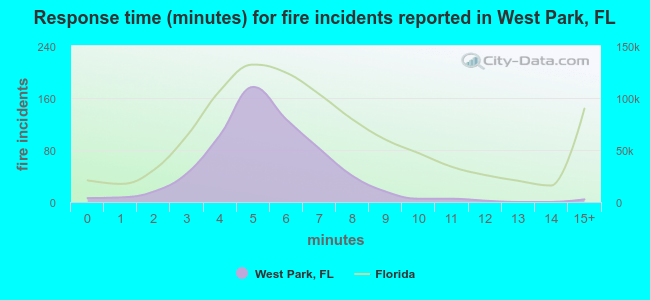 The median response time based on all reported fire incidents is 5 minutes. This is lower than the Florida median value.
The median response time in West Park, FL compared to nearest cities:
(Note: Based on data for all years, including only cities with at least 500 fire incidents)
| West Park: | 5 minutes |
| Miami Gardens: | 6 minutes |
| Hollywood: | 6 minutes |
| Hallandale: | 5 minutes |
| North Miami Beach: | 6 minutes |
| Miramar: | 6 minutes |
| North Miami: | 6 minutes |
| Cooper City: | 6 minutes |
| Pembroke Pines: | 5 minutes |
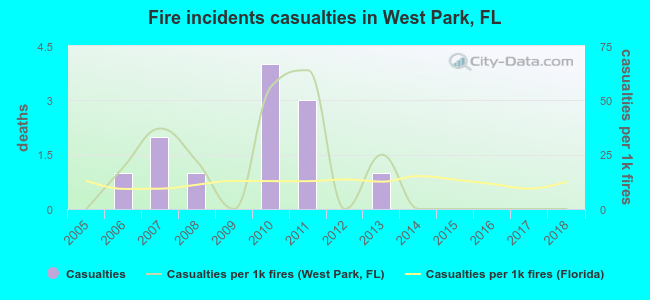 Based on the reports from the years 2005 - 2018 the average number of fire-related casualties per year is 1. The highest number of casualties - 4 took place in 2010, and the lowest - 0 in 2005. The data has a constant trend.
The average number of casualties per 1,000 fire incidents is 16. This indicator was the highest - 64 in 2011, and the lowest 0 in 2005. The trend for casualties per 1,000 fire incidents is constant. Compared to the Florida value the number of injuries per 1,000 fires is higher.
Based on the reports from the years 2005 - 2018 the average number of fire-related casualties per year is 1. The highest number of casualties - 4 took place in 2010, and the lowest - 0 in 2005. The data has a constant trend.
The average number of casualties per 1,000 fire incidents is 16. This indicator was the highest - 64 in 2011, and the lowest 0 in 2005. The trend for casualties per 1,000 fire incidents is constant. Compared to the Florida value the number of injuries per 1,000 fires is higher.Casualties per 1,000 incidents in West Park, FL compared to nearest cities:
(Note: Based on data for all years, including only cities with at least 500 fire incidents)
| West Park: | 18.9 |
| Miami Gardens: | 0.0 |
| Hollywood: | 17.4 |
| Hallandale: | 12.9 |
| North Miami Beach: | 0.0 |
| Miramar: | 17.8 |
| North Miami: | 0.0 |
| Cooper City: | 28.6 |
| Pembroke Pines: | 31.2 |
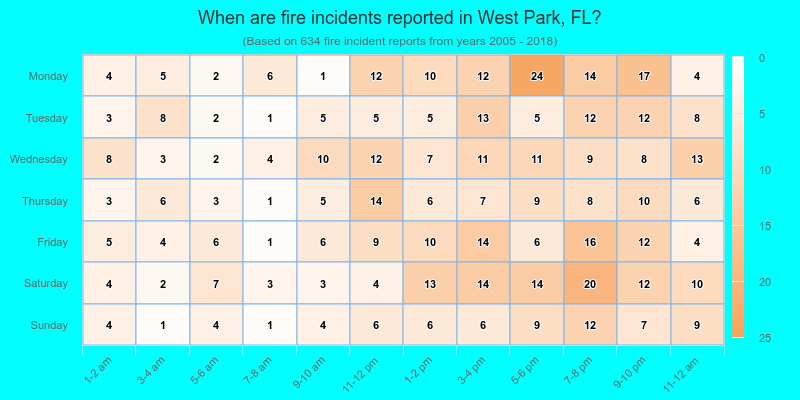
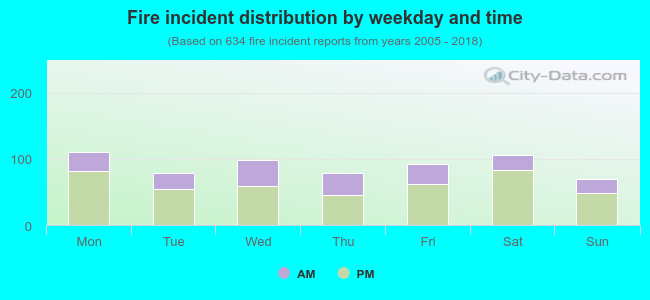 31.4% incidents where reported in the morning and 68.6% in the evening. The most fires (17.5%) took place on Monday, and the least (10.9%) on Sunday.
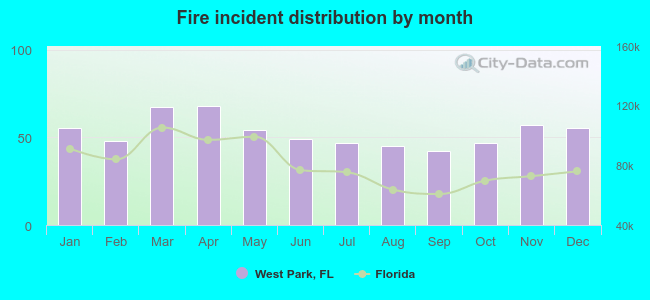 Based on the 634 fire incidents from years 2005 - 2018 most fires (10.7%) took place during April, and the least (6.6%) in September.
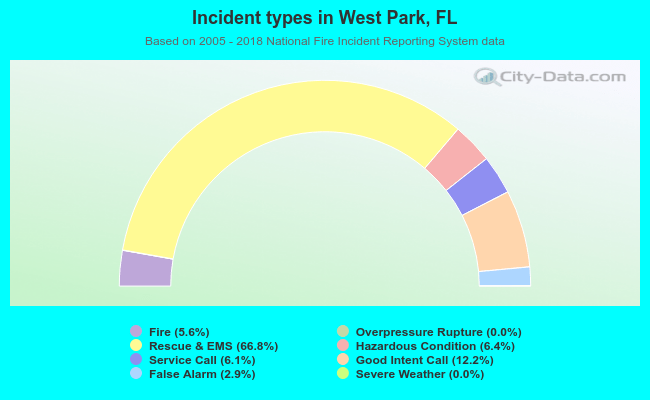 Out of all 11,343 cases reported during the years 2005 - 2018, the most belonged to the categories: Rescue & EMS (66.8%), Good Intent Call (12.2%), and Hazardous Condition (6.4%).
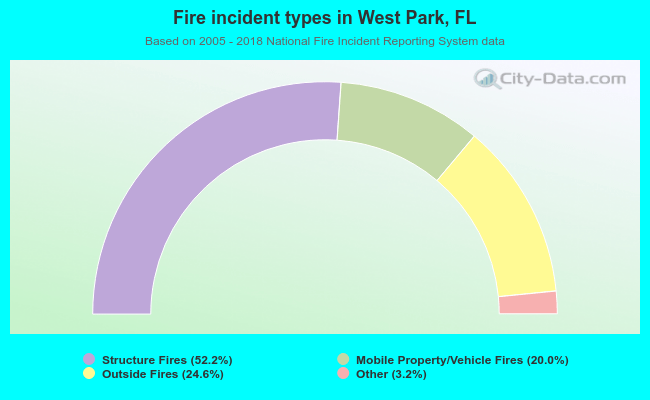 When looking into fire subcategories, the most incidents belonged to: Structure Fires (52.2%), and Outside Fires (24.6%).