| Fire incidents reported |
|---|
| Sreet name | Count |
|---|
| MAIN ST | 28 | | HIGHWAY 86 | 26 | | G ST | 14 | | FORRESTER RD | 12 | | H ST | 10 | | HWY 86 | 10 | | ANDRE RD | 8 | | 86 HWY | 6 | | LACK RD | 6 | | GENTRY AND WALKER RD | 4 | | HWY 86 AND BANNESTER RD | 4 | | HWY 86 AND BUCK RD | 4 | | HWY 86 AND POE RD | 4 | | HWY 86 BUCK RD | 4 | | HWY 86 HOSKINS RD | 4 | | KALIN RD | 4 | | LOVELAND RD | 4 | | ORR RD | 4 | | 1 ST AND S CENTER | 2 | | 5TH CENTER | 2 | | 5TH ST | 2 | | 6 TH ST | 2 | | 6TH ST | 2 | | 7TH ST | 2 | | 7TH STREET AND N C STREET | 2 |
| | | Fire incidents reported |
|---|
| Sreet name | Count |
|---|
| BAKER BANNISTER RD | 2 | | BANNESTER AND HWY 86 | 2 | | BANNESTER RD | 2 | | BANNISTER RD | 2 | | BAUGMAN AND KREUGER RD | 2 | | BAUGMAN KALIN RD | 2 | | C ST | 2 | | CENTER ST | 2 | | D ST | 2 | | E ST | 2 | | FORRESTER AND IMLER RD | 2 | | FORRESTER AND MONTE RD | 2 | | FORRESTER RD AND GENTRY RD | 2 | | G ST | 2 | | G ST ST | 2 | | G STREET | 2 | | G STREET ST | 2 | | G. STREET | 2 | | GENTERY AND KREGGER RD | 2 | | GENTRY AND FORRESTER RD | 2 | | H RD | 2 | | H W 8TH | 2 | | HIGHTWAY 86 RD | 2 | | HIGHWAY 86 6 MILES NORTH WML | 2 | | HIGHWAY 86 AND ANDRE RD | 2 |
|
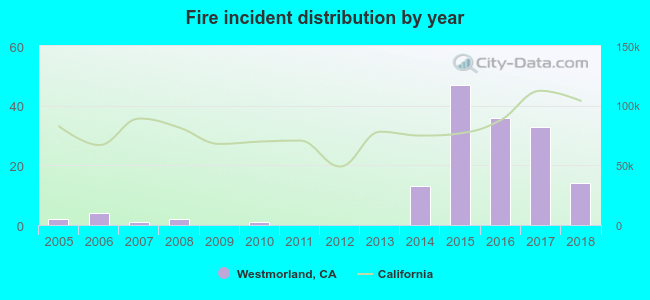 Based on the data from the years 2005 - 2018 the average number of fire incidents per year is 11. The highest number of reported fires - 47 took place in 2015, and the least - 0 in 2009. The data has an increasing trend.
 28.1% incidents where reported in the morning and 71.9% in the evening. The most fires (21.6%) took place on Friday, and the least (9.8%) on Monday.
 Based on the 153 fires from years 2005 - 2018 most fires (15.7%) took place during May, and the least (3.3%) in December.
 Out of all 903 cases reported during the years 2005 - 2018, the most belonged to the categories: Rescue & EMS (68.8%), Fire (16.9%), and Good Intent Call (6.4%).
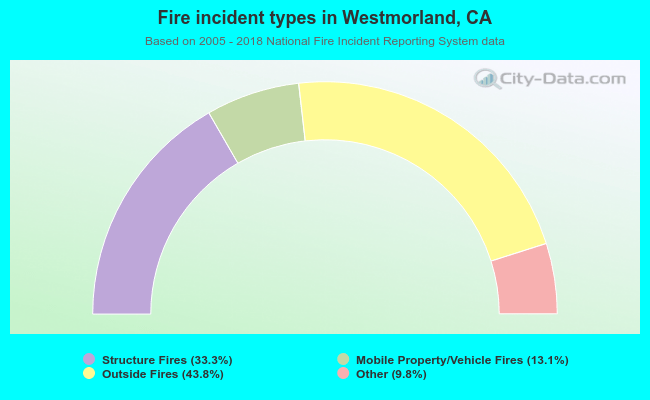 When looking into fire subcategories, the most reports belonged to: Outside Fires (43.8%), and Structure Fires (33.3%).