Westwood: Fire Incidents, New Jersey (NJ)
Where are fire incidents reported in Westwood, NJ
Something went wrong! Please refresh the page.
|
| |||||||||||||||||||||||||||||||||||||||||||||||||||||||||||||||||||||||||||||||||||||||||||||||||||||||||||||
2003 - 2018 National Fire Incident Reporting System (NFIRS) incidents
- Incident types reported to NFIRS in Westwood, NJ
- 63934.9%Hazardous Condition
- 51928.3%False Alarm
- 47826.1%Fire
- 1156.3%Good Intent Call
- 472.6%Service Call
- 261.4%Rescue & EMS
- 50.3%Overpressure Rupture
- 20.1%Severe Weather
- Fire incident types reported to NFIRS in Westwood, NJ
- 32568.0%Structure Fires
- 10321.5%Outside Fires
- 408.4%Mobile Property/Vehicle Fires
- 102.1%Other
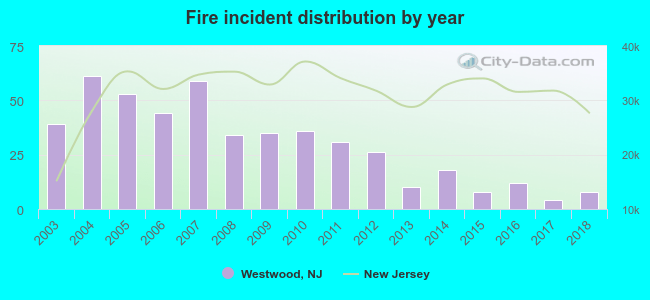 According to the data from the years 2003 - 2018 the average number of fires per year is 30. The highest number of reported fire incidents - 61 took place in 2004, and the least - 4 in 2017. The data has a decreasing trend.
The average number of yearly fire incidents per 10k residents in Westwood, NJ compared to nearest cities:
(Note: Based on data for the last 3 years, including only cities with population 5,000 and above)
| Westwood: | 7.2 |
| Emerson: | 24.5 |
| Hillsdale: | 21.9 |
| Washington Township: | 10.8 |
| River Vale: | 13.4 |
| Oradell: | 32.7 |
| Woodcliff Lake: | 6.2 |
| Old Tappan: | 13.5 |
| Park Ridge: | 11.3 |
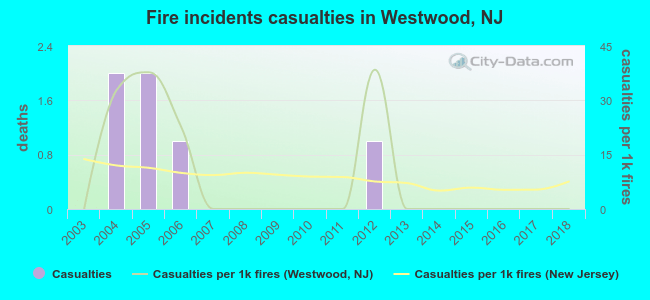 According to the data from the years 2003 - 2018 the average number of fire-related casualties per year is 0. The highest number of injuries - 2 took place in 2004, and the lowest - 0 in 2003. The data has a constant trend.
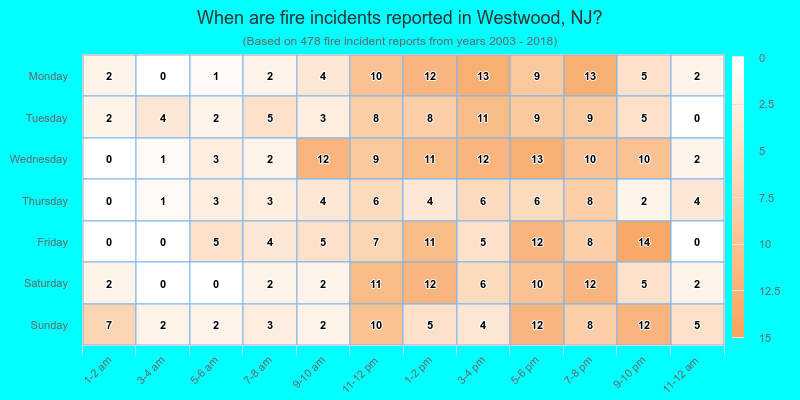
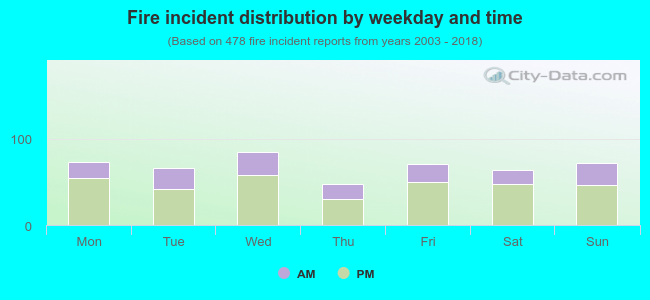 31.6% incidents where reported in the morning and 68.4% in the evening. The most fires (17.8%) took place on Wednesday, and the least (9.8%) on Thursday.
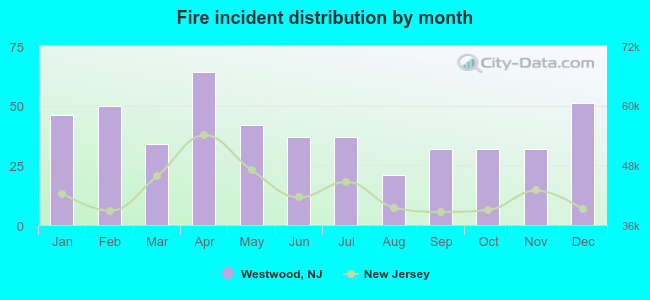 Based on the 478 reports from years 2003 - 2018 most fires (13.4%) took place during April, and the least (4.4%) in August.
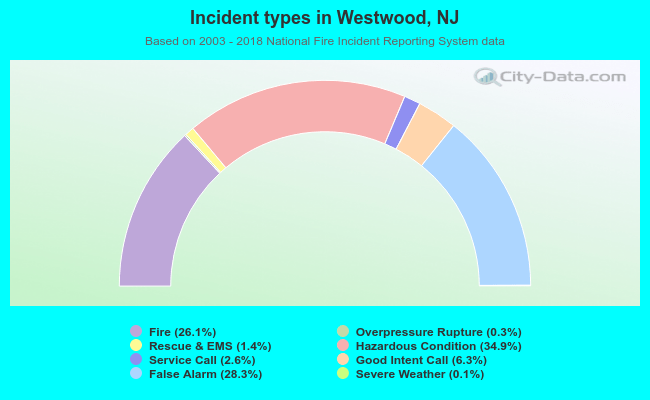 Out of all 1,831 cases reported during the years 2003 - 2018, the most belonged to the categories: Hazardous Condition (34.9%), False Alarm (28.3%), and Fire (26.1%).
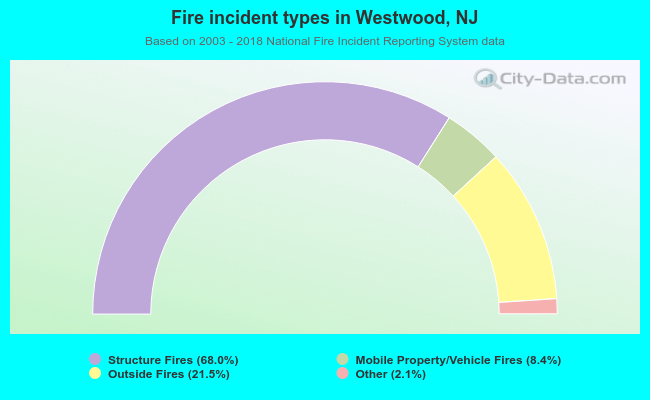 When looking into fire subcategories, the most reports belonged to: Structure Fires (68.0%), and Outside Fires (21.5%).