Old Tappan: Fire Incidents, New Jersey (NJ)
Where are fire incidents reported in Old Tappan, NJ
Something went wrong! Please refresh the page.
|
| |||||||||||||||||||||||||||||||||||||||||||||||||||||||||||||||||||||||||||||||||||||||||||||||||||||||||||||
2003 - 2018 National Fire Incident Reporting System (NFIRS) incidents
- Incident types reported to NFIRS in Old Tappan, NJ
- 23337.9%False Alarm
- 17628.7%Hazardous Condition
- 13221.5%Fire
- 365.9%Service Call
- 172.8%Rescue & EMS
- 122.0%Good Intent Call
- 40.7%Overpressure Rupture
- 40.7%Severe Weather
- Fire incident types reported to NFIRS in Old Tappan, NJ
- 7859.1%Structure Fires
- 3728.0%Outside Fires
- 96.8%Mobile Property/Vehicle Fires
- 86.1%Other
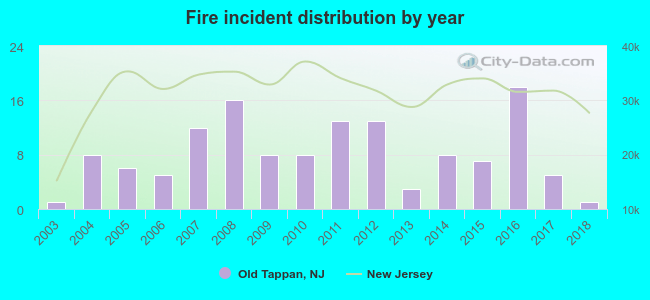 According to the data from the years 2003 - 2018 the average number of fire incidents per year is 8. The highest number of reported fire incidents - 18 took place in 2016, and the least - 1 in 2003. The data has a constant trend.
The average number of yearly fire incidents per 10k residents in Old Tappan, NJ compared to nearest cities:
(Note: Based on data for the last 3 years, including only cities with population 5,000 and above)
| Old Tappan: | 13.5 |
| River Vale: | 13.4 |
| Norwood: | 14.9 |
| Closter: | 14.0 |
| Westwood: | 7.2 |
| Hillsdale: | 21.9 |
| Emerson: | 24.5 |
| Park Ridge: | 11.3 |
| Montvale: | 9.2 |

 29.5% incidents where reported in the morning and 70.5% in the evening. The most fires (18.2%) took place on Sunday, and the least (9.1%) on Friday.
 According to the 132 fires from years 2003 - 2018 most fires (14.4%) took place during April, and the least (3.8%) in May.
 Out of all 614 cases reported during the years 2003 - 2018, the most belonged to the categories: False Alarm (37.9%), Hazardous Condition (28.7%), and Fire (21.5%).
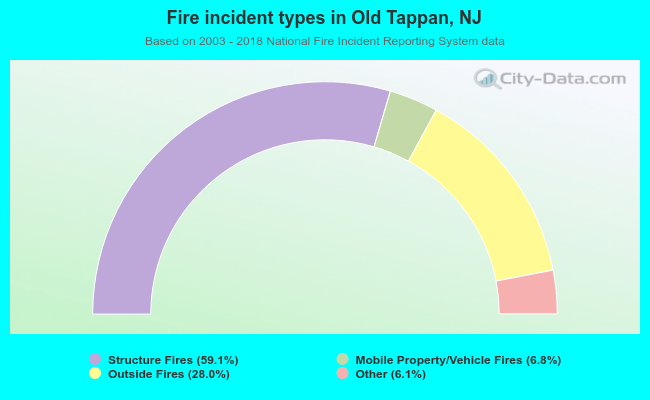 When looking into fire subcategories, the most incidents belonged to: Structure Fires (59.1%), and Outside Fires (28.0%).