White Settlement: Fire Incidents, Texas (TX)
Where are fire incidents reported in White Settlement, TX
Something went wrong! Please refresh the page.
| Fire incidents reported | |
|---|---|
| Sreet name | Count |
| LAS VEGAS TRL | 98 |
| WHITE SETTLEMENT RD | 94 |
| CHERRY LANE | 90 |
| DALE LANE | 58 |
| RALPH ST | 38 |
| EMERALD CREST | 30 |
| DOWNE DR | 28 |
| HANON DR | 28 |
| RAYMOND AVE | 26 |
| CLIFFORD ST | 24 |
| HALLVALE DR | 24 |
| JIM WRIGHT FWY | 24 |
| WHITE SETTLEMENT RD | 24 |
| 183 HWY | 22 |
| S LAS VEGAS TRL | 22 |
| MEADOW PARK DR | 20 |
| GRANTS LANE | 18 |
| COLTON DR | 16 |
| DALE LN | 16 |
| GIBBS DR | 16 |
| KIMBROUGH | 16 |
| ROE ST | 16 |
| EASLEY ST | 14 |
| MIRIKE DR | 14 |
| SUSSEX ST | 14 |
| WEST FWY | 14 |
| WESTERN HILLS BLVD | 14 |
| ALLENCREST DR | 12 |
| DODSON DR | 12 |
| HARWELL ST | 12 |
| Other | 35 |
2004 - 2018 National Fire Incident Reporting System (NFIRS) incidents
- Incident types reported to NFIRS in White Settlement, TX
- 6,53161.9%Rescue & EMS
- 1,0109.6%Good Intent Call
- 8898.4%Fire
- 8888.4%Hazardous Condition
- 8217.8%Service Call
- 3873.7%False Alarm
- 120.1%Special Incident
- Fire incident types reported to NFIRS in White Settlement, TX
- 46652.4%Outside Fires
- 29533.2%Structure Fires
- 11112.5%Mobile Property/Vehicle Fires
- 171.9%Other
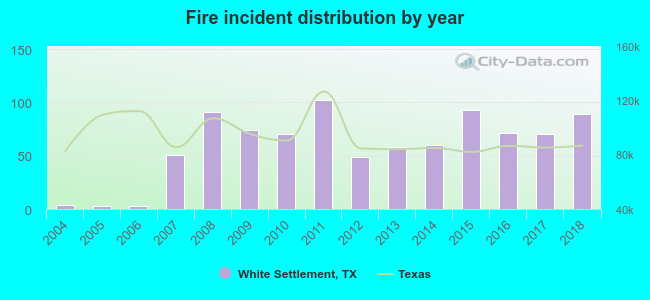 Based on the data from the years 2004 - 2018 the average number of fire incidents per year is 59. The highest number of fire incidents - 102 took place in 2011, and the least - 3 in 2005. The data has an increasing trend.
The average number of yearly fire incidents per 10k residents in White Settlement, TX compared to nearest cities:
(Note: Based on data for the last 3 years, including only cities with population 5,000 and above)
| White Settlement: | 45.4 |
| River Oaks: | 21.3 |
| Benbrook: | 45.2 |
| Fort Worth: | 11.7 |
| Eagle Mountain: | 3.4 |
| Saginaw: | 31.8 |
| Azle: | 122.9 |
| Haltom City: | 42.3 |
| Forest Hill: | 53.9 |
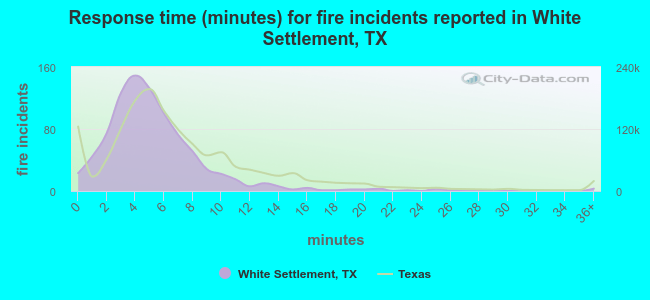 The median response time based on all reported fire incidents is 5 minutes. This is lower compared to the state median value.
The median response time in White Settlement, TX compared to nearest cities:
(Note: Based on data for all years, including only cities with at least 500 fire incidents)
| White Settlement: | 5 minutes |
| Lake Worth: | 5 minutes |
| Benbrook: | 7 minutes |
| Fort Worth: | 4 minutes |
| Saginaw: | 5 minutes |
| Aledo: | 9 minutes |
| Azle: | 9 minutes |
| Willow Park: | 5 minutes |
| Haltom City: | 5 minutes |
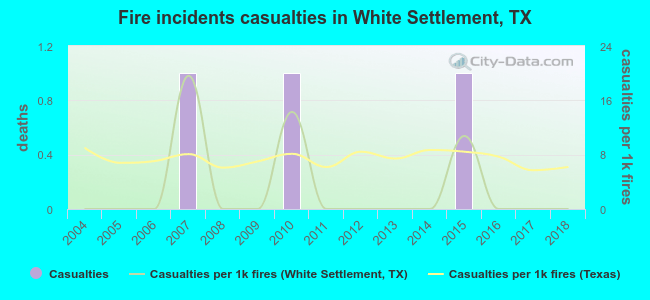 Based on the reports from the years 2004 - 2018 the average number of fire-related casualties per year is 0. The highest number of reported injuries - 1 took place in 2007, and the lowest - 0 in 2004. The data has a constant trend.
The average number of injuries per 1,000 fires is 3. This indicator was the highest - 20 in 2007, and the lowest 0 in 2004. The trend for casualties per 1,000 incidents is constant. Compared to the Texas value the number of casualties per 1,000 fire incidents is much lower.
Based on the reports from the years 2004 - 2018 the average number of fire-related casualties per year is 0. The highest number of reported injuries - 1 took place in 2007, and the lowest - 0 in 2004. The data has a constant trend.
The average number of injuries per 1,000 fires is 3. This indicator was the highest - 20 in 2007, and the lowest 0 in 2004. The trend for casualties per 1,000 incidents is constant. Compared to the Texas value the number of casualties per 1,000 fire incidents is much lower.Casualties per 1,000 incidents in White Settlement, TX compared to nearest cities:
(Note: Based on data for all years, including only cities with at least 500 fire incidents)
| White Settlement: | 3.4 |
| Lake Worth: | 15.4 |
| Benbrook: | 3.4 |
| Fort Worth: | 9.7 |
| Saginaw: | 8.3 |
| Aledo: | 0.0 |
| Azle: | 2.7 |
| Willow Park: | 1.3 |
| Haltom City: | 6.0 |
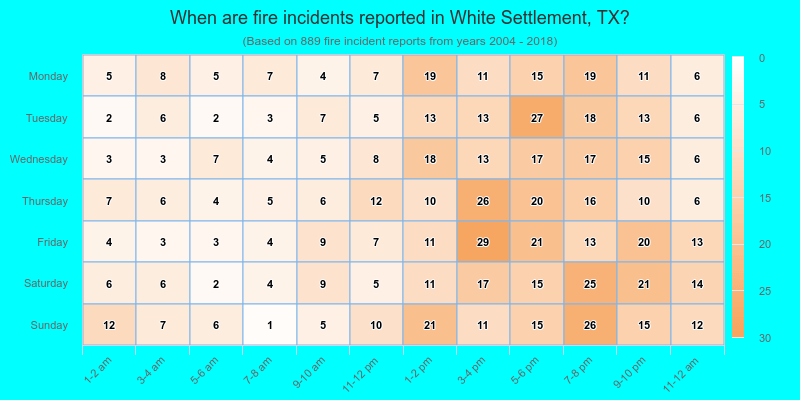
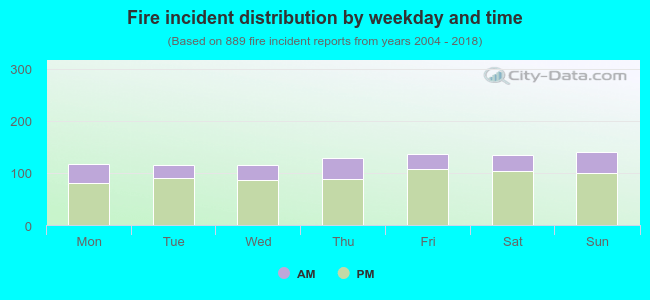 26.3% incidents where reported in the morning and 73.7% in the evening. The most fires (15.9%) took place on Sunday, and the least (12.9%) on Tuesday.
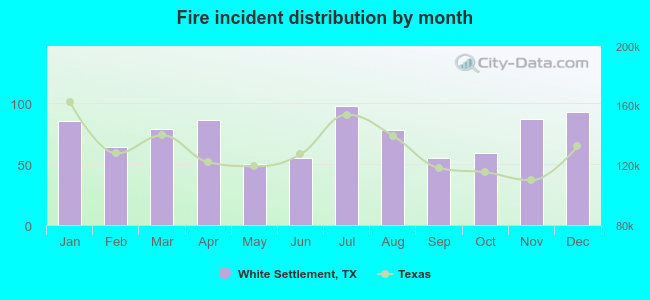 According to the 889 fire incidents from years 2004 - 2018 most fires (11.0%) took place during July, and the least (5.6%) in May.
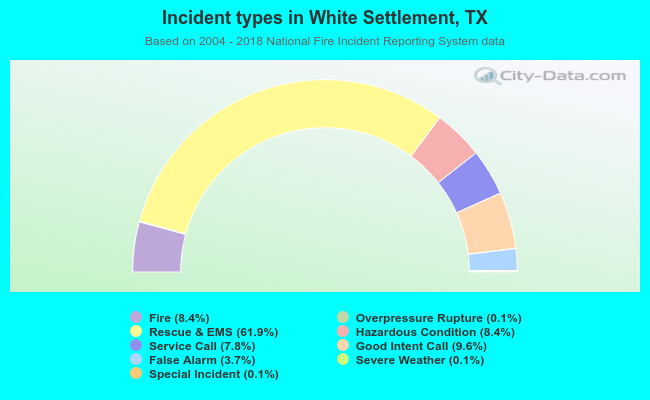 Out of all 10,558 cases reported during the years 2004 - 2018, the most belonged to the categories: Rescue & EMS (61.9%), Good Intent Call (9.6%), and Fire (8.4%).
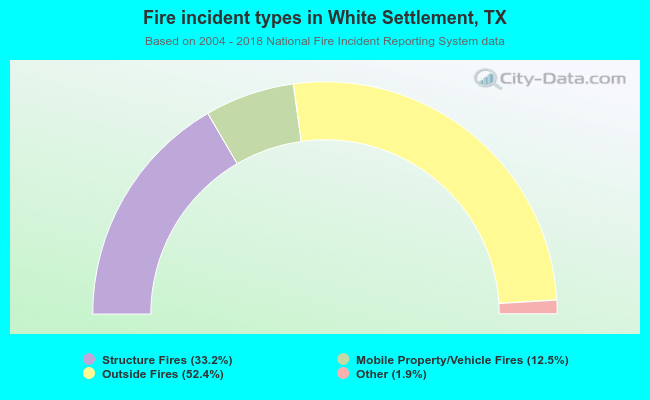 When looking into fire subcategories, the most incidents belonged to: Outside Fires (52.4%), and Structure Fires (33.2%).