Fort Worth: Fire Incidents, Texas (TX)
Where are fire incidents reported in Fort Worth, TX
Something went wrong! Please refresh the page.
| Fire incidents reported | |
|---|---|
| Sreet name | Count |
| LANCASTER AVE | 1,056 |
| SOUTH FWY | 904 |
| ROSEDALE ST | 680 |
| BERRY ST | 666 |
| BEACH ST | 566 |
| MAIN ST | 566 |
| RIVERSIDE DR | 556 |
| NORTH FWY | 460 |
| LOOP 820 | 436 |
| JACKSBORO HWY | 422 |
| EAST FWY | 408 |
| HEMPHILL ST | 408 |
| 28TH ST | 404 |
| WEST FWY | 394 |
| IH 35W | 392 |
| VICKERY BLVD | 392 |
| HULEN ST | 374 |
| MEADOWBROOK DR | 340 |
| IH 20 | 336 |
| SEMINARY DR | 334 |
| IH 820 FWY | 326 |
| MC CART AVE | 312 |
| TRINITY BLVD | 312 |
| BRENTWOOD STAIR RD | 310 |
| LAS VEGAS TRL | 306 |
| IH 30 | 300 |
| NORMANDALE ST | 300 |
| CALMONT AVE | 292 |
| MILLER AVE | 286 |
| ALTAMESA BLVD | 276 |
| Other | 27,706 |
2003 - 2017 National Fire Incident Reporting System (NFIRS) incidents
- Incident types reported to NFIRS in Fort Worth, TX
- 177,30151.0%Rescue & EMS
- 40,82011.8%Fire
- 39,69011.4%Good Intent Call
- 36,18110.4%Hazardous Condition
- 30,9108.9%Service Call
- 19,7195.7%False Alarm
- 2,3620.7%Special Incident
- Fire incident types reported to NFIRS in Fort Worth, TX
- 19,54847.9%Outside Fires
- 11,94329.3%Structure Fires
- 8,69821.3%Mobile Property/Vehicle Fires
- 6311.5%Other
 According to the data from the years 2003 - 2017 the average number of fire incidents per year is 2,713. The highest number of reported fire incidents - 4,012 took place in 2005, and the least - 327 in 2017. The data has a decreasing trend.
The average number of yearly fire incidents per 10k residents in Fort Worth, TX compared to nearest cities:
(Note: Based on data for the last 3 years, including only cities with population 5,000 and above)
| Fort Worth: | 11.7 |
| River Oaks: | 21.3 |
| Haltom City: | 42.3 |
| Forest Hill: | 53.9 |
| White Settlement: | 45.4 |
| Richland Hills: | 17.8 |
| Everman: | 45.4 |
| Benbrook: | 45.2 |
| Saginaw: | 31.8 |
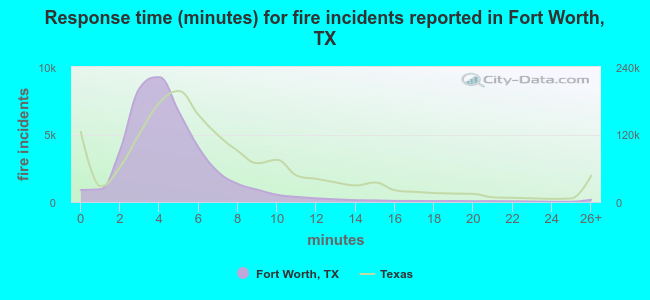 The median response time based on all reported fire incidents is 4 minutes. This is lower compared to the state median value.
The median response time in Fort Worth, TX compared to nearest cities:
(Note: Based on data for all years, including only cities with at least 500 fire incidents)
| Fort Worth: | 4 minutes |
| Haltom City: | 5 minutes |
| Forest Hill: | 5 minutes |
| White Settlement: | 5 minutes |
| Lake Worth: | 5 minutes |
| Richland Hills: | 5 minutes |
| Everman: | 6 minutes |
| Benbrook: | 7 minutes |
| Saginaw: | 5 minutes |
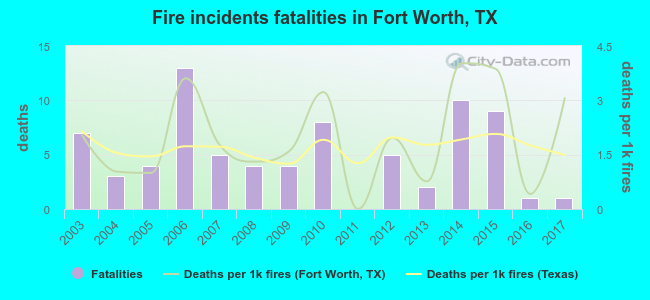 According to the data from the years 2003 - 2017 the average number of fire-related fatalities per year is 5. The highest number of reported deaths - 13 took place in 2006, and the lowest - 0 in 2011. The data has a declining trend.
The average number of deaths per 1,000 fire incidents is 2. This indicator was the highest - 4 in 2014, and the lowest 0 in 2011. The trend for fatalities per 1,000 fire incidents is rising. Compared to the state value the number of deaths per 1,000 fire incidents is similar.
According to the data from the years 2003 - 2017 the average number of fire-related fatalities per year is 5. The highest number of reported deaths - 13 took place in 2006, and the lowest - 0 in 2011. The data has a declining trend.
The average number of deaths per 1,000 fire incidents is 2. This indicator was the highest - 4 in 2014, and the lowest 0 in 2011. The trend for fatalities per 1,000 fire incidents is rising. Compared to the state value the number of deaths per 1,000 fire incidents is similar.Deaths per 1,000 incidents in Fort Worth, TX compared to nearest cities:
(Note: Based on data for all years, including only cities with at least 2,500 fire incidents)
| Fort Worth: | 1.9 |
| Haltom City: | 1.4 |
| Arlington: | 1.9 |
| Bedford: | 1.5 |
| Burleson: | 0.8 |
| Azle: | 0.7 |
| Euless: | 1.3 |
| Mansfield: | 0.7 |
| Grand Prairie: | 3.9 |
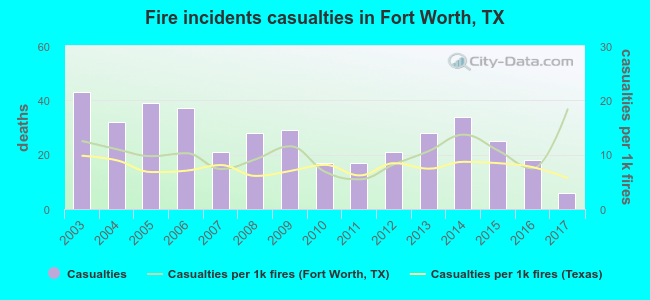 According to the data from the years 2003 - 2017 the average number of fire-related yearly casualties is 26. The highest number of reported casualties - 43 took place in 2003, and the lowest - 6 in 2017. The data has a declining trend.
The average number of casualties per 1,000 fires is 10. This indicator was the highest - 18 in 2017, and the lowest 5 in 2011. The trend for injuries per 1,000 incidents is rising. Compared to the Texas value the number of casualties per 1,000 fire incidents is higher.
According to the data from the years 2003 - 2017 the average number of fire-related yearly casualties is 26. The highest number of reported casualties - 43 took place in 2003, and the lowest - 6 in 2017. The data has a declining trend.
The average number of casualties per 1,000 fires is 10. This indicator was the highest - 18 in 2017, and the lowest 5 in 2011. The trend for injuries per 1,000 incidents is rising. Compared to the Texas value the number of casualties per 1,000 fire incidents is higher.Casualties per 1,000 incidents in Fort Worth, TX compared to nearest cities:
(Note: Based on data for all years, including only cities with at least 500 fire incidents)
| Fort Worth: | 9.7 |
| Haltom City: | 6.0 |
| Forest Hill: | 9.5 |
| White Settlement: | 3.4 |
| Lake Worth: | 15.4 |
| Richland Hills: | 9.8 |
| Everman: | 0.0 |
| Benbrook: | 3.4 |
| Saginaw: | 8.3 |
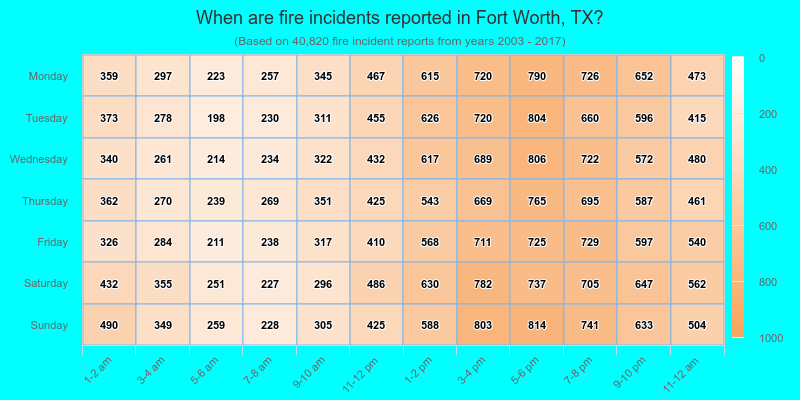
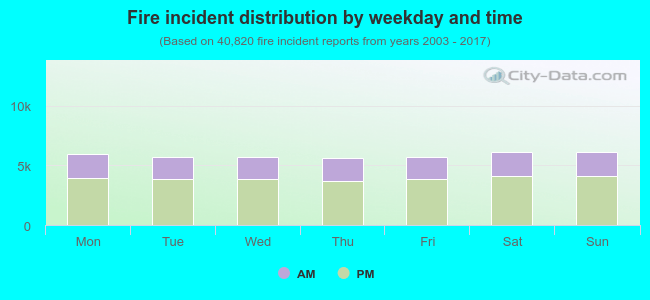 32.8% incidents where reported in the morning and 67.2% in the evening. The most fires (15.0%) took place on Sunday, and the least (13.8%) on Thursday.
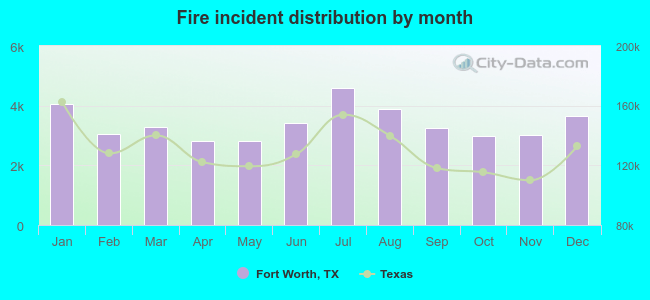 According to the 40,820 reports from years 2003 - 2017 most fires (11.2%) took place during July, and the least (6.9%) in April.
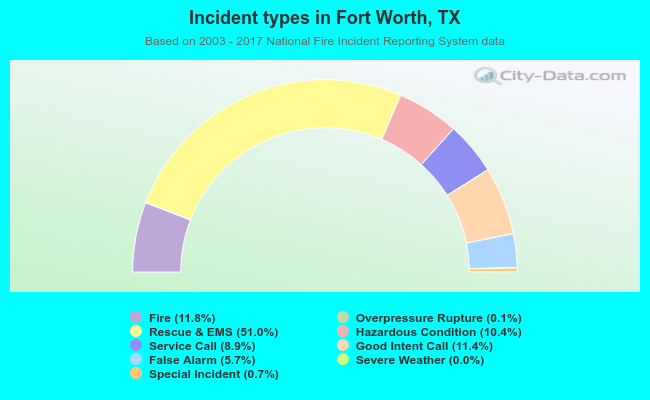 Out of all 347,333 cases reported during the years 2003 - 2017, the most belonged to the categories: Rescue & EMS (51.0%), Fire (11.8%), and Good Intent Call (11.4%).
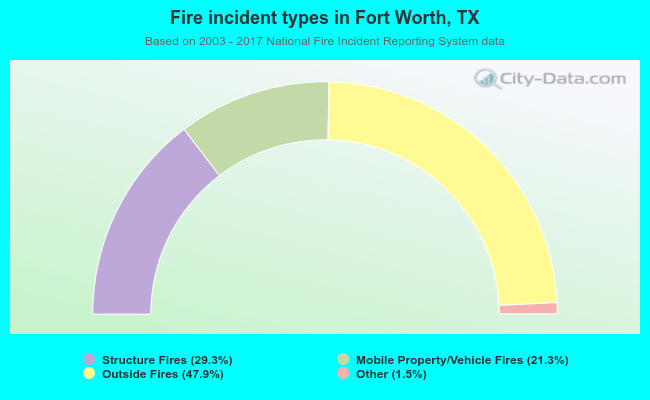 When looking into fire subcategories, the most incidents belonged to: Outside Fires (47.9%), and Structure Fires (29.3%).