Willoughby Hills: Fire Incidents, Ohio (OH)
Where are fire incidents reported in Willoughby Hills, OH
Something went wrong! Please refresh the page.
| Fire incidents reported | |
|---|---|
| Sreet name | Count |
| CHARDON RD | 354 |
| BISHOP PARK DR | 88 |
| PAR LN | 78 |
| INTERSTATE 90 | 74 |
| SOM CENTER RD | 54 |
| RIVER RD | 52 |
| CHARDON | 46 |
| PAR LANE | 42 |
| INTERSTATE 271 | 38 |
| WHITE RD | 36 |
| BISHOP RD | 34 |
| INTERSTATE 90 HWY | 26 |
| PAR LA | 24 |
| BISHOP PARK | 22 |
| EUCLID CHARDON RD | 20 |
| ROCKEFELLER RD | 20 |
| STRATFORD WAY | 20 |
| CHARDON RD | 16 |
| MAPLEGROVE RD | 16 |
| DODDS LANDING | 14 |
| CHARDON ROAD | 12 |
| CURTISSWRIGHT PKY | 12 |
| MAPLEGROVE | 12 |
| ROCKEFELLER | 12 |
| BISHOP | 10 |
| BUTTERMILK FALLS PKY | 10 |
| EDDY RD | 10 |
| INTERSTATE 271 HWY | 10 |
| MILANN DR | 10 |
| RIVERS EDGE | 10 |
2002 - 2018 National Fire Incident Reporting System (NFIRS) incidents
- Incident types reported to NFIRS in Willoughby Hills, OH
- 5,57262.3%Rescue & EMS
- 8639.6%Hazardous Condition
- 8409.4%Fire
- 6967.8%Service Call
- 5886.6%Good Intent Call
- 3644.1%False Alarm
- 100.1%Severe Weather
- Fire incident types reported to NFIRS in Willoughby Hills, OH
- 55265.7%Structure Fires
- 15418.3%Outside Fires
- 13115.6%Mobile Property/Vehicle Fires
- 30.4%Other
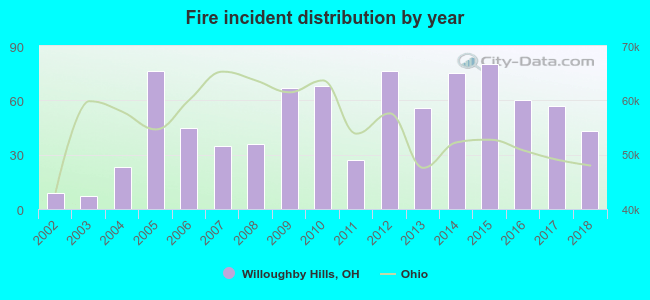 According to the data from the years 2002 - 2018 the average number of fires per year is 49. The highest number of reported fires - 80 took place in 2015, and the least - 7 in 2003. The data has an increasing trend.
The average number of yearly fire incidents per 10k residents in Willoughby Hills, OH compared to nearest cities:
(Note: Based on data for the last 3 years, including only cities with population 5,000 and above)
| Willoughby Hills: | 56.7 |
| Wickliffe: | 50.3 |
| Highland Heights: | 34.7 |
| Willowick: | 35.7 |
| Richmond Heights: | 52.1 |
| Euclid: | 44.4 |
| Willoughby: | 58.9 |
| Mayfield Heights: | 26.7 |
| Eastlake: | 50.2 |
 The median response time based on all reported fire incidents is 7 minutes. This is comparable to the Ohio median value.
The median response time in Willoughby Hills, OH compared to nearest cities:
(Note: Based on data for all years, including only cities with at least 500 fire incidents)
| Willoughby Hills: | 7 minutes |
| Wickliffe: | 5 minutes |
| Willowick: | 4 minutes |
| Euclid: | 5 minutes |
| Willoughby: | 4 minutes |
| Mayfield Heights: | 4 minutes |
| Eastlake: | 5 minutes |
| Kirtland: | 6 minutes |
| Lyndhurst: | 5 minutes |
 Based on the data from the years 2002 - 2018 the average number of fire-related casualties per year is 1. The highest number of casualties - 3 took place in 2015, and the lowest - 0 in 2002. The data has a rising trend.
The average number of injuries per 1,000 fire incidents is 12. This indicator was the highest - 70 in 2018, and the lowest 0 in 2002. The trend for injuries per 1,000 fire incidents is increasing. Compared to the Ohio value the number of injuries per 1,000 fires is about the same.
Based on the data from the years 2002 - 2018 the average number of fire-related casualties per year is 1. The highest number of casualties - 3 took place in 2015, and the lowest - 0 in 2002. The data has a rising trend.
The average number of injuries per 1,000 fire incidents is 12. This indicator was the highest - 70 in 2018, and the lowest 0 in 2002. The trend for injuries per 1,000 fire incidents is increasing. Compared to the Ohio value the number of injuries per 1,000 fires is about the same.Casualties per 1,000 incidents in Willoughby Hills, OH compared to nearest cities:
(Note: Based on data for all years, including only cities with at least 500 fire incidents)
| Willoughby Hills: | 14.3 |
| Wickliffe: | 22.5 |
| Willowick: | 12.7 |
| Euclid: | 15.5 |
| Willoughby: | 41.4 |
| Mayfield Heights: | 5.3 |
| Eastlake: | 55.6 |
| Kirtland: | 3.4 |
| Lyndhurst: | 12.4 |
 32.1% incidents where reported in the morning and 67.9% in the evening. The most fires (18.3%) took place on Sunday, and the least (10.8%) on Tuesday.
 According to the 840 reports from years 2002 - 2018 most fires (13.0%) took place during November, and the least (4.9%) in September.
 Out of all 8,945 cases reported during the years 2002 - 2018, the most belonged to the categories: Rescue & EMS (62.3%), Hazardous Condition (9.6%), and Fire (9.4%).
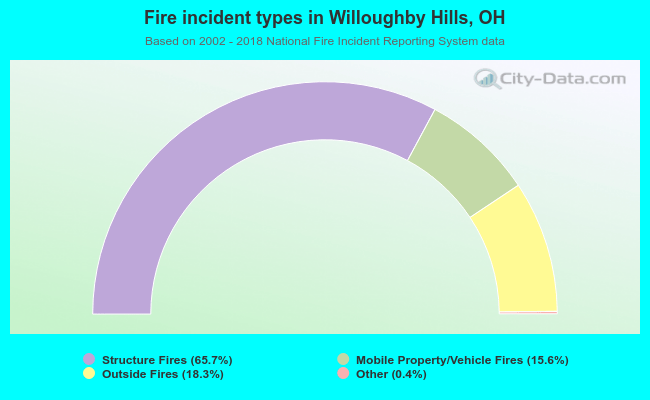 When looking into fire subcategories, the most reports belonged to: Structure Fires (65.7%), and Outside Fires (18.3%).