Willoughby: Fire Incidents, Ohio (OH)
Where are fire incidents reported in Willoughby, OH
Something went wrong! Please refresh the page.
| Fire incidents reported | |
|---|---|
| Sreet name | Count |
| EUCLID AVE | 590 |
| OAK HILL LN | 292 |
| RIDGE RD | 256 |
| LOST NATION RD | 148 |
| SOM CENTER RD | 100 |
| ERIE ST | 86 |
| NORTH LN | 82 |
| LAKE SHORE BLVD | 76 |
| TAMARAC BLVD | 72 |
| VINE ST | 62 |
| HAMANN PKY | 60 |
| SR2 | 58 |
| SR306 | 54 |
| ERIE RD | 52 |
| MENTOR AVE | 48 |
| BEN HUR AVE | 42 |
| KIRTLAND RD | 40 |
| MAPLEGROVE RD | 38 |
| IS90 | 34 |
| STEVENS BLVD | 34 |
| CENTER ST | 30 |
| CHEROKEE TRL | 30 |
| GROVE AVE | 30 |
| ROBINHOOD DR | 30 |
| WOOD RD | 30 |
| RIVER ST | 28 |
| 355 ST | 26 |
| BEIDLER RD | 26 |
| EUCLID | 24 |
| JOHNNY CAKE RIDGE RD | 24 |
2002 - 2018 National Fire Incident Reporting System (NFIRS) incidents
- Incident types reported to NFIRS in Willoughby, OH
- 14,86557.4%Rescue & EMS
- 3,22512.5%Hazardous Condition
- 2,67810.3%Service Call
- 2,1138.2%False Alarm
- 2,0778.0%Fire
- 7442.9%Good Intent Call
- 1010.4%Overpressure Rupture
- 590.2%Special Incident
- 300.1%Severe Weather
- Fire incident types reported to NFIRS in Willoughby, OH
- 1,21158.3%Structure Fires
- 59828.8%Outside Fires
- 25312.2%Mobile Property/Vehicle Fires
- 150.7%Other
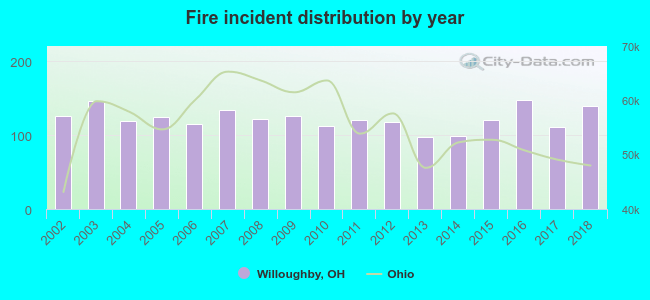 According to the data from the years 2002 - 2018 the average number of fires per year is 122. The highest number of reported fires - 147 took place in 2016, and the least - 97 in 2013. The data has an increasing trend.
The average number of yearly fire incidents per 10k residents in Willoughby, OH compared to nearest cities:
(Note: Based on data for the last 3 years, including only cities with population 5,000 and above)
| Willoughby: | 58.9 |
| Eastlake: | 50.2 |
| Willowick: | 35.7 |
| Wickliffe: | 50.3 |
| Mentor: | 21.3 |
| Willoughby Hills: | 56.7 |
| Kirtland: | 63.1 |
| Euclid: | 44.4 |
| Highland Heights: | 34.7 |
 The median response time based on all reported fire incidents is 4 minutes. This is lower compared to the Ohio median value.
The median response time in Willoughby, OH compared to nearest cities:
(Note: Based on data for all years, including only cities with at least 500 fire incidents)
| Willoughby: | 4 minutes |
| Eastlake: | 5 minutes |
| Willowick: | 4 minutes |
| Wickliffe: | 5 minutes |
| Mentor: | 6 minutes |
| Willoughby Hills: | 7 minutes |
| Kirtland: | 6 minutes |
| Euclid: | 5 minutes |
| Mayfield Heights: | 4 minutes |
 Based on the data from the years 2002 - 2018 the average number of fire-related fatalities per year is 1. The highest number of deaths - 2 took place in 2018, and the lowest - 0 in 2003. The data has a growing trend.
 Based on the data from the years 2002 - 2018 the average number of fire-related casualties per year is 5. The highest number of casualties - 12 took place in 2008, and the lowest - 1 in 2007. The data has a declining trend.
The average number of casualties per 1,000 fires is 42. This indicator was the highest - 98 in 2008, and the lowest 7 in 2018. The trend for injuries per 1,000 fire incidents is declining. Compared to the state value the number of casualties per 1,000 fires is much higher.
Based on the data from the years 2002 - 2018 the average number of fire-related casualties per year is 5. The highest number of casualties - 12 took place in 2008, and the lowest - 1 in 2007. The data has a declining trend.
The average number of casualties per 1,000 fires is 42. This indicator was the highest - 98 in 2008, and the lowest 7 in 2018. The trend for injuries per 1,000 fire incidents is declining. Compared to the state value the number of casualties per 1,000 fires is much higher.Casualties per 1,000 incidents in Willoughby, OH compared to nearest cities:
(Note: Based on data for all years, including only cities with at least 500 fire incidents)
| Willoughby: | 41.4 |
| Eastlake: | 55.6 |
| Willowick: | 12.7 |
| Wickliffe: | 22.5 |
| Mentor: | 20.3 |
| Willoughby Hills: | 14.3 |
| Kirtland: | 3.4 |
| Euclid: | 15.5 |
| Mayfield Heights: | 5.3 |
 33.7% incidents where reported in the morning and 66.3% in the evening. The most fires (16.1%) took place on Tuesday, and the least (12.6%) on Sunday.
 According to the 2,077 fire incidents from years 2002 - 2018 most fires (11.4%) took place during July, and the least (6.5%) in October.
 Out of all 25,892 cases reported during the years 2002 - 2018, the most belonged to the categories: Rescue & EMS (57.4%), Hazardous Condition (12.5%), and Service Call (10.3%).
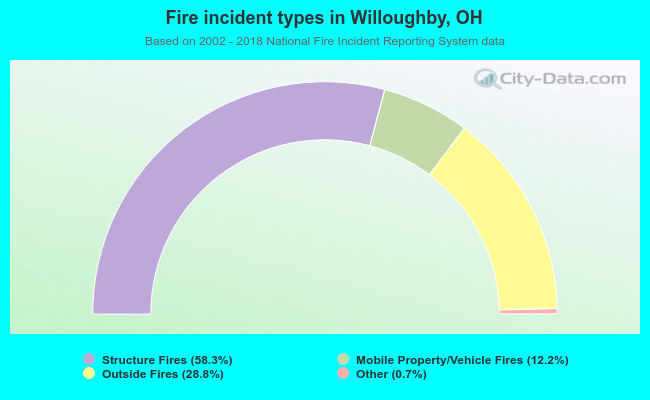 When looking into fire subcategories, the most incidents belonged to: Structure Fires (58.3%), and Outside Fires (28.8%).