Willow Springs: Fire Incidents, Illinois (IL)
Where are fire incidents reported in Willow Springs, IL
Something went wrong! Please refresh the page.
|
| |||||||||||||||||||||||||||||||||||||||||||||||||||||||||||||||||||||||||||||||||||||||||||||||||||||||||||||
2002 - 2018 National Fire Incident Reporting System (NFIRS) incidents
- Incident types reported to NFIRS in Willow Springs, IL
- 2,18355.5%Rescue & EMS
- 47212.0%Fire
- 41610.6%False Alarm
- 41410.5%Hazardous Condition
- 2496.3%Service Call
- 1934.9%Good Intent Call
- 50.1%Overpressure Rupture
- Fire incident types reported to NFIRS in Willow Springs, IL
- 22547.7%Structure Fires
- 15833.5%Outside Fires
- 6313.3%Mobile Property/Vehicle Fires
- 265.5%Other
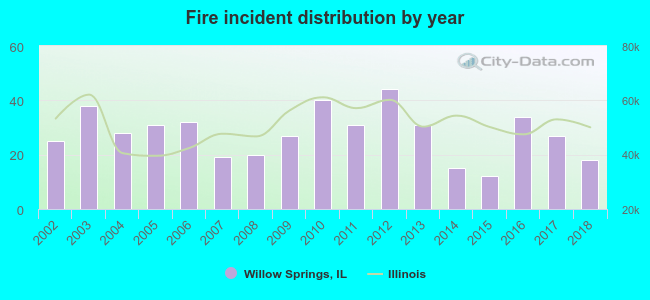 According to the data from the years 2002 - 2018 the average number of fires per year is 28. The highest number of fires - 44 took place in 2012, and the least - 12 in 2015. The data has a declining trend.
The average number of yearly fire incidents per 10k residents in Willow Springs, IL compared to nearest cities:
(Note: Based on data for the last 3 years, including only cities with population 5,000 and above)
| Willow Springs: | 46.1 |
| Justice: | 60.7 |
| Burr Ridge: | 28.8 |
| Hickory Hills: | 40.0 |
| Countryside: | 48.1 |
| Bridgeview: | 83.7 |
| Palos Hills: | 37.6 |
| Willowbrook: | 46.0 |
| Summit: | 57.7 |

 27.5% incidents where reported in the morning and 72.5% in the evening. The most fires (17.6%) took place on Monday, and the least (12.5%) on Wednesday.
 Based on the 472 fire incident reports from years 2002 - 2018 most fires (12.9%) took place during April, and the least (5.5%) in November.
 Out of all 3,935 cases reported during the years 2002 - 2018, the most belonged to the categories: Rescue & EMS (55.5%), Fire (12.0%), and False Alarm (10.6%).
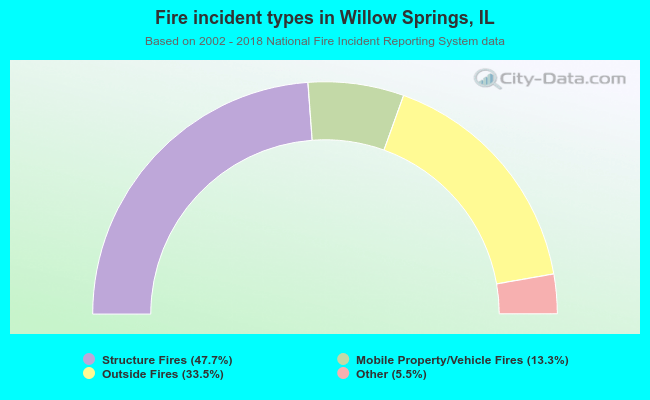 When looking into fire subcategories, the most incidents belonged to: Structure Fires (47.7%), and Outside Fires (33.5%).