Winnsboro: Fire Incidents, South Carolina (SC)
Where are fire incidents reported in Winnsboro, SC
Something went wrong! Please refresh the page.
|
| |||||||||||||||||||||||||||||||||||||||||||||||||||||||||||||||||||||||||||||||||||||||||||||||||||||||||||||
| Other | 652 | |||||||||||||||||||||||||||||||||||||||||||||||||||||||||||||||||||||||||||||||||||||||||||||||||||||||||||||
2004 - 2018 National Fire Incident Reporting System (NFIRS) incidents
- Incident types reported to NFIRS in Winnsboro, SC
- 1,56456.9%Fire
- 47617.3%Rescue & EMS
- 30711.2%Hazardous Condition
- 2549.2%Good Intent Call
- 1124.1%False Alarm
- 301.1%Service Call
- 40.1%Severe Weather
- 40.1%Special Incident
- Fire incident types reported to NFIRS in Winnsboro, SC
- 64040.9%Structure Fires
- 55535.5%Outside Fires
- 32420.7%Mobile Property/Vehicle Fires
- 452.9%Other
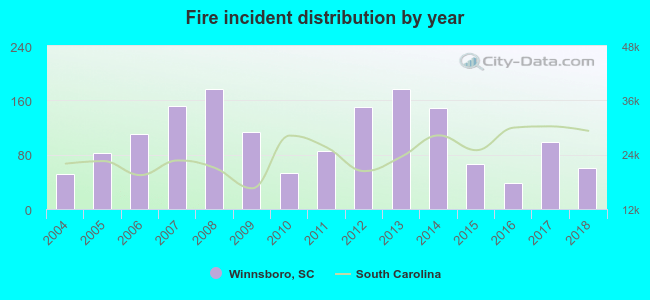 Based on the data from the years 2004 - 2018 the average number of fire incidents per year is 104. The highest number of fires - 177 took place in 2008, and the least - 38 in 2016. The data has an increasing trend.
 The median response time based on all reported fire incidents is 6 minutes. This is close to the state median value.
The median response time in Winnsboro, SC compared to nearest cities:
(Note: Based on data for all years, including only cities with at least 500 fire incidents)
| Winnsboro: | 6 minutes |
| Blythewood: | 9 minutes |
| Great Falls: | 6 minutes |
| Irmo: | 8 minutes |
| Chapin: | 8 minutes |
| Elgin: | 10 minutes |
| Chester: | 5 minutes |
| Richburg: | 7 minutes |
| Lugoff: | 7 minutes |
 Based on the reports from the years 2004 - 2018 the average number of fire-related yearly deaths is 0. The highest number of reported deaths - 3 took place in 2017, and the lowest - 0 in 2004. The data has a constant trend.
 30.6% incidents where reported in the morning and 69.4% in the evening. The most fires (16.3%) took place on Saturday, and the least (12.7%) on Tuesday.
 Based on the 1,564 fires from years 2004 - 2018 most fires (11.8%) took place during March, and the least (5.2%) in September.
 Out of all 2,751 cases reported during the years 2004 - 2018, the most belonged to the categories: Fire (56.9%), Overpressure Rupture (17.3%), and Rescue & EMS (11.2%).
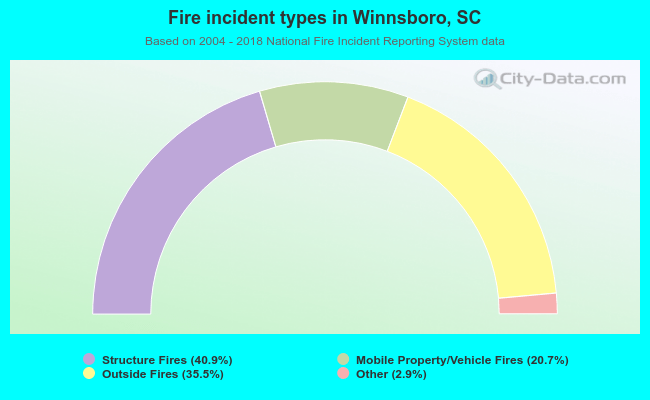 When looking into fire subcategories, the most reports belonged to: Structure Fires (40.9%), and Outside Fires (35.5%).