Chapin: Fire Incidents, South Carolina (SC)
Where are fire incidents reported in Chapin, SC
Something went wrong! Please refresh the page.
|
| |||||||||||||||||||||||||||||||||||||||||||||||||||||||||||||||||||||||||||||||||||||||||||||||||||||||||||||
2004 - 2018 National Fire Incident Reporting System (NFIRS) incidents
- Incident types reported to NFIRS in Chapin, SC
- 2,09041.3%Rescue & EMS
- 1,04220.6%Fire
- 62412.3%Good Intent Call
- 4669.2%False Alarm
- 4278.4%Service Call
- 3917.7%Hazardous Condition
- 180.4%Severe Weather
- Fire incident types reported to NFIRS in Chapin, SC
- 57355.0%Outside Fires
- 32431.1%Structure Fires
- 13713.1%Mobile Property/Vehicle Fires
- 80.8%Other
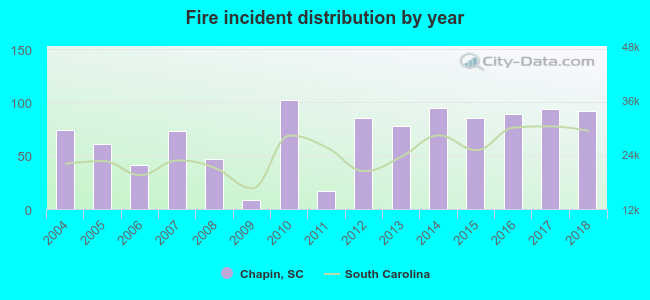 According to the data from the years 2004 - 2018 the average number of fires per year is 69. The highest number of fire incidents - 102 took place in 2010, and the least - 8 in 2009. The data has an increasing trend.
 The median response time based on all reported fire incidents is 8 minutes. This is higher compared to the state median value.
The median response time in Chapin, SC compared to nearest cities:
(Note: Based on data for all years, including only cities with at least 500 fire incidents)
| Chapin: | 8 minutes |
| Irmo: | 8 minutes |
| Lexington: | 7 minutes |
| Gilbert: | 8 minutes |
| Newberry: | 5 minutes |
| West Columbia: | 6 minutes |
| Winnsboro: | 6 minutes |
| Blythewood: | 9 minutes |
| Cayce: | 5 minutes |
 28.3% incidents where reported in the morning and 71.7% in the evening. The most fires (17.5%) took place on Saturday, and the least (11.6%) on Thursday.
 Based on the 1,042 incident reports from years 2004 - 2018 most fires (11.7%) took place during January, and the least (6.1%) in October.
 Out of all 5,066 cases reported during the years 2004 - 2018, the most belonged to the categories: Rescue & EMS (41.3%), Fire (20.6%), and Good Intent Call (12.3%).
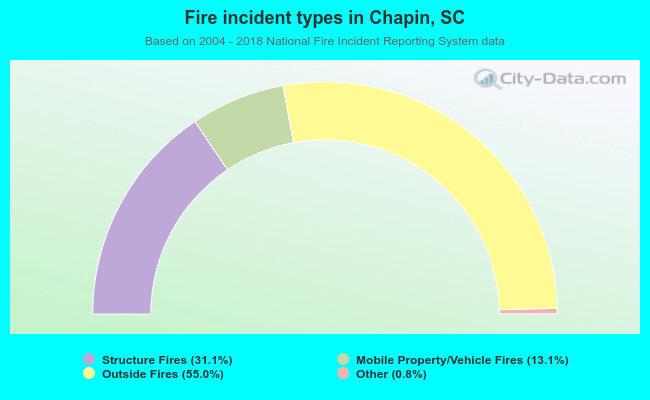 When looking into fire subcategories, the most reports belonged to: Outside Fires (55.0%), and Structure Fires (31.1%).