Wonder Lake: Fire Incidents, Illinois (IL)
Where are fire incidents reported in Wonder Lake, IL
Something went wrong! Please refresh the page.
|
| |||||||||||||||||||||||||||||||||||||||||||||||||||||||||||||||||||||||||||||||||||||||||||||||||||||||||||||
| Other | 10 | |||||||||||||||||||||||||||||||||||||||||||||||||||||||||||||||||||||||||||||||||||||||||||||||||||||||||||||
2002 - 2018 National Fire Incident Reporting System (NFIRS) incidents
- Incident types reported to NFIRS in Wonder Lake, IL
- 2,89459.3%Rescue & EMS
- 82216.8%Fire
- 53410.9%Hazardous Condition
- 3507.2%Service Call
- 1402.9%False Alarm
- 1382.8%Good Intent Call
- Fire incident types reported to NFIRS in Wonder Lake, IL
- 48559.0%Structure Fires
- 24229.4%Outside Fires
- 607.3%Mobile Property/Vehicle Fires
- 354.3%Other
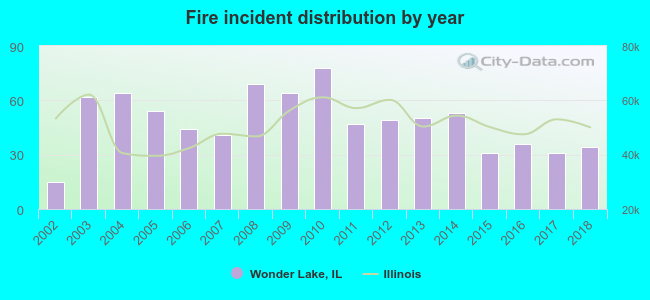 According to the data from the years 2002 - 2018 the average number of fires per year is 48. The highest number of fires - 78 took place in 2010, and the least - 15 in 2002. The data has an increasing trend.
The average number of yearly fire incidents per 10k residents in Wonder Lake, IL compared to nearest cities:
(Note: Based on data for the last 3 years, including only cities with population 5,000 and above)
| Wonder Lake: | 37.5 |
| McHenry: | 43.8 |
| Johnsburg: | 24.4 |
| Woodstock: | 38.0 |
| Spring Grove: | 71.0 |
| Lakemoor: | 28.3 |
| Fox Lake: | 42.2 |
| Island Lake: | 28.6 |
| Crystal Lake: | 24.9 |
 The median response time based on all reported fire incidents is 7 minutes. This is higher than the Illinois median value.
The median response time in Wonder Lake, IL compared to nearest cities:
(Note: Based on data for all years, including only cities with at least 500 fire incidents)
| Wonder Lake: | 7 minutes |
| McHenry: | 5 minutes |
| Richmond: | 6 minutes |
| Woodstock: | 6 minutes |
| Spring Grove: | 6 minutes |
| Fox Lake: | 6 minutes |
| Crystal Lake: | 6 minutes |
| Round Lake: | 5 minutes |
| Cary: | 5 minutes |
 34.3% incidents where reported in the morning and 65.7% in the evening. The most fires (17.5%) took place on Friday, and the least (9.7%) on Tuesday.
 Based on the 822 fire incidents from years 2002 - 2018 most fires (11.1%) took place during April, and the least (6.0%) in February.
 Out of all 4,882 cases reported during the years 2002 - 2018, the most belonged to the categories: Rescue & EMS (59.3%), Fire (16.8%), and Hazardous Condition (10.9%).
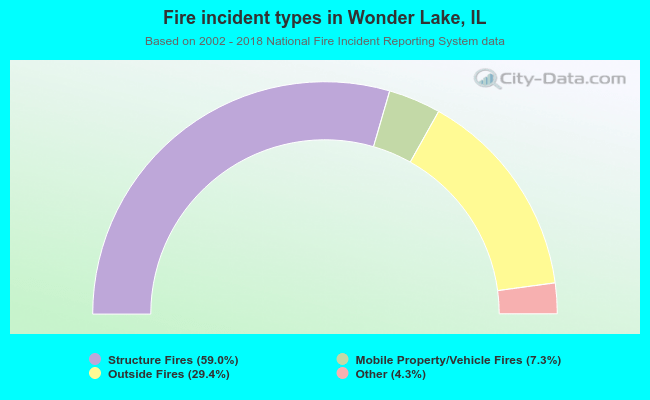 When looking into fire subcategories, the most incidents belonged to: Structure Fires (59.0%), and Outside Fires (29.4%).