Crystal Lake: Fire Incidents, Illinois (IL)
Where are fire incidents reported in Crystal Lake, IL
Something went wrong! Please refresh the page.
| Fire incidents reported | |
|---|---|
| Sreet name | Count |
| NORTHWEST HWY | 180 |
| VIRGINIA ST | 88 |
| MAIN ST | 72 |
| ROUTE 31 HWY | 64 |
| WOODSTOCK ST | 52 |
| MCHENRY AVE | 50 |
| TERRA COTTA AVE | 48 |
| VIRGINIA RD | 48 |
| NORTHWEST HY | 40 |
| RIVERSIDE DR | 38 |
| CARRINGTON DR | 36 |
| HUNTLEY RD | 36 |
| ALEXANDRA BLVD | 32 |
| CARLEMONT DR | 32 |
| CRYSTAL LAKE AVE | 32 |
| NORTH SHORE DR | 30 |
| ROUTE 176 HWY | 30 |
| STATE ROUTE 176 | 30 |
| ELMHURST ST | 28 |
| HILLSIDE RD | 28 |
| ILLINOIS ST | 28 |
| ROUTE 176 | 28 |
| SHERWOOD DR | 28 |
| BLUE CT | 26 |
| RANDALL RD | 26 |
| WILLIAMS ST | 26 |
| BERKSHIRE DR | 24 |
| GOLF COURSE RD | 24 |
| WALKUP AVE | 24 |
| WEDGEWOOD DR | 24 |
| Other | 910 |
2002 - 2018 National Fire Incident Reporting System (NFIRS) incidents
- Incident types reported to NFIRS in Crystal Lake, IL
- 22,81959.1%Rescue & EMS
- 4,88212.6%False Alarm
- 3,7109.6%Hazardous Condition
- 3,3918.8%Service Call
- 2,1625.6%Fire
- 1,5384.0%Good Intent Call
- 580.2%Severe Weather
- 430.1%Special Incident
- Fire incident types reported to NFIRS in Crystal Lake, IL
- 1,07749.8%Structure Fires
- 71933.3%Outside Fires
- 28213.0%Mobile Property/Vehicle Fires
- 843.9%Other
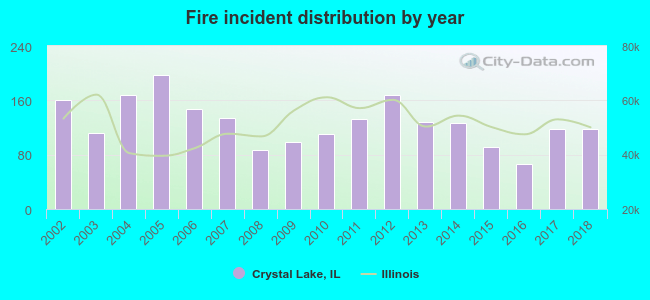 According to the data from the years 2002 - 2018 the average number of fire incidents per year is 127. The highest number of reported fires - 198 took place in 2005, and the least - 66 in 2016. The data has a decreasing trend.
The average number of yearly fire incidents per 10k residents in Crystal Lake, IL compared to nearest cities:
(Note: Based on data for the last 3 years, including only cities with population 5,000 and above)
| Crystal Lake: | 24.9 |
| Lake in the Hills: | 10.8 |
| Cary: | 25.9 |
| Algonquin: | 14.0 |
| Huntley: | 21.0 |
| Island Lake: | 28.6 |
| Carpentersville: | 23.7 |
| McHenry: | 43.8 |
| Woodstock: | 38.0 |
 The median response time based on all reported fire incidents is 6 minutes. This is comparable to the state median value.
The median response time in Crystal Lake, IL compared to nearest cities:
(Note: Based on data for all years, including only cities with at least 500 fire incidents)
| Crystal Lake: | 6 minutes |
| Lake in the Hills: | 5 minutes |
| Cary: | 5 minutes |
| Algonquin: | 5 minutes |
| Huntley: | 7 minutes |
| Carpentersville: | 5 minutes |
| McHenry: | 5 minutes |
| Woodstock: | 6 minutes |
| Wauconda: | 6 minutes |
 Based on the data from the years 2002 - 2018 the average number of fire-related fatalities per year is 0. The highest number of deaths - 1 took place in 2011, and the lowest - 0 in 2002. The data has a growing trend.
 According to the reports from the years 2002 - 2018 the average number of fire-related yearly casualties is 1. The highest number of casualties - 6 took place in 2002, and the lowest - 0 in 2004. The data has a dropping trend.
The average number of casualties per 1,000 fire incidents is 10. This indicator was the highest - 38 in 2002, and the lowest 0 in 2004. The trend for injuries per 1,000 incidents is dropping. Compared to the state value the number of injuries per 1,000 fires is about the same.
According to the reports from the years 2002 - 2018 the average number of fire-related yearly casualties is 1. The highest number of casualties - 6 took place in 2002, and the lowest - 0 in 2004. The data has a dropping trend.
The average number of casualties per 1,000 fire incidents is 10. This indicator was the highest - 38 in 2002, and the lowest 0 in 2004. The trend for injuries per 1,000 incidents is dropping. Compared to the state value the number of injuries per 1,000 fires is about the same.Casualties per 1,000 incidents in Crystal Lake, IL compared to nearest cities:
(Note: Based on data for all years, including only cities with at least 500 fire incidents)
| Crystal Lake: | 9.7 |
| Lake in the Hills: | 6.1 |
| Cary: | 1.4 |
| Algonquin: | 7.7 |
| Huntley: | 1.9 |
| Carpentersville: | 13.6 |
| McHenry: | 23.6 |
| Woodstock: | 12.7 |
| Wauconda: | 7.1 |
 28.6% incidents where reported in the morning and 71.4% in the evening. The most fires (15.1%) took place on Monday, and the least (13.1%) on Tuesday.
 According to the 2,162 fire incidents from years 2002 - 2018 most fires (15.4%) took place during April, and the least (5.9%) in February.
 Out of all 38,617 cases reported during the years 2002 - 2018, the most belonged to the categories: Rescue & EMS (59.1%), False Alarm (12.6%), and Hazardous Condition (9.6%).
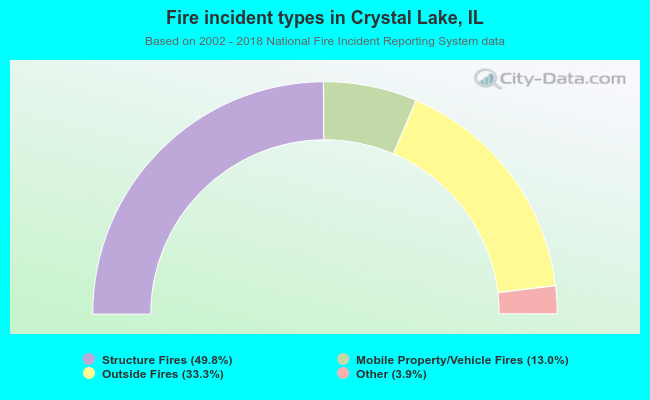 When looking into fire subcategories, the most incidents belonged to: Structure Fires (49.8%), and Outside Fires (33.3%).