Woodland Park: Fire Incidents, Colorado (CO)
Where are fire incidents reported in Woodland Park, CO
Something went wrong! Please refresh the page.
|
| |||||||||||||||||||||||||||||||||||||||||||||||||||||||||||||||||||||||||||||||||||||||||||||||||||||||||||||
| Other | 68 | |||||||||||||||||||||||||||||||||||||||||||||||||||||||||||||||||||||||||||||||||||||||||||||||||||||||||||||
2005 - 2018 National Fire Incident Reporting System (NFIRS) incidents
- Incident types reported to NFIRS in Woodland Park, CO
- 2,61750.4%Rescue & EMS
- 81415.7%Hazardous Condition
- 59811.5%Good Intent Call
- 5149.9%Fire
- 3647.0%Service Call
- 2695.2%False Alarm
- 130.3%Special Incident
- Fire incident types reported to NFIRS in Woodland Park, CO
- 22644.0%Structure Fires
- 20539.9%Outside Fires
- 5310.3%Mobile Property/Vehicle Fires
- 305.8%Other
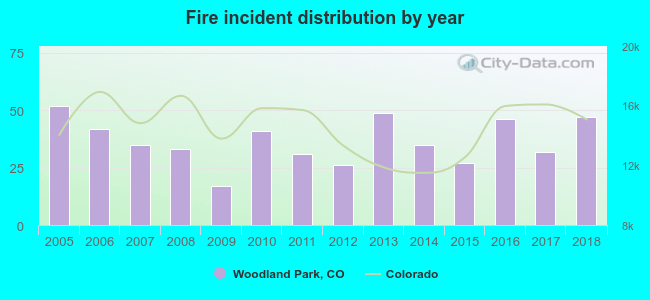 According to the data from the years 2005 - 2018 the average number of fires per year is 37. The highest number of reported fires - 52 took place in 2005, and the least - 17 in 2009. The data has a declining trend.
The average number of yearly fire incidents per 10k residents in Woodland Park, CO compared to nearest cities:
(Note: Based on data for the last 3 years, including only cities with population 5,000 and above)
| Woodland Park: | 57.9 |
| Divide: | 9.4 |
| Air Force Academy: | 1.5 |
| Monument: | 78.8 |
| Manitou Springs: | 23.8 |
| Gleneagle: | 4.0 |
| Woodmoor: | 2.3 |
| Colorado Springs: | 17.3 |
| Black Forest: | 10.7 |
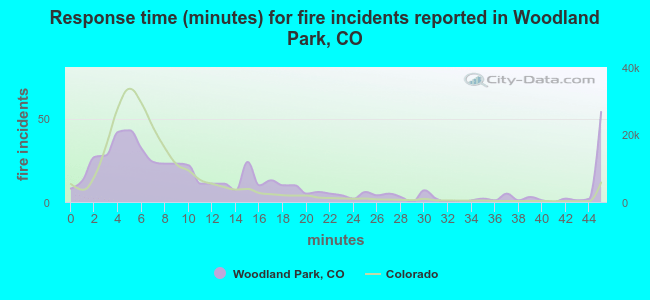 The median response time based on all reported fire incidents is 9 minutes. This is higher than the state median value.
The median response time in Woodland Park, CO compared to nearest cities:
(Note: Based on data for all years, including only cities with at least 500 fire incidents)
| Woodland Park: | 9 minutes |
| Monument: | 8 minutes |
| Colorado Springs: | 6 minutes |
| Fountain: | 5 minutes |
| Castle Rock: | 7 minutes |
| Sedalia: | 15 minutes |
| Peyton: | 12 minutes |
| Elizabeth: | 8 minutes |
| Highlands Ranch: | 7 minutes |
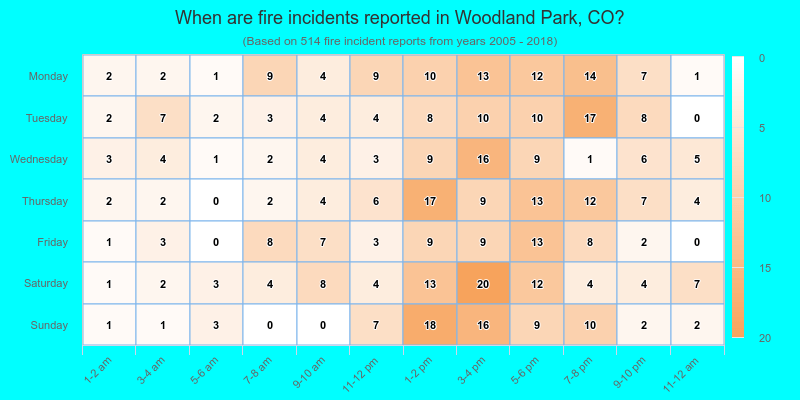
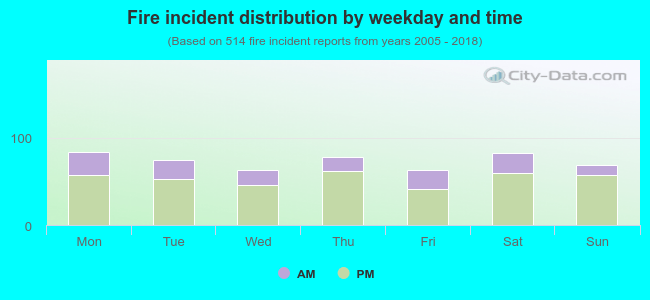 26.8% incidents where reported in the morning and 73.2% in the evening. The most fires (16.3%) took place on Monday, and the least (12.3%) on Wednesday.
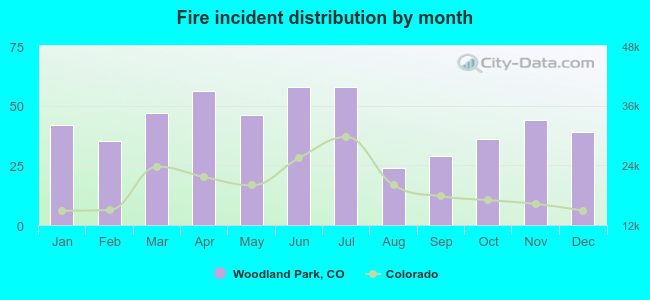 Based on the 514 reports from years 2005 - 2018 most fires (11.3%) took place during June, and the least (4.7%) in August.
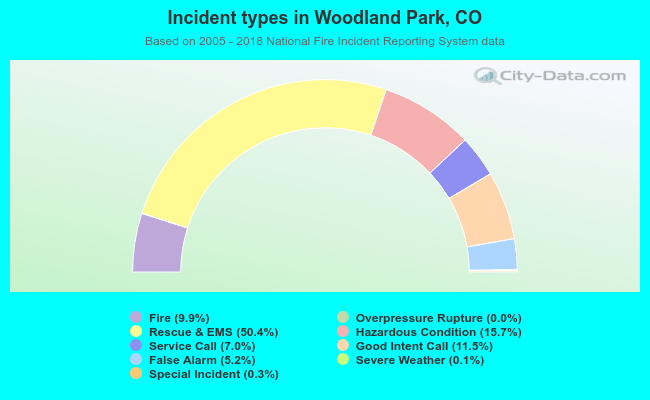 Out of all 5,196 cases reported during the years 2005 - 2018, the most belonged to the categories: Rescue & EMS (50.4%), Hazardous Condition (15.7%), and Good Intent Call (11.5%).
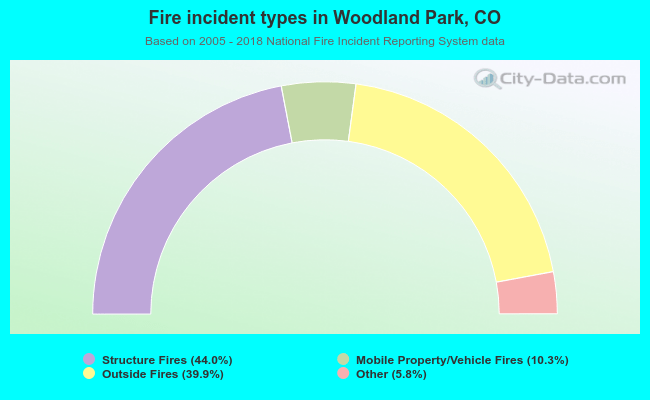 When looking into fire subcategories, the most reports belonged to: Structure Fires (44.0%), and Outside Fires (39.9%).