Ypsilanti: Fire Incidents, Michigan (MI)
Where are fire incidents reported in Ypsilanti, MI
Something went wrong! Please refresh the page.
| Fire incidents reported | |
|---|---|
| Sreet name | Count |
| MICHIGAN AVE | 670 |
| WASHTENAW AVE | 358 |
| CROSS ST | 180 |
| HOLMES RD | 152 |
| GREEN RD | 140 |
| HURON RIVER DR | 136 |
| 94 EXPY | 134 |
| HARRIS RD | 122 |
| MACARTHUR BLVD | 118 |
| CLARK RD | 116 |
| INTERNATIONAL DR | 100 |
| PROSPECT ST | 100 |
| ECORSE RD | 98 |
| HURON ST | 96 |
| GROVE RD | 92 |
| TEXTILE RD | 92 |
| GROVE ST | 88 |
| ELLSWORTH RD | 84 |
| TYLER RD | 80 |
| HAMILTON ST | 70 |
| PEARL ST | 64 |
| 94 | 62 |
| MONROE ST | 62 |
| RIDGE RD | 62 |
| CARPENTER RD | 58 |
| CHIDESTER ST | 58 |
| NORMAL ST | 58 |
| RAWSONVILLE RD | 58 |
| WASHINGTON ST | 56 |
| WHITTAKER RD | 56 |
| Other | 1,752 |
2002 - 2018 National Fire Incident Reporting System (NFIRS) incidents
- Incident types reported to NFIRS in Ypsilanti, MI
- 16,89444.3%Rescue & EMS
- 5,37214.1%Fire
- 5,36414.1%Good Intent Call
- 5,31913.9%Hazardous Condition
- 2,6647.0%Service Call
- 2,2595.9%False Alarm
- 1810.5%Special Incident
- 950.2%Overpressure Rupture
- Fire incident types reported to NFIRS in Ypsilanti, MI
- 2,78851.9%Structure Fires
- 1,51328.2%Outside Fires
- 87416.3%Mobile Property/Vehicle Fires
- 1973.7%Other
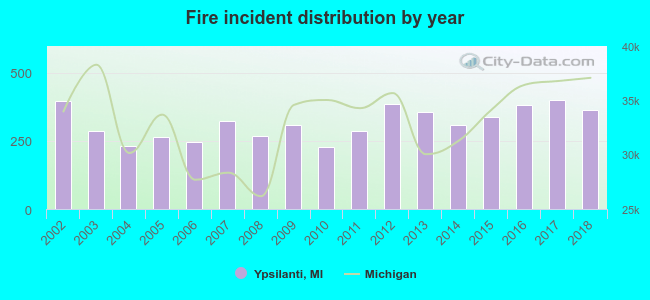 Based on the data from the years 2002 - 2018 the average number of fire incidents per year is 316. The highest number of reported fire incidents - 399 took place in 2017, and the least - 229 in 2010. The data has a decreasing trend.
The average number of yearly fire incidents per 10k residents in Ypsilanti, MI compared to nearest cities:
(Note: Based on data for the last 3 years, including only cities with population 5,000 and above)
| Ypsilanti: | 189.9 |
| Ann Arbor: | 29.5 |
| Canton: | 16.6 |
| Saline: | 48.4 |
| Plymouth Township: | 2.4 |
| Milan: | 71.1 |
| Plymouth: | 102.2 |
| Wayne: | 44.5 |
| Romulus: | 49.8 |
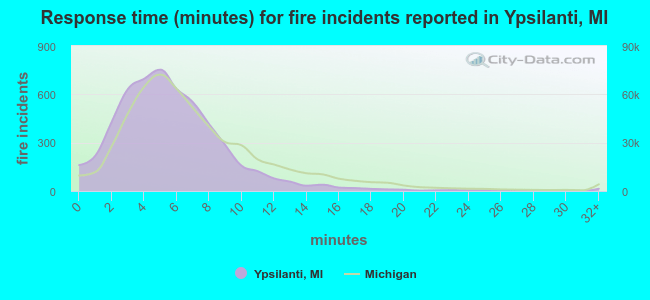 The median response time based on all reported fire incidents is 5 minutes. This is lower compared to the state median value.
The median response time in Ypsilanti, MI compared to nearest cities:
(Note: Based on data for all years, including only cities with at least 500 fire incidents)
| Ypsilanti: | 5 minutes |
| Ann Arbor: | 5 minutes |
| Belleville: | 7 minutes |
| Canton: | 6 minutes |
| Saline: | 6 minutes |
| Milan: | 10 minutes |
| Plymouth: | 6 minutes |
| Wayne: | 5 minutes |
| Romulus: | 7 minutes |
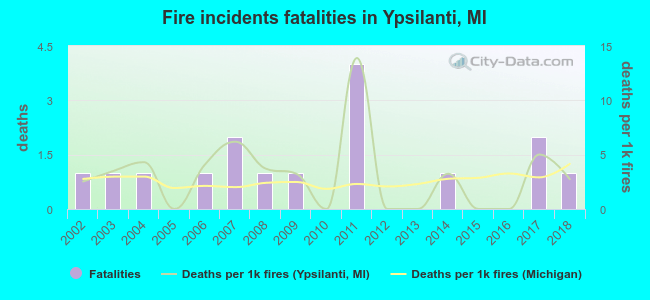 According to the data from the years 2002 - 2018 the average number of fire-related fatalities per year is 1. The highest number of deaths - 4 took place in 2011, and the lowest - 0 in 2005. The data has a constant trend.
The average number of fatalities per 1,000 fire incidents is 3. This indicator was the highest - 14 in 2011, and the lowest 0 in 2005. The trend for fatalities per 1,000 incidents is rising. Compared to the state value the number of deaths per 1,000 fire incidents is similar.
According to the data from the years 2002 - 2018 the average number of fire-related fatalities per year is 1. The highest number of deaths - 4 took place in 2011, and the lowest - 0 in 2005. The data has a constant trend.
The average number of fatalities per 1,000 fire incidents is 3. This indicator was the highest - 14 in 2011, and the lowest 0 in 2005. The trend for fatalities per 1,000 incidents is rising. Compared to the state value the number of deaths per 1,000 fire incidents is similar.
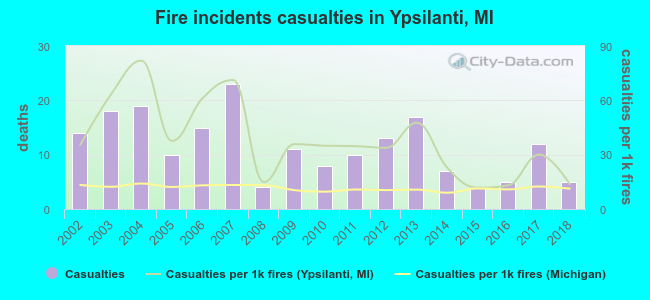 According to the data from the years 2002 - 2018 the average number of fire-related yearly casualties is 11. The highest number of injuries - 23 took place in 2007, and the lowest - 4 in 2008. The data has a decreasing trend.
The average number of injuries per 1,000 fire incidents is 38. This indicator was the highest - 82 in 2004, and the lowest 12 in 2015. The trend for injuries per 1,000 fires is declining. Compared to the Michigan value the number of injuries per 1,000 fire incidents is much higher.
According to the data from the years 2002 - 2018 the average number of fire-related yearly casualties is 11. The highest number of injuries - 23 took place in 2007, and the lowest - 4 in 2008. The data has a decreasing trend.
The average number of injuries per 1,000 fire incidents is 38. This indicator was the highest - 82 in 2004, and the lowest 12 in 2015. The trend for injuries per 1,000 fires is declining. Compared to the Michigan value the number of injuries per 1,000 fire incidents is much higher.
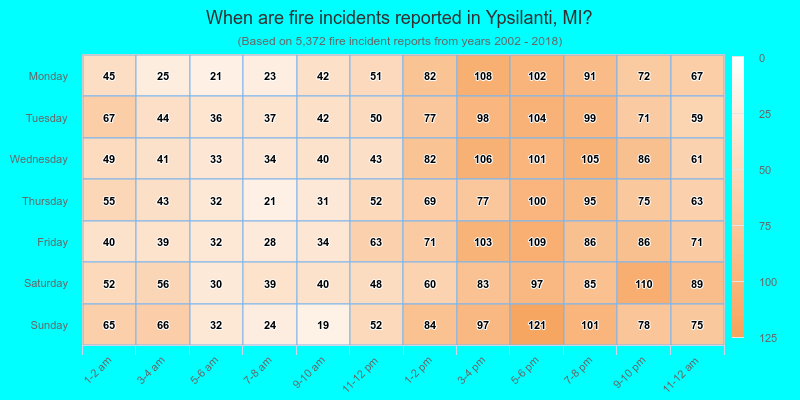
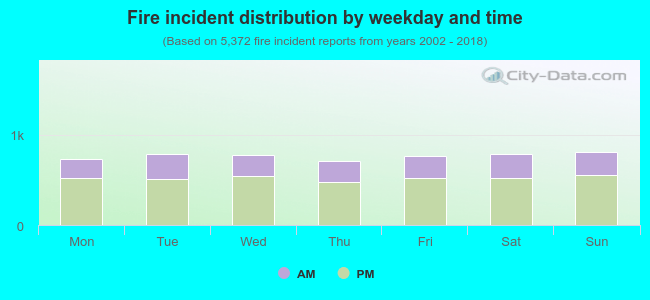 31.9% incidents where reported in the morning and 68.1% in the evening. The most fires (15.2%) took place on Sunday, and the least (13.3%) on Thursday.
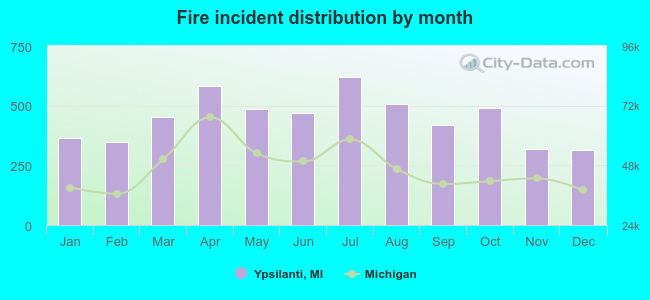 According to the 5,372 fire incidents from years 2002 - 2018 most fires (11.6%) took place during July, and the least (5.8%) in December.
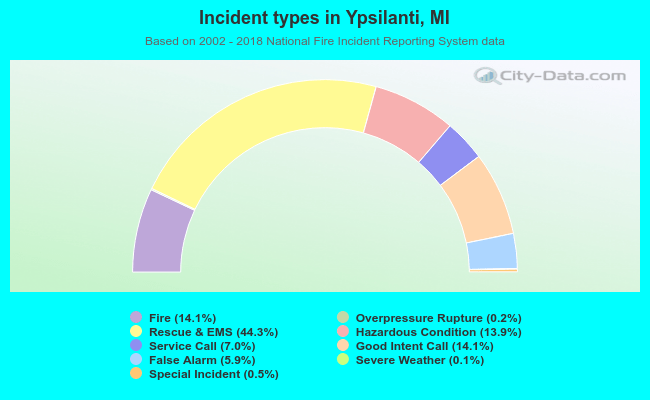 Out of all 38,168 cases reported during the years 2002 - 2018, the most belonged to the categories: Rescue & EMS (44.3%), Fire (14.1%), and Good Intent Call (14.1%).
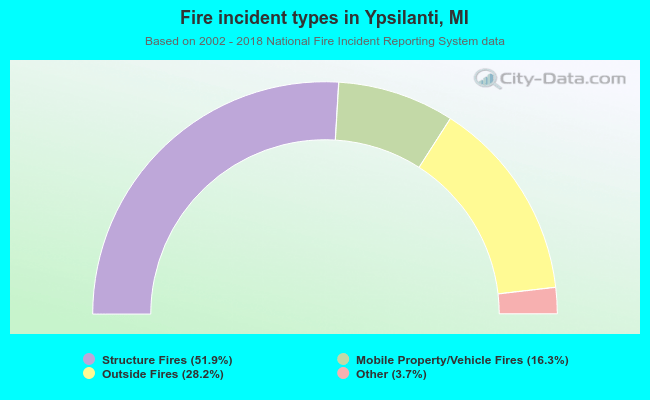 When looking into fire subcategories, the most incidents belonged to: Structure Fires (51.9%), and Outside Fires (28.2%).