Wayne: Fire Incidents, Michigan (MI)
Where are fire incidents reported in Wayne, MI
Something went wrong! Please refresh the page.
| Fire incidents reported | |
|---|---|
| Sreet name | Count |
| MICHIGAN AVE | 246 |
| MICHIGAN | 140 |
| VAN BORN RD | 76 |
| WAYNE RD | 64 |
| VAN BORN | 60 |
| WILLIAMS | 42 |
| HOWE RD | 38 |
| VENOY RD | 36 |
| CHESTNUT | 34 |
| SIMS | 30 |
| HOWE | 28 |
| WAYNE | 28 |
| WILLIAMS ST | 28 |
| FOREST | 26 |
| FOREST AVE | 24 |
| ANNAPOLIS AVE | 22 |
| GLENWOOD | 22 |
| ANNAPOLIS | 20 |
| HANNAN RD | 20 |
| VENOY | 20 |
| NIAGARA ST | 18 |
| WINIFRED | 18 |
| 2ND ST | 16 |
| BRUSH | 16 |
| GLADWIN CT | 16 |
| GLORIA | 16 |
| MILDRED | 16 |
| SIMS ST | 16 |
| VANBORN | 16 |
| ELIZABETH | 14 |
2002 - 2018 National Fire Incident Reporting System (NFIRS) incidents
- Incident types reported to NFIRS in Wayne, MI
- 1,29426.3%Hazardous Condition
- 1,22024.8%Rescue & EMS
- 1,00720.5%Fire
- 54511.1%False Alarm
- 51610.5%Good Intent Call
- 3096.3%Service Call
- 130.3%Overpressure Rupture
- 100.2%Special Incident
- Fire incident types reported to NFIRS in Wayne, MI
- 48448.1%Structure Fires
- 23523.3%Outside Fires
- 20820.7%Mobile Property/Vehicle Fires
- 807.9%Other
 Based on the data from the years 2002 - 2018 the average number of fires per year is 59. The highest number of fire incidents - 120 took place in 2003, and the least - 0 in 2014. The data has an increasing trend.
The average number of yearly fire incidents per 10k residents in Wayne, MI compared to nearest cities:
(Note: Based on data for the last 3 years, including only cities with population 5,000 and above)
| Wayne: | 44.5 |
| Westland: | 25.0 |
| Romulus: | 49.8 |
| Inkster: | 58.9 |
| Garden City: | 29.7 |
| Dearborn Heights: | 21.7 |
| Canton: | 16.6 |
| Taylor: | 28.1 |
| Plymouth: | 102.2 |
 The median response time based on all reported fire incidents is 5 minutes. This is lower than the state median value.
The median response time in Wayne, MI compared to nearest cities:
(Note: Based on data for all years, including only cities with at least 500 fire incidents)
| Wayne: | 5 minutes |
| Westland: | 6 minutes |
| Romulus: | 7 minutes |
| Inkster: | 5 minutes |
| Garden City: | 5 minutes |
| Dearborn Heights: | 6 minutes |
| Canton: | 6 minutes |
| Taylor: | 4 minutes |
| Belleville: | 7 minutes |
 According to the reports from the years 2002 - 2018 the average number of fire-related casualties per year is 2. The highest number of injuries - 7 took place in 2003, and the lowest - 0 in 2007. The data has a rising trend.
The average number of injuries per 1,000 fires is 22. This indicator was the highest - 71 in 2004, and the lowest 0 in 2007. The trend for casualties per 1,000 fire incidents is increasing. Compared to the Michigan value the number of casualties per 1,000 fire incidents is much higher.
According to the reports from the years 2002 - 2018 the average number of fire-related casualties per year is 2. The highest number of injuries - 7 took place in 2003, and the lowest - 0 in 2007. The data has a rising trend.
The average number of injuries per 1,000 fires is 22. This indicator was the highest - 71 in 2004, and the lowest 0 in 2007. The trend for casualties per 1,000 fire incidents is increasing. Compared to the Michigan value the number of casualties per 1,000 fire incidents is much higher.Casualties per 1,000 incidents in Wayne, MI compared to nearest cities:
(Note: Based on data for all years, including only cities with at least 500 fire incidents)
| Wayne: | 31.8 |
| Westland: | 14.1 |
| Romulus: | 14.2 |
| Inkster: | 8.1 |
| Garden City: | 29.5 |
| Dearborn Heights: | 21.4 |
| Canton: | 24.2 |
| Taylor: | 19.3 |
| Belleville: | 8.6 |
 31.8% incidents where reported in the morning and 68.2% in the evening. The most fires (17.2%) took place on Thursday, and the least (10.6%) on Friday.
 According to the 1,007 fires from years 2002 - 2018 most fires (12.1%) took place during July, and the least (5.9%) in January.
 Out of all 4,915 cases reported during the years 2002 - 2018, the most belonged to the categories: Hazardous Condition (26.3%), Rescue & EMS (24.8%), and Fire (20.5%).
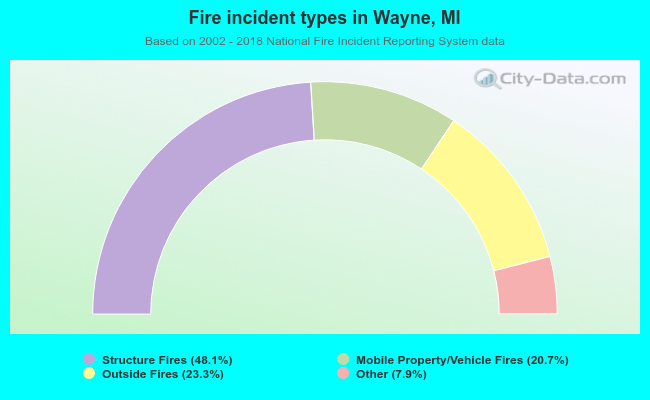 When looking into fire subcategories, the most reports belonged to: Structure Fires (48.1%), and Outside Fires (23.3%).