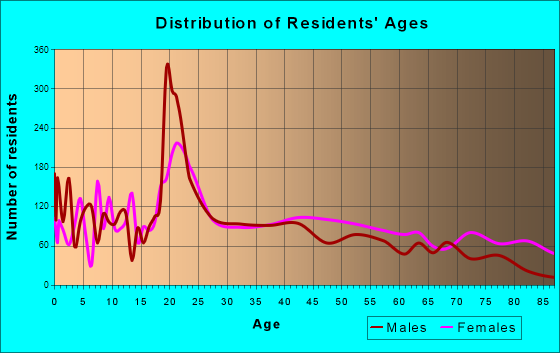
Ada, OK (Oklahoma) Houses and Residents
Estimated median house or condo value in 2022: $149,875 (it was $59,200 in 2000 )
Ada:
$149,875Oklahoma:
$191,700
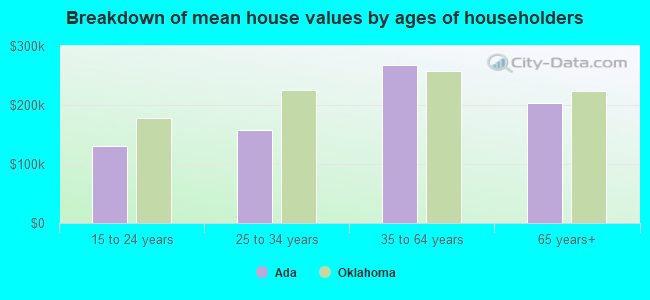
Lower value quartile - upper value quartile: $93,594 - $240,186Mean price in 2022: Detached houses: $208,857 Here:
$208,857State:
$255,409
Townhouses or other attached units: $231,144 Here:
$231,144State:
$206,466
In 2-unit structures: $182,625 Here:
$182,625State:
$195,100
Mobile homes: $73,664 Here:
$73,664State:
$110,804
Total population: 17,130 (Urban population: 14,983 (all inside urban clusters), Rural population: 661 (9 farm, 652 nonfarm ))
Houses: 8,052 (6,622 occupied: 2,943 owner occupied, 3,803 renter occupied )
% of renters here:
56%State:
35%
Housing density: 513 houses/condos per square mile
Median price asked for vacant for-sale houses and condos in 2022: $113,287.
Median contract rent in 2022: $648 (lower quartile is $483, upper quartile is $823)
Median rent asked for vacant for-rent units in 2022: $763
Median gross rent in Ada, OK in 2022: $855
Housing units in Ada with a mortgage: 1,680 (80 second mortgage, 0 home equity loan, 33 both second mortgage and home equity loan )Houses without a mortgage: 16
Median household income for houses/condos with a mortgage: $94,109
Median household income for apartments without a mortgage: $55,830
Median monthly housing costs: $866
Data:
Median house or condo value ($)
Median house or condo value ($ change since 2000)
Median house or condo value ($) - White
Median house or condo value ($) - Black or African American
Median house or condo value ($) - Asian
Median house or condo value ($) - Hispanic or Latino
Median house or condo value ($) - American Indian and Alaska Native
Median house or condo value ($) - Multirace
Median house or condo value ($) - Other Race
Median price asked for mobile homes ($)
Household density (households per square mile)
Mean house or condo value by units in structure - 1, detached ($)
Mean house or condo value by units in structure - 1, attached ($)
Mean house or condo value by units in structure - 2 ($)
Mean house or condo value by units in structure by units in structure - 3 or 4 ($)
Mean house or condo value by units in structure - 5 or more ($)
Mean house or condo value by units in structure - Boat, RV, van, etc. ($)
Mean house or condo value by units in structure - Mobile home ($)
Median contract rent ($)
Median contract rent - Lower quartile ($)
Median contract rent - Upper quartile ($)
Median gross rent ($)
Urban houses (%)
Rural houses (%)
Houses occupied (%)
Houses occupied (% change since 2000)
Houses owner occupied (%)
Houses owner occupied (% change since 2000)
Houses renter occupied (%)
Houses renter occupied (% change since 2000)
Vacant housing units - For rent (%)
Vacant housing units - For rent (% change since 2000)
Vacant housing units - For sale only (%)
Vacant housing units - For sale only (% change since 2000)
Vacant housing units - Rented or sold, not occupied (%)
Vacant housing units - Rented or sold, not occupied (% change since 2000)
Vacant housing units - For seasonal, recreational, or occasional use (%)
Vacant housing units - For seasonal, recreational, or occasional use (% change since 2000)
Vacant housing units - For migrant workers (%)
Vacant housing units - For migrant workers (% change since 2000)
Vacant housing units - Other vacant (%)
Vacant housing units - Other vacant (% change since 2000)
Median monthly housing costs ($)
Median household income for houses/condos with a mortgage ($)
Median household income for houses/condos without a mortgage ($)
Median household income ($)
Median household income ($) - White
Median household income ($) - Black or African American
Median household income ($) - Asian
Median household income ($) - Hispanic or Latino
Median household income ($) - American Indian and Alaska Native
Median household income ($) - Multirace
Median household income ($) - Other Race
Mortgage status - with mortgage (%)
Mortgage status - with second mortgage (%)
Mortgage status - with home equity loan (%)
Mortgage status - with both second mortgage and home equity loan (%)
Mortgage status - without a mortgage (%)
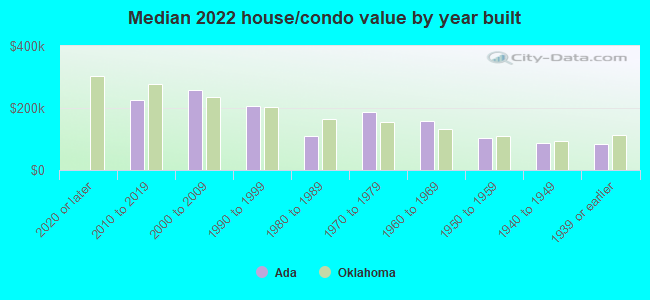
Median year house/condo built
Median year apartment built
Household type by relationship - Male householder living alone (%)
Household type by relationship - Male householder not living alone (%)
Household type by relationship - Female householder living alone (%)
Household type by relationship - Female householder not living alone (%)
Household type by relationship - Opposite-Sex spouse (%)
Household type by relationship - Same-Sex spouse (%)
Household type by relationship - Opposite-Sex unmarried partner (%)
Household type by relationship - Same-Sex unmarried partner (%)
Household type by relationship - In group quarters (%)
Size of family households - 2-person household (%)
Size of family households - 3-person household (%)
Size of family households - 4-person household (%)
Size of family households - 5-person household (%)
Size of family households - 6-person household (%)
Size of family households - 7-or-more-person household (%)
Size of nonfamily households - 1-person household (%)
Size of nonfamily households - 2-person household (%)
Size of nonfamily households - 3-person household (%)
Size of nonfamily households - 4-person household (%)
Size of nonfamily households - 5-person household (%)
Size of nonfamily households - 6-person household (%)
Size of nonfamily households - 7-or-moreperson household (%)
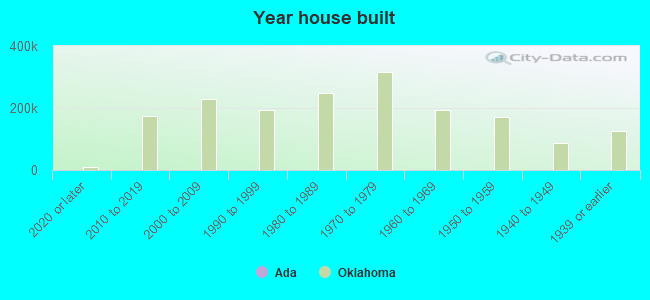
Year house built - Built 2010 or later (%)
Year house built - Built 2000 to 2009 (%)
Year house built - Built 1990 to 1999 (%)
Year house built - Built 1980 to 1989 (%)
Year house built - Built 1970 to 1979 (%)
Year house built - Built 1960 to 1969 (%)
Year house built - Built 1950 to 1959 (%)
Year house built - Built 1940 to 1949 (%)
Year house built - Built 1939 or earlier (%)
Median number of rooms in houses and condos
Median number of rooms in apartments
Median number of bedrooms in owner occupied houses
Mean number of bedrooms in owner occupied houses
Median number of bedrooms in renter occupied houses
Mean number of bedrooms in renter occupied houses
Median number of vehichles in owner occupied houses
Mean number of vehichles in owner occupied houses
Median number of vehichles in renter occupied houses
Mean number of vehichles in renter occupied houses
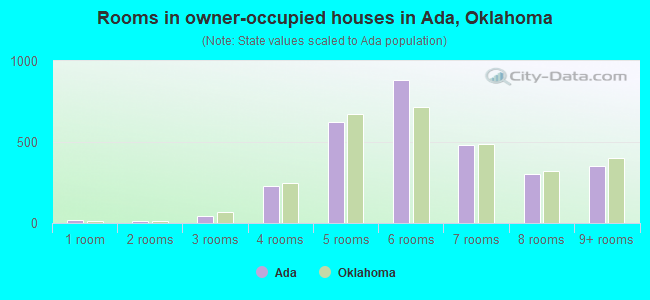
Rooms in owner-occupied houses - 1 room (%)
Rooms in owner-occupied houses - 2 rooms (%)
Rooms in owner-occupied houses - 3 rooms (%)
Rooms in owner-occupied houses - 4 rooms (%)
Rooms in owner-occupied houses - 5 rooms (%)
Rooms in owner-occupied houses - 6 rooms (%)
Rooms in owner-occupied houses - 7 rooms (%)
Rooms in owner-occupied houses - 8 rooms (%)
Rooms in owner-occupied houses - 9+ rooms (%)
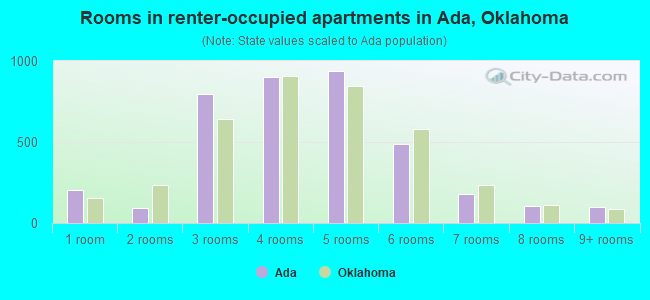
Rooms in renter-occupied houses - 1 room (%)
Rooms in renter-occupied houses - 2 rooms (%)
Rooms in renter-occupied houses - 3 rooms (%)
Rooms in renter-occupied houses - 4 rooms (%)
Rooms in renter-occupied houses - 5 rooms (%)
Rooms in renter-occupied houses - 6 rooms (%)
Rooms in renter-occupied houses - 7 rooms (%)
Rooms in renter-occupied houses - 8 rooms (%)
Rooms in renter-occupied houses - 9+ rooms (%)
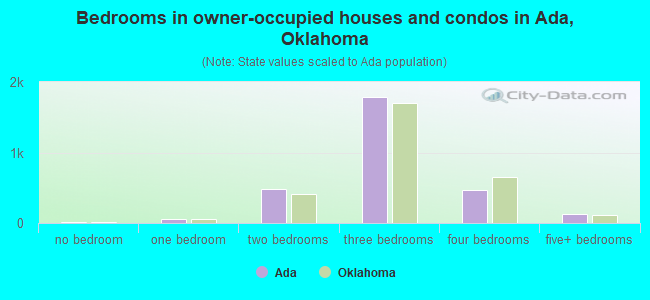
Bedrooms in owner-occupied houses - no bedrooms (%)
Bedrooms in owner-occupied houses - 1 bedroom (%)
Bedrooms in owner-occupied houses - 2 bedrooms (%)
Bedrooms in owner-occupied houses - 3 bedrooms (%)
Bedrooms in owner-occupied houses - 4 bedrooms (%)
Bedrooms in owner-occupied houses - 5+ bedrooms (%)
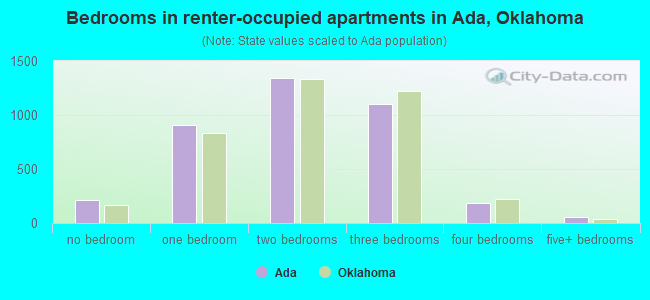
Bedrooms in renter-occupied houses - no bedrooms (%)
Bedrooms in renter-occupied houses - 1 bedroom (%)
Bedrooms in renter-occupied houses - 2 bedrooms (%)
Bedrooms in renter-occupied houses - 3 bedrooms (%)
Bedrooms in renter-occupied houses - 4 bedrooms (%)
Bedrooms in renter-occupied houses - 5+ bedrooms (%)
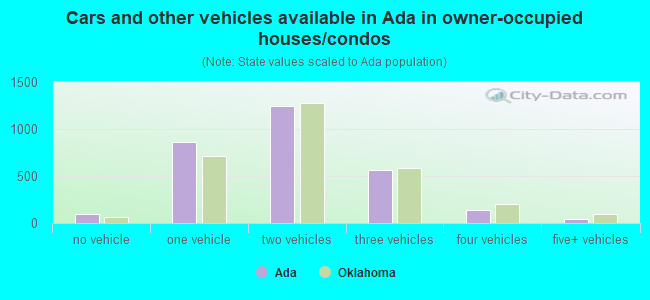
Vehicles available in owner-occupied houses - no vehicle available (%)
Vehicles available in owner-occupied houses - 1 vehicle available(%)
Vehicles available in owner-occupied houses - 2 Vehicles available (%)
Vehicles available in owner-occupied houses - 3 Vehicles available (%)
Vehicles available in owner-occupied houses - 4 Vehicles available (%)
Vehicles available in owner-occupied houses - 5+ Vehicles available (%)
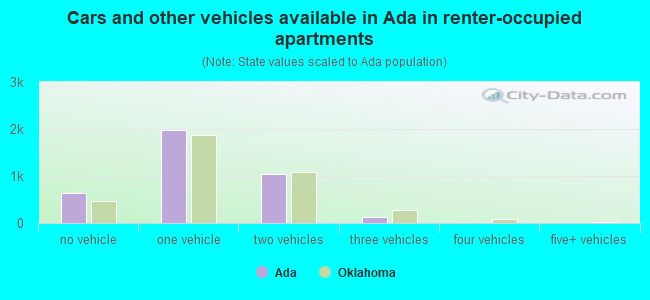
Vehicles available in renter-occupied houses - no vehicle available (%)
Vehicles available in renter-occupied houses - 1 vehicle available (%)
Vehicles available in renter-occupied houses - 2 Vehicles available (%)
Vehicles available in renter-occupied houses - 3 Vehicles available (%)
Vehicles available in renter-occupied houses - 4 Vehicles available (%)
Vehicles available in renter-occupied houses - 5+ Vehicles available (%)
Housing units in structures - 1, detached (%)
Housing units in structures - 1, attached (%)
Housing units in structures - 2 (%)
Housing units in structures - 3 or 4 (%)
Housing units in structures - 5 to 9 (%)
Housing units in structures - 10 to 19 (%)
Housing units in structures - 20 to 49 (%)
Housing units in structures - 50 or more (%)
Housing units in structures - Mobile home (%)
Housing units in structures - Boat, RV, van, etc. (%)
Housing units in structures - Owners - 1, detached (%)
Housing units in structures - Owners - 1, attached (%)
Housing units in structures - Owners - 2 (%)
Housing units in structures - Owners - 3 or 4 (%)
Housing units in structures - Owners - 5 to 9 (%)
Housing units in structures - Owners - 10 to 19 (%)
Housing units in structures - Owners - 20 to 49 (%)
Housing units in structures - Owners - 50 or more (%)
Housing units in structures - Owners - Mobile home (%)
Housing units in structures - Owners - Boat, RV, van, etc. (%)
Housing units in structures - Renters - 1, detached (%)
Housing units in structures - Renters - 1, attached (%)
Housing units in structures - Renters - 2 (%)
Housing units in structures - Renters - 3 or 4 (%)
Housing units in structures - Renters - 5 to 9 (%)
Housing units in structures - Renters - 10 to 19 (%)
Housing units in structures - Renters - 20 to 49 (%)
Housing units in structures - Renters - 50 or more (%)
Housing units in structures - Renters - Mobile home (%)
Housing units in structures - Renters - Boat, RV, van, etc. (%)
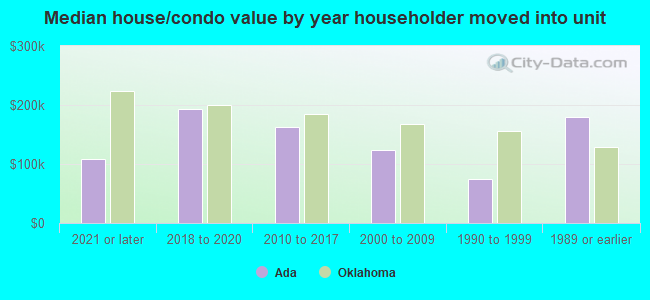
House/condo owner moved in on average (years ago)
Renter moved in on average (years ago)
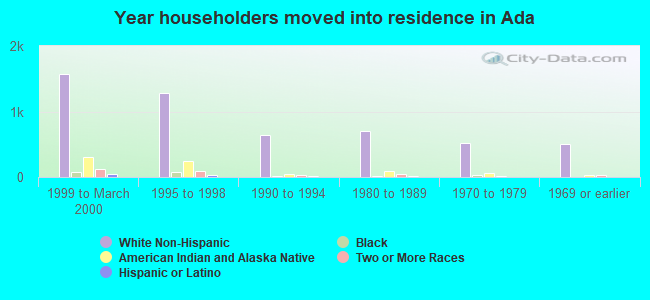
Year householder moved into unit - Moved in 1999 to March 2000 (%)
Year householder moved into unit - Moved in 1999 to March 2000 (%) - White
Year householder moved into unit - Moved in 1999 to March 2000 (%) - Black or African American
Year householder moved into unit - Moved in 1999 to March 2000 (%) - Asian
Year householder moved into unit - Moved in 1999 to March 2000 (%) - Hispanic or Latino
Year householder moved into unit - Moved in 1999 to March 2000 (%) - American Indian and Alaska Native
Year householder moved into unit - Moved in 1999 to March 2000 (%) - Multirace
Year householder moved into unit - Moved in 1999 to March 2000 (%) - Other Race
Year householder moved into unit - Moved in 1995 to 1998 (%)
Year householder moved into unit - Moved in 1995 to 1998 (%) - White
Year householder moved into unit - Moved in 1995 to 1998 (%) - Black or African American
Year householder moved into unit - Moved in 1995 to 1998 (%) - Asian
Year householder moved into unit - Moved in 1995 to 1998 (%) - Hispanic or Latino
Year householder moved into unit - Moved in 1995 to 1998 (%) - American Indian and Alaska Native
Year householder moved into unit - Moved in 1995 to 1998 (%) - Multirace
Year householder moved into unit - Moved in 1995 to 1998 (%) - Other Race
Year householder moved into unit - Moved in 1990 to 1994 (%)
Year householder moved into unit - Moved in 1990 to 1994 (%) - White
Year householder moved into unit - Moved in 1990 to 1994 (%) - Black or African American
Year householder moved into unit - Moved in 1990 to 1994 (%) - Asian
Year householder moved into unit - Moved in 1990 to 1994 (%) - Hispanic or Latino
Year householder moved into unit - Moved in 1990 to 1994 (%) - American Indian and Alaska Native
Year householder moved into unit - Moved in 1990 to 1994 (%) - Multirace
Year householder moved into unit - Moved in 1990 to 1994 (%) - Other Race
Year householder moved into unit - Moved in 1980 to 1989 (%)
Year householder moved into unit - Moved in 1980 to 1989 (%) - White
Year householder moved into unit - Moved in 1980 to 1989 (%) - Black or African American
Year householder moved into unit - Moved in 1980 to 1989 (%) - Asian
Year householder moved into unit - Moved in 1980 to 1989 (%) - Hispanic or Latino
Year householder moved into unit - Moved in 1980 to 1989 (%) - American Indian and Alaska Native
Year householder moved into unit - Moved in 1980 to 1989 (%) - Multirace
Year householder moved into unit - Moved in 1980 to 1989 (%) - Other Race
Year householder moved into unit - Moved in 1970 to 1979 (%)
Year householder moved into unit - Moved in 1970 to 1979 (%) - White
Year householder moved into unit - Moved in 1970 to 1979 (%) - Black or African American
Year householder moved into unit - Moved in 1970 to 1979 (%) - Asian
Year householder moved into unit - Moved in 1970 to 1979 (%) - Hispanic or Latino
Year householder moved into unit - Moved in 1970 to 1979 (%) - American Indian and Alaska Native
Year householder moved into unit - Moved in 1970 to 1979 (%) - Multirace
Year householder moved into unit - Moved in 1970 to 1979 (%) - Other Race
Year householder moved into unit - Moved in 1969 or earlier (%)
Year householder moved into unit - Moved in 1969 or earlier (%) - White
Year householder moved into unit - Moved in 1969 or earlier (%) - Black or African American
Year householder moved into unit - Moved in 1969 or earlier (%) - Asian
Year householder moved into unit - Moved in 1969 or earlier (%) - Hispanic or Latino
Year householder moved into unit - Moved in 1969 or earlier (%) - American Indian and Alaska Native
Year householder moved into unit - Moved in 1969 or earlier (%) - Multirace
Year householder moved into unit - Moved in 1969 or earlier (%) - Other Race
Housing units lacking complete plumbing facilities (%)
Housing units lacking complete kitchen facilities (%)
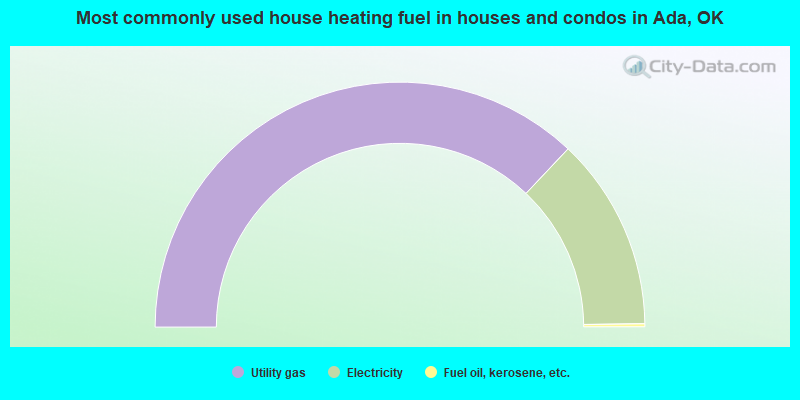
House heating fuel used in houses and condos - Utility gas (%)
House heating fuel used in houses and condos - Bottled, tank, or LP gas (%)
House heating fuel used in houses and condos - Electricity (%)
House heating fuel used in houses and condos - Fuel oil, kerosene, etc. (%)
House heating fuel used in houses and condos - Coal or coke (%)
House heating fuel used in houses and condos - Wood (%)
House heating fuel used in houses and condos - Solar energy (%)
House heating fuel used in houses and condos - Other fuel (%)
House heating fuel used in houses and condos - No fuel used (%)
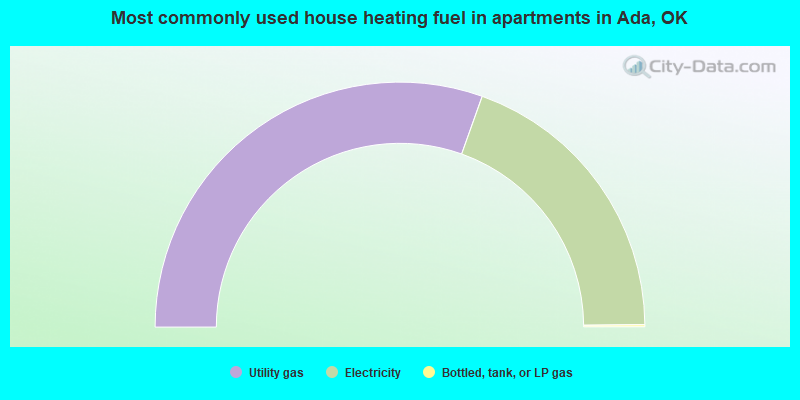
House heating fuel used in apartments - Utility gas (%)
House heating fuel used in apartments - Bottled, tank, or LP gas (%)
House heating fuel used in apartments - Electricity (%)
House heating fuel used in apartments - Fuel oil, kerosene, etc. (%)
House heating fuel used in apartments - Coal or coke (%)
House heating fuel used in apartments - Wood (%)
House heating fuel used in apartments - Solar energy (%)
House heating fuel used in apartments - Other fuel (%)
House heating fuel used in apartments - No fuel used (%)
Latest news about housing in Ada, OK collected exclusively by city-data.com from local newspapers, TV, and radio stations
Median year house/condo built: 1970Median year apartment built: 1970Household type by relationship:
Households: 16,742
Male householders: 3,212 (1,005 living alone ), Female householders: 3,398 (1,482 living alone )2,150 spouses (2,097 opposite-sex spouses ), 612 unmarried partners , (577 opposite-sex unmarried partners ), 4,704 children (4,161 natural , 114 adopted , 429 stepchildren ), 464 grandchildren , 196 brothers or sisters , 174 parents , 19 foster children , 233 other relatives , 377 non-relatives In group quarters: 1,197
Size of family households: 1,659 2-persons , 828 3-persons , 720 4-persons , 371 5-persons , 111 6-persons , 53 7-or-more-persons .
Size of nonfamily households: 2,515 1-person , 441 2-persons , 15 3-persons , 32 4-persons .
1,936 married couples with children. single-parent households (655 men , 1,025 women ).
94.5% of residents of Ada speak English at home. of residents speak Spanish at home (77% speak English very well , 17% speak English well , 4% speak English not well , 2% don't speak English at all ).of residents speak other Indo-European language at home (94% speak English very well , 6% speak English well ).of residents speak Asian or Pacific Island language at home (69% speak English very well , 12% speak English well , 18% speak English not well ).of residents speak other language at home (82% speak English very well , 1% speak English well , 17% speak English not well ).
Foreign born population: 416 (2.5%)of them are naturalized citizens )
Median number of rooms in houses and condos:
Median number of rooms in apartments
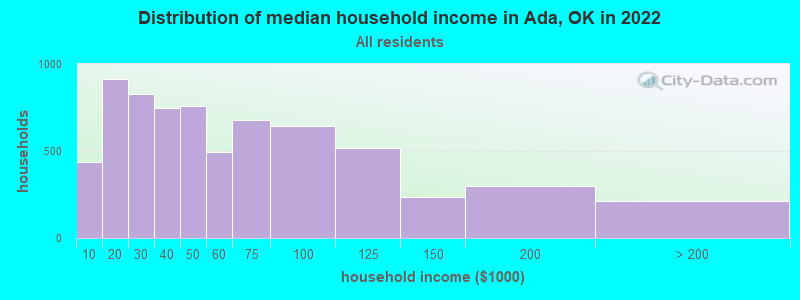
Ada, OK household income distribution 437 Less than $10,000911 $10,000 to $19,999825 $20,000 to $29,999747 $30,000 to $39,999760 $40,000 to $49,999496 $50,000 to $59,999676 $60,000 to $74,999645 $75,000 to $99,999516 $100,000 to $124,999233 $125,000 to $149,999296 $150,000 to $199,999215 $200,000 or more
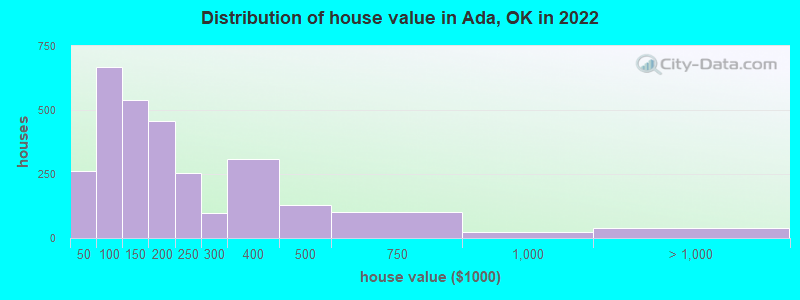
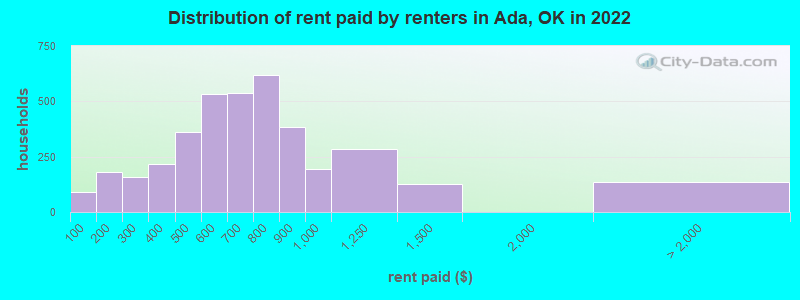
Home value of owner - occupied houses in 2022 in Ada, OK 12 Less than $10,0002 $10,000 to $14,9995 $20,000 to $24,99927 $25,000 to $29,999118 $30,000 to $34,99923 $35,000 to $39,99972 $40,000 to $49,99999 $50,000 to $59,999173 $60,000 to $69,99991 $70,000 to $79,999113 $80,000 to $89,999120 $90,000 to $99,999367 $100,000 to $124,999171 $125,000 to $149,999222 $150,000 to $174,999234 $175,000 to $199,999251 $200,000 to $249,99998 $250,000 to $299,999307 $300,000 to $399,999130 $400,000 to $499,999101 $500,000 to $749,99921 $750,000 to $999,99927 $1,000,000 to $1,499,99912 $2,000,000 or moreRent paid by renters in 2022 in Ada, OK 89 Less than $100120 $100 to $14959 $150 to $19945 $200 to $249113 $250 to $299145 $300 to $34969 $350 to $39984 $400 to $449276 $450 to $499300 $500 to $549233 $550 to $599277 $600 to $649259 $650 to $699347 $700 to $749272 $750 to $799385 $800 to $899195 $900 to $999285 $1,000 to $1,249125 $1,250 to $1,4995 $2,500 to $2,999131 No cash rent
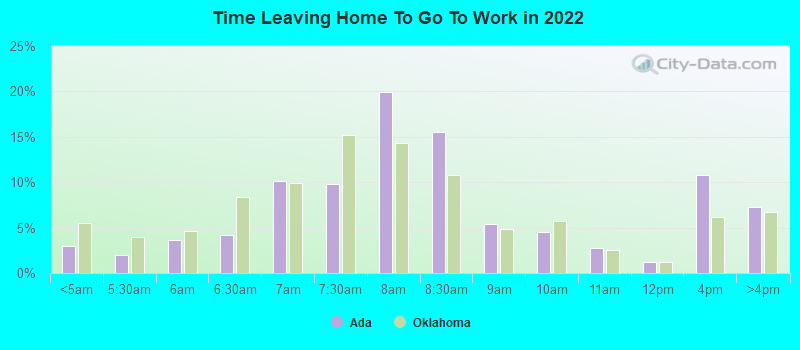
Percentage of workers working in this county: 91.4%Number of people working at home: 350 (4.7% of all workers )
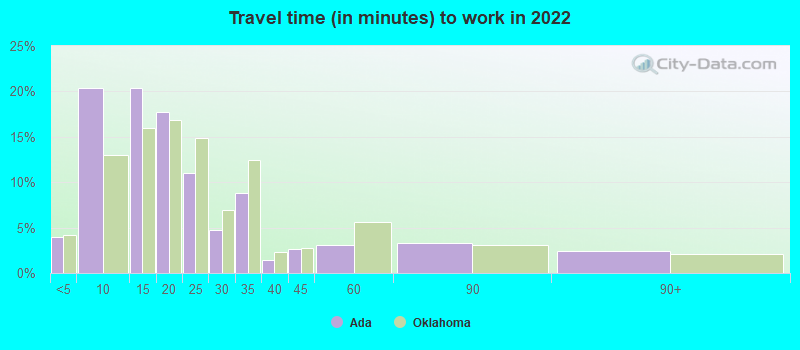
Travel time to work (commute)
Less than 5 minutes: 4155 to 9 minutes: 2,39710 to 14 minutes: 1,80215 to 19 minutes: 1,01420 to 24 minutes: 36425 to 29 minutes: 15730 to 34 minutes: 22335 to 39 minutes: 6140 to 44 minutes: 4645 to 59 minutes: 21660 to 89 minutes: 16990 or more minutes: 98
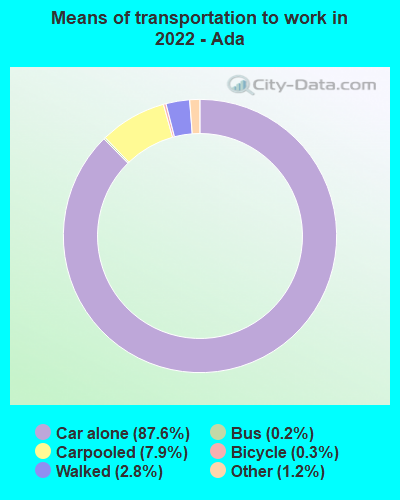
Means of transportation to work:
Drove a car alone: 11,234 (83.8%)Carpooled: 1,031 (7.7%)Bus : 25 (0.2%)Taxi: 143 (1.1%)Bicycle: 34 (0.3%)Walked: 367 (2.7%)Worked at home: 350 (2.6%)
Unemployment by race in 2022
Unemployment rate for White non-Hispanic residents 4.7% Males3.2% FemalesUnemployment rate for Black residents 4.4% FemalesUnemployment rate for American Indian and Alaska Native residents 5.3% Males4.2% FemalesUnemployment rate for two or more race residents 0.6% Males7.7% FemalesUnemployment rate for Hispanic or Latino residents 9.0% Females
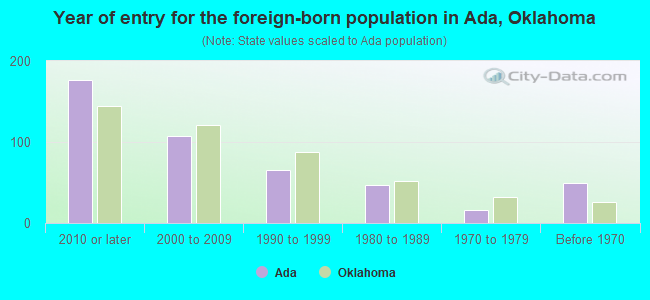
Year of entry for the foreign-born population in Ada, Oklahoma
177 2010 or later 108 2000 to 2009 65 1990 to 1999 47 1980 to 1989 16 1970 to 1979 50 Before 1970
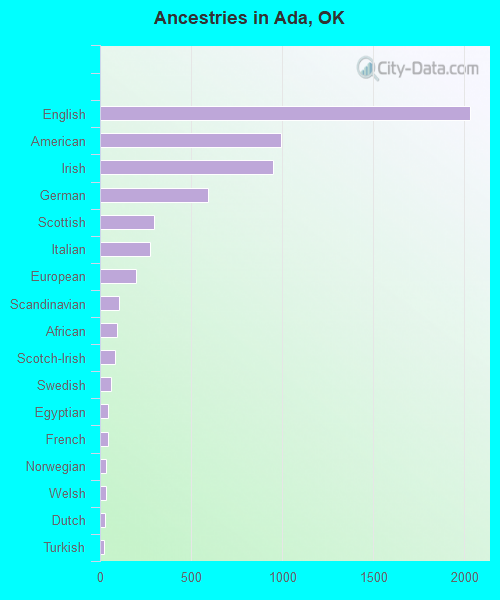
First ancestries reported:
English: 2,034 (19.0%)
American: 993 (9.3%)
Irish: 952 (8.9%)
German: 592 (5.5%)
Scottish: 298 (2.8%)
Italian: 273 (2.5%)
European: 195 (1.8%)
Scandinavian: 102 (1.0%)
African: 92 (0.9%)
Scotch-Irish: 81 (0.8%)
Swedish: 63 (0.6%)
Egyptian: 45 (0.4%)
French: 42 (0.4%)
Norwegian: 32 (0.3%)
Welsh: 32 (0.3%)
Dutch: 27 (0.3%)
Turkish: 20 (0.2%)
Danish: 18 (0.2%)
Portuguese: 16 (0.1%)
Czechoslovakian: 12 (0.1%)
Polish: 11 (0.1%)
Slavic: 10 (0.09%)
Australian: 8 (0.07%)
Hungarian: 5 (0.05%)
British West Indian: 5 (0.05%)
Austrian: 3 (0.03%)
Kenyan: 3 (0.03%)
Eastern European: 2 (0.02%) Most common places of birth for foreign-born residents (%): Philippines Ada:
19.2% (80)Oklahoma:
2.3% (5,671)
China, excluding Hong Kong and Taiwan Ada:
13.7% (57)Oklahoma:
3.2% (7,698)
Mexico Ada:
10.1% (42)Oklahoma:
42.4% (103,425)
Sudan Ada:
9.6% (40)Oklahoma:
0.2% (389)
India Ada:
7.0% (29)Oklahoma:
4.1% (10,034)
Vietnam Ada:
7.0% (29)Oklahoma:
5.6% (13,699)
Germany Ada:
4.1% (17)Oklahoma:
2.3% (5,498)
Turkey Ada:
4.1% (17)Oklahoma:
0.2% (473)
Egypt Ada:
3.4% (14)Oklahoma:
0.2% (380)
Ecuador Ada:
3.4% (14)Oklahoma:
0.2% (586)
United Kingdom, excluding England and Scotland Ada:
3.1% (13)Oklahoma:
0.5% (1,194)
Poland Ada:
3.1% (13)Oklahoma:
0.3% (633)
Australia Ada:
3.1% (13)Oklahoma:
0.2% (569)
Kenya Ada:
2.6% (11)Oklahoma:
0.5% (1,331)
St. Lucia Ada:
2.4% (10)Oklahoma:
0.0% (36)
Norway Ada:
1.9% (8)Oklahoma:
0.0% (87)
Canada Ada:
1.7% (7)Oklahoma:
2.0% (4,771)
Place of birth for U.S.-born residents:
This state: 11,215Other state: 4,988Northeast: 238Midwest: 996South: 2,405West: 1,350 82.2% of Ada residents lived in the same house 1 years ago.
Out of people who lived in different houses, 34.8% lived in this county.
Out of people who lived in different counties, 60.7% lived in Oklahoma.
Ada:
82.2%State average:
85.5%
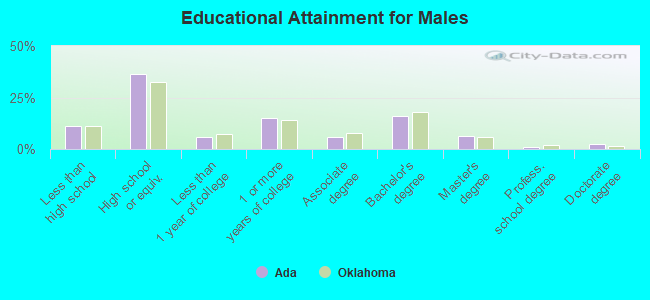
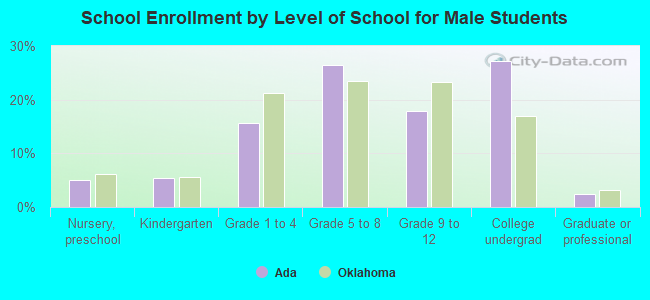
Education attainment for males 25 years and older:
No schooling: 23Nursery to 4th grade: 85th and 6th grade: 07th and 8th grade: 629th grade: 6810th grade: 8711th grade: 17612th grade, no diploma: 103High school graduate (or equivalency): 1,686Less than 1 year of college: 270Some college more than 1 year, no degree: 706Associate degree: 272Bachelor's degree: 736Master's degree: 296Professional school degree: 43Doctorate degree: 116
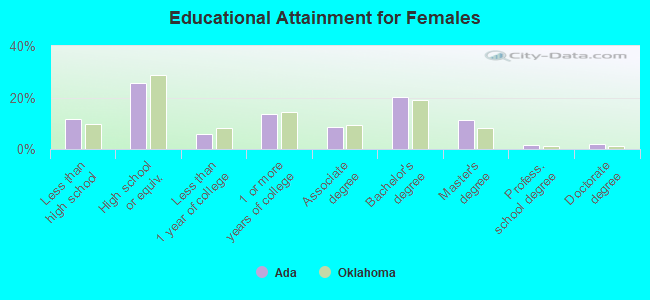
Education attainment for females 25 years and older:
No schooling: 80Nursery to 4th grade: 95th and 6th grade: 137th and 8th grade: 889th grade: 11010th grade: 18711th grade: 10912th grade, no diploma: 41High school graduate (or equivalency): 1,418Less than 1 year of college: 318Some college more than 1 year, no degree: 762Associate degree: 483Bachelor's degree: 1,130Master's degree: 616Professional school degree: 87Doctorate degree: 109
Housing units in structures:
One, detached: 5,682One, attached: 62Two: 5803 or 4: 5245 to 9: 47510 to 19: 17120 to 49: 25850 or more: 156Mobile homes: 140Median worth of mobile homes: $70,520
Housing units lacking complete plumbing facilities in 2022: 4.8%Housing units lacking complete kitchen facilities in 2022: 7.7%House/condo owner moved in on average 12 years ago
Renter moved in on average 1 years ago
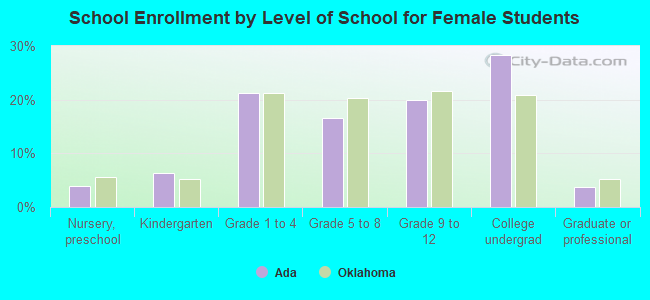
Private vs. public school enrollment:
Students in private schools in grades 1 to 8 (elementary and middle school): 158 Students in private schools in grades 9 to 12 (high school): 79 Students in private undergraduate colleges: 335