Allen Park, MI (Michigan) Houses and Residents
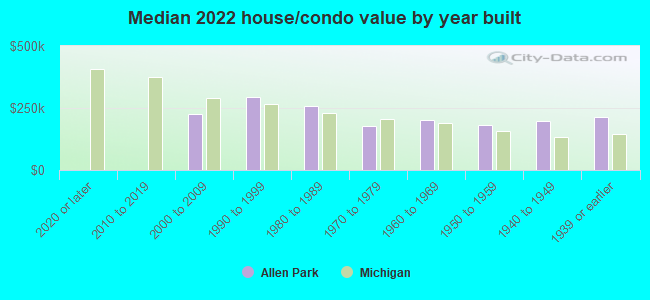
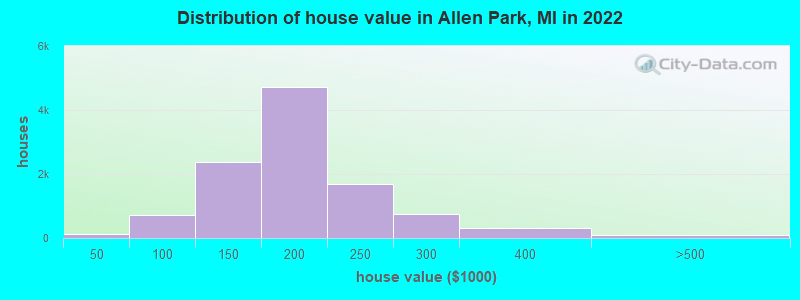
Estimated median house or condo value in 2022: $181,158 (it was $118,900 in 2000 )
Allen Park:
$181,158Michigan:
$224,400
Lower value quartile - upper value quartile: $160,018 - $218,641Total population: 27,566 (All urban)
Houses: 12,415 (11,836 occupied: 10,262 owner occupied, 1,641 renter occupied )
% of renters here:
14%State:
27%
Housing density: 1,771 houses/condos per square mile
Median price asked for vacant for-sale houses and condos in 2022: $116,760.
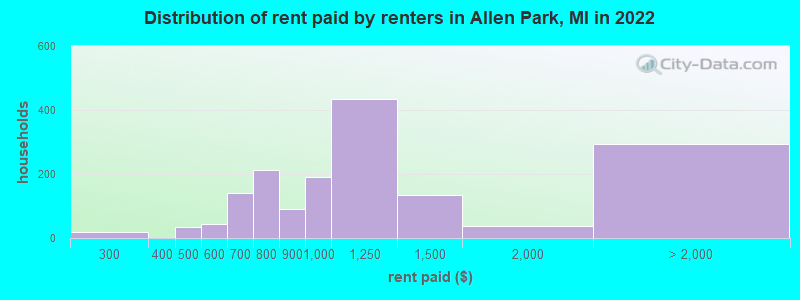
Median contract rent in 2022: $961 (lower quartile is $764, upper quartile is $1,232)
Median rent asked for vacant for-rent units in 2022: $2,990
Median gross rent in Allen Park, MI in 2022: $1,160
Housing units in Allen Park with a mortgage: 6,222 (519 second mortgage, 7 home equity loan, 442 both second mortgage and home equity loan )Houses without a mortgage: 230
Median household income for houses/condos with a mortgage: $87,647
Median household income for apartments without a mortgage: $61,550
Median monthly housing costs: $1,053
Data:
Median house or condo value ($)
Median house or condo value ($ change since 2000)
Median house or condo value ($) - White
Median house or condo value ($) - Black or African American
Median house or condo value ($) - Asian
Median house or condo value ($) - Hispanic or Latino
Median house or condo value ($) - American Indian and Alaska Native
Median house or condo value ($) - Multirace
Median house or condo value ($) - Other Race
Median price asked for mobile homes ($)
Household density (households per square mile)
Mean house or condo value by units in structure - 1, detached ($)
Mean house or condo value by units in structure - 1, attached ($)
Mean house or condo value by units in structure - 2 ($)
Mean house or condo value by units in structure by units in structure - 3 or 4 ($)
Mean house or condo value by units in structure - 5 or more ($)
Mean house or condo value by units in structure - Boat, RV, van, etc. ($)
Mean house or condo value by units in structure - Mobile home ($)
Median contract rent ($)
Median contract rent - Lower quartile ($)
Median contract rent - Upper quartile ($)
Median gross rent ($)
Urban houses (%)
Rural houses (%)
Houses occupied (%)
Houses occupied (% change since 2000)
Houses owner occupied (%)
Houses owner occupied (% change since 2000)
Houses renter occupied (%)
Houses renter occupied (% change since 2000)
Vacant housing units - For rent (%)
Vacant housing units - For rent (% change since 2000)
Vacant housing units - For sale only (%)
Vacant housing units - For sale only (% change since 2000)
Vacant housing units - Rented or sold, not occupied (%)
Vacant housing units - Rented or sold, not occupied (% change since 2000)
Vacant housing units - For seasonal, recreational, or occasional use (%)
Vacant housing units - For seasonal, recreational, or occasional use (% change since 2000)
Vacant housing units - For migrant workers (%)
Vacant housing units - For migrant workers (% change since 2000)
Vacant housing units - Other vacant (%)
Vacant housing units - Other vacant (% change since 2000)
Median monthly housing costs ($)
Median household income for houses/condos with a mortgage ($)
Median household income for houses/condos without a mortgage ($)
Median household income ($)
Median household income ($) - White
Median household income ($) - Black or African American
Median household income ($) - Asian
Median household income ($) - Hispanic or Latino
Median household income ($) - American Indian and Alaska Native
Median household income ($) - Multirace
Median household income ($) - Other Race
Mortgage status - with mortgage (%)
Mortgage status - with second mortgage (%)
Mortgage status - with home equity loan (%)
Mortgage status - with both second mortgage and home equity loan (%)
Mortgage status - without a mortgage (%)
Median year house/condo built
Median year apartment built
Household type by relationship - Male householder living alone (%)
Household type by relationship - Male householder not living alone (%)
Household type by relationship - Female householder living alone (%)
Household type by relationship - Female householder not living alone (%)
Household type by relationship - Opposite-Sex spouse (%)
Household type by relationship - Same-Sex spouse (%)
Household type by relationship - Opposite-Sex unmarried partner (%)
Household type by relationship - Same-Sex unmarried partner (%)
Household type by relationship - In group quarters (%)
Size of family households - 2-person household (%)
Size of family households - 3-person household (%)
Size of family households - 4-person household (%)
Size of family households - 5-person household (%)
Size of family households - 6-person household (%)
Size of family households - 7-or-more-person household (%)
Size of nonfamily households - 1-person household (%)
Size of nonfamily households - 2-person household (%)
Size of nonfamily households - 3-person household (%)
Size of nonfamily households - 4-person household (%)
Size of nonfamily households - 5-person household (%)
Size of nonfamily households - 6-person household (%)
Size of nonfamily households - 7-or-moreperson household (%)
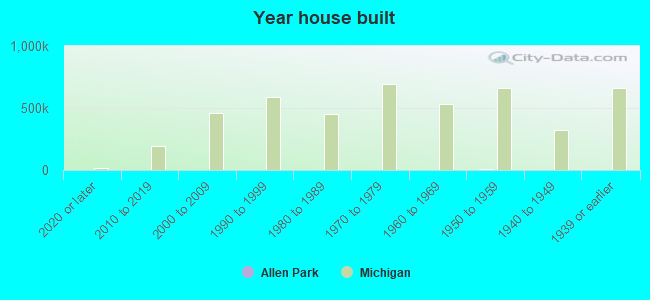
Year house built - Built 2010 or later (%)
Year house built - Built 2000 to 2009 (%)
Year house built - Built 1990 to 1999 (%)
Year house built - Built 1980 to 1989 (%)
Year house built - Built 1970 to 1979 (%)
Year house built - Built 1960 to 1969 (%)
Year house built - Built 1950 to 1959 (%)
Year house built - Built 1940 to 1949 (%)
Year house built - Built 1939 or earlier (%)
Median number of rooms in houses and condos
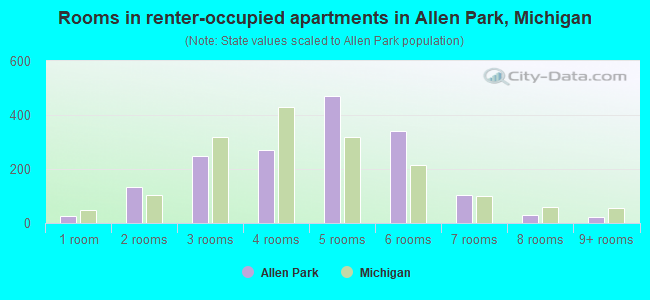
Median number of rooms in apartments
Median number of bedrooms in owner occupied houses
Mean number of bedrooms in owner occupied houses
Median number of bedrooms in renter occupied houses
Mean number of bedrooms in renter occupied houses
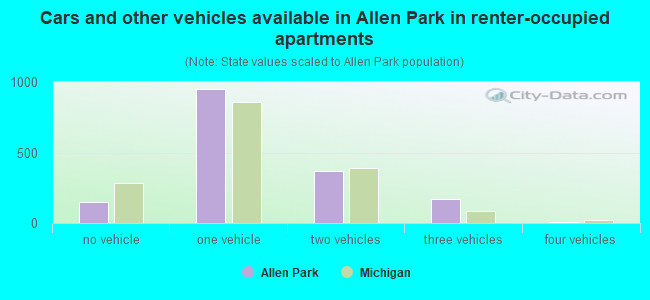
Median number of vehichles in owner occupied houses
Mean number of vehichles in owner occupied houses
Median number of vehichles in renter occupied houses
Mean number of vehichles in renter occupied houses
Rooms in owner-occupied houses - 1 room (%)
Rooms in owner-occupied houses - 2 rooms (%)
Rooms in owner-occupied houses - 3 rooms (%)
Rooms in owner-occupied houses - 4 rooms (%)
Rooms in owner-occupied houses - 5 rooms (%)
Rooms in owner-occupied houses - 6 rooms (%)
Rooms in owner-occupied houses - 7 rooms (%)
Rooms in owner-occupied houses - 8 rooms (%)
Rooms in owner-occupied houses - 9+ rooms (%)
Rooms in renter-occupied houses - 1 room (%)
Rooms in renter-occupied houses - 2 rooms (%)
Rooms in renter-occupied houses - 3 rooms (%)
Rooms in renter-occupied houses - 4 rooms (%)
Rooms in renter-occupied houses - 5 rooms (%)
Rooms in renter-occupied houses - 6 rooms (%)
Rooms in renter-occupied houses - 7 rooms (%)
Rooms in renter-occupied houses - 8 rooms (%)
Rooms in renter-occupied houses - 9+ rooms (%)
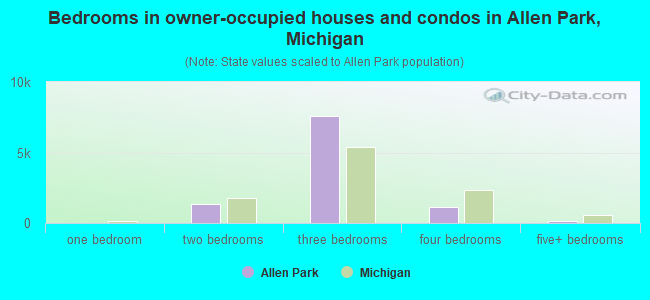
Bedrooms in owner-occupied houses - no bedrooms (%)
Bedrooms in owner-occupied houses - 1 bedroom (%)
Bedrooms in owner-occupied houses - 2 bedrooms (%)
Bedrooms in owner-occupied houses - 3 bedrooms (%)
Bedrooms in owner-occupied houses - 4 bedrooms (%)
Bedrooms in owner-occupied houses - 5+ bedrooms (%)
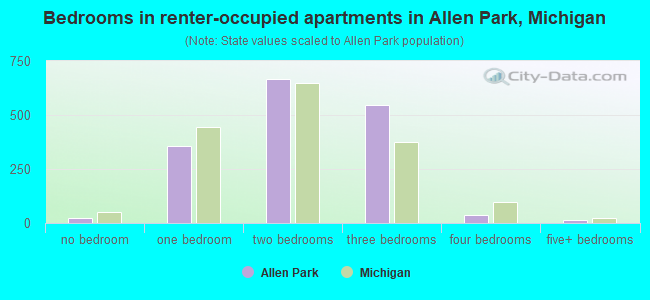
Bedrooms in renter-occupied houses - no bedrooms (%)
Bedrooms in renter-occupied houses - 1 bedroom (%)
Bedrooms in renter-occupied houses - 2 bedrooms (%)
Bedrooms in renter-occupied houses - 3 bedrooms (%)
Bedrooms in renter-occupied houses - 4 bedrooms (%)
Bedrooms in renter-occupied houses - 5+ bedrooms (%)
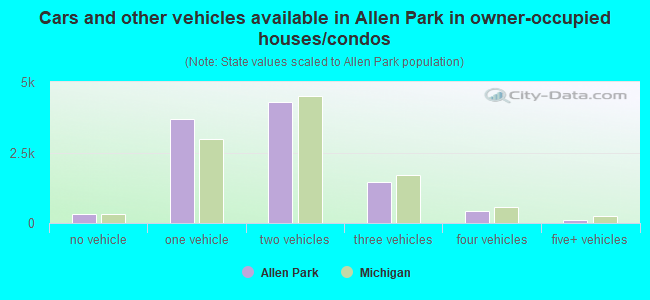
Vehicles available in owner-occupied houses - no vehicle available (%)
Vehicles available in owner-occupied houses - 1 vehicle available(%)
Vehicles available in owner-occupied houses - 2 Vehicles available (%)
Vehicles available in owner-occupied houses - 3 Vehicles available (%)
Vehicles available in owner-occupied houses - 4 Vehicles available (%)
Vehicles available in owner-occupied houses - 5+ Vehicles available (%)
Vehicles available in renter-occupied houses - no vehicle available (%)
Vehicles available in renter-occupied houses - 1 vehicle available (%)
Vehicles available in renter-occupied houses - 2 Vehicles available (%)
Vehicles available in renter-occupied houses - 3 Vehicles available (%)
Vehicles available in renter-occupied houses - 4 Vehicles available (%)
Vehicles available in renter-occupied houses - 5+ Vehicles available (%)
Housing units in structures - 1, detached (%)
Housing units in structures - 1, attached (%)
Housing units in structures - 2 (%)
Housing units in structures - 3 or 4 (%)
Housing units in structures - 5 to 9 (%)
Housing units in structures - 10 to 19 (%)
Housing units in structures - 20 to 49 (%)
Housing units in structures - 50 or more (%)
Housing units in structures - Mobile home (%)
Housing units in structures - Boat, RV, van, etc. (%)
Housing units in structures - Owners - 1, detached (%)
Housing units in structures - Owners - 1, attached (%)
Housing units in structures - Owners - 2 (%)
Housing units in structures - Owners - 3 or 4 (%)
Housing units in structures - Owners - 5 to 9 (%)
Housing units in structures - Owners - 10 to 19 (%)
Housing units in structures - Owners - 20 to 49 (%)
Housing units in structures - Owners - 50 or more (%)
Housing units in structures - Owners - Mobile home (%)
Housing units in structures - Owners - Boat, RV, van, etc. (%)
Housing units in structures - Renters - 1, detached (%)
Housing units in structures - Renters - 1, attached (%)
Housing units in structures - Renters - 2 (%)
Housing units in structures - Renters - 3 or 4 (%)
Housing units in structures - Renters - 5 to 9 (%)
Housing units in structures - Renters - 10 to 19 (%)
Housing units in structures - Renters - 20 to 49 (%)
Housing units in structures - Renters - 50 or more (%)
Housing units in structures - Renters - Mobile home (%)
Housing units in structures - Renters - Boat, RV, van, etc. (%)
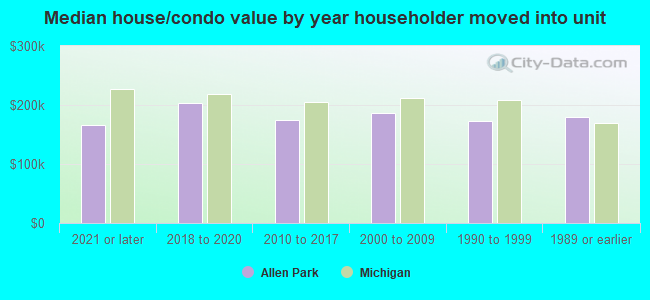
House/condo owner moved in on average (years ago)
Renter moved in on average (years ago)
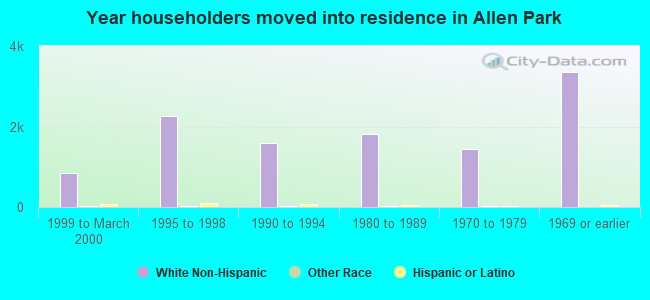
Year householder moved into unit - Moved in 1999 to March 2000 (%)
Year householder moved into unit - Moved in 1999 to March 2000 (%) - White
Year householder moved into unit - Moved in 1999 to March 2000 (%) - Black or African American
Year householder moved into unit - Moved in 1999 to March 2000 (%) - Asian
Year householder moved into unit - Moved in 1999 to March 2000 (%) - Hispanic or Latino
Year householder moved into unit - Moved in 1999 to March 2000 (%) - American Indian and Alaska Native
Year householder moved into unit - Moved in 1999 to March 2000 (%) - Multirace
Year householder moved into unit - Moved in 1999 to March 2000 (%) - Other Race
Year householder moved into unit - Moved in 1995 to 1998 (%)
Year householder moved into unit - Moved in 1995 to 1998 (%) - White
Year householder moved into unit - Moved in 1995 to 1998 (%) - Black or African American
Year householder moved into unit - Moved in 1995 to 1998 (%) - Asian
Year householder moved into unit - Moved in 1995 to 1998 (%) - Hispanic or Latino
Year householder moved into unit - Moved in 1995 to 1998 (%) - American Indian and Alaska Native
Year householder moved into unit - Moved in 1995 to 1998 (%) - Multirace
Year householder moved into unit - Moved in 1995 to 1998 (%) - Other Race
Year householder moved into unit - Moved in 1990 to 1994 (%)
Year householder moved into unit - Moved in 1990 to 1994 (%) - White
Year householder moved into unit - Moved in 1990 to 1994 (%) - Black or African American
Year householder moved into unit - Moved in 1990 to 1994 (%) - Asian
Year householder moved into unit - Moved in 1990 to 1994 (%) - Hispanic or Latino
Year householder moved into unit - Moved in 1990 to 1994 (%) - American Indian and Alaska Native
Year householder moved into unit - Moved in 1990 to 1994 (%) - Multirace
Year householder moved into unit - Moved in 1990 to 1994 (%) - Other Race
Year householder moved into unit - Moved in 1980 to 1989 (%)
Year householder moved into unit - Moved in 1980 to 1989 (%) - White
Year householder moved into unit - Moved in 1980 to 1989 (%) - Black or African American
Year householder moved into unit - Moved in 1980 to 1989 (%) - Asian
Year householder moved into unit - Moved in 1980 to 1989 (%) - Hispanic or Latino
Year householder moved into unit - Moved in 1980 to 1989 (%) - American Indian and Alaska Native
Year householder moved into unit - Moved in 1980 to 1989 (%) - Multirace
Year householder moved into unit - Moved in 1980 to 1989 (%) - Other Race
Year householder moved into unit - Moved in 1970 to 1979 (%)
Year householder moved into unit - Moved in 1970 to 1979 (%) - White
Year householder moved into unit - Moved in 1970 to 1979 (%) - Black or African American
Year householder moved into unit - Moved in 1970 to 1979 (%) - Asian
Year householder moved into unit - Moved in 1970 to 1979 (%) - Hispanic or Latino
Year householder moved into unit - Moved in 1970 to 1979 (%) - American Indian and Alaska Native
Year householder moved into unit - Moved in 1970 to 1979 (%) - Multirace
Year householder moved into unit - Moved in 1970 to 1979 (%) - Other Race
Year householder moved into unit - Moved in 1969 or earlier (%)
Year householder moved into unit - Moved in 1969 or earlier (%) - White
Year householder moved into unit - Moved in 1969 or earlier (%) - Black or African American
Year householder moved into unit - Moved in 1969 or earlier (%) - Asian
Year householder moved into unit - Moved in 1969 or earlier (%) - Hispanic or Latino
Year householder moved into unit - Moved in 1969 or earlier (%) - American Indian and Alaska Native
Year householder moved into unit - Moved in 1969 or earlier (%) - Multirace
Year householder moved into unit - Moved in 1969 or earlier (%) - Other Race
Housing units lacking complete plumbing facilities (%)
Housing units lacking complete kitchen facilities (%)
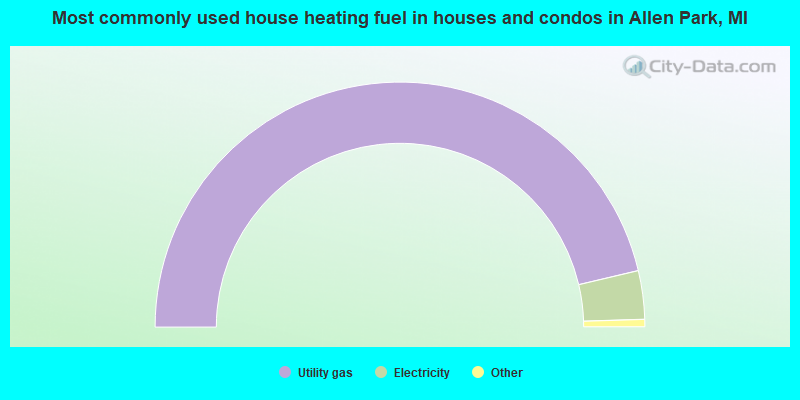
House heating fuel used in houses and condos - Utility gas (%)
House heating fuel used in houses and condos - Bottled, tank, or LP gas (%)
House heating fuel used in houses and condos - Electricity (%)
House heating fuel used in houses and condos - Fuel oil, kerosene, etc. (%)
House heating fuel used in houses and condos - Coal or coke (%)
House heating fuel used in houses and condos - Wood (%)
House heating fuel used in houses and condos - Solar energy (%)
House heating fuel used in houses and condos - Other fuel (%)
House heating fuel used in houses and condos - No fuel used (%)
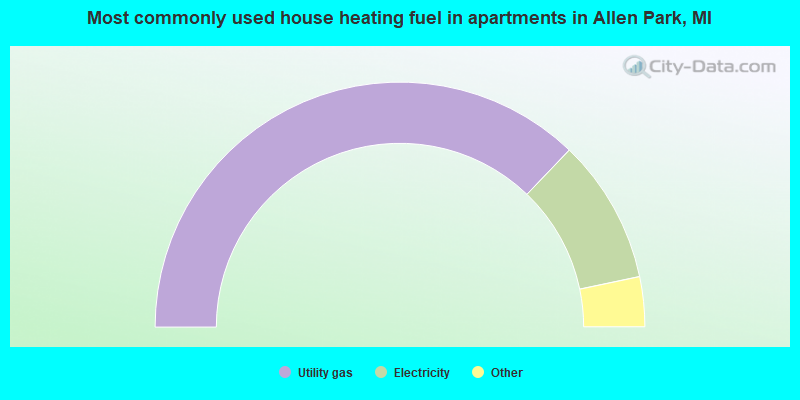
House heating fuel used in apartments - Utility gas (%)
House heating fuel used in apartments - Bottled, tank, or LP gas (%)
House heating fuel used in apartments - Electricity (%)
House heating fuel used in apartments - Fuel oil, kerosene, etc. (%)
House heating fuel used in apartments - Coal or coke (%)
House heating fuel used in apartments - Wood (%)
House heating fuel used in apartments - Solar energy (%)
House heating fuel used in apartments - Other fuel (%)
House heating fuel used in apartments - No fuel used (%)
Median year house/condo built: 1955Median year apartment built: 1958Household type by relationship:
Households: 28,002
Male householders: 5,670 (1,708 living alone ), Female householders: 6,019 (2,022 living alone )5,391 spouses (5,348 opposite-sex spouses ), 709 unmarried partners , (709 opposite-sex unmarried partners ), 8,205 children (7,701 natural , 124 adopted , 379 stepchildren ), 568 grandchildren , 180 brothers or sisters , 252 parents , 0 foster children , 358 other relatives , 499 non-relatives In group quarters: 147
Size of family households: 3,685 2-persons , 1,610 3-persons , 1,749 4-persons , 330 5-persons , 128 6-persons , 40 7-or-more-persons .
Size of nonfamily households: 3,865 1-person , 420 2-persons , 30 3-persons , 47 4-persons .
3,595 married couples with children. single-parent households (433 men , 913 women ).
89.4% of residents of Allen Park speak English at home. of residents speak Spanish at home (77% speak English very well , 14% speak English well , 9% speak English not well ).of residents speak other Indo-European language at home (79% speak English very well , 9% speak English well , 12% speak English not well ).of residents speak Asian or Pacific Island language at home (88% speak English very well , 11% speak English well , 1% speak English not well ).of residents speak other language at home (73% speak English very well , 12% speak English well , 16% speak English not well ).
Foreign born population: 1,337 (4.8%)of them are naturalized citizens )
Median number of rooms in houses and condos:
Median number of rooms in apartments
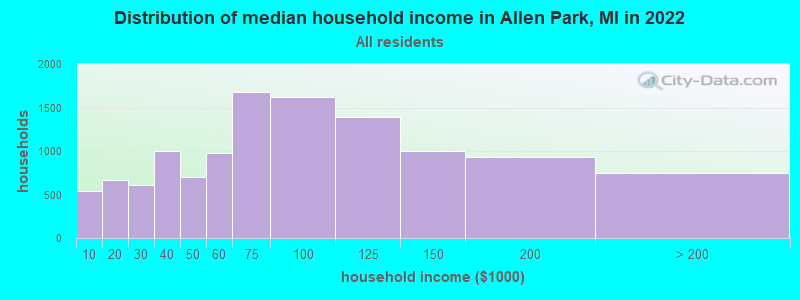
Allen Park, MI household income distribution 541 Less than $10,000667 $10,000 to $19,999611 $20,000 to $29,999995 $30,000 to $39,999702 $40,000 to $49,999979 $50,000 to $59,9991,683 $60,000 to $74,9991,615 $75,000 to $99,9991,391 $100,000 to $124,9991,005 $125,000 to $149,999930 $150,000 to $199,999749 $200,000 or more
Home value of owner - occupied houses in 2022 in Allen Park, MI 24 Less than $10,00010 $10,000 to $14,99946 $15,000 to $19,9994 $25,000 to $29,99927 $40,000 to $49,99980 $50,000 to $59,9999 $60,000 to $69,999225 $70,000 to $79,999159 $80,000 to $89,999205 $90,000 to $99,9991,028 $100,000 to $124,9991,356 $125,000 to $149,9992,945 $150,000 to $174,9991,759 $175,000 to $199,9991,689 $200,000 to $249,999759 $250,000 to $299,999328 $300,000 to $399,99937 $400,000 to $499,99914 $500,000 to $749,99911 $750,000 to $999,99933 $1,000,000 to $1,499,999Rent paid by renters in 2022 in Allen Park, MI 18 $200 to $24917 $400 to $44917 $450 to $49937 $500 to $5497 $550 to $59956 $600 to $64984 $650 to $69990 $700 to $749122 $750 to $79990 $800 to $899190 $900 to $999432 $1,000 to $1,249134 $1,250 to $1,49936 $1,500 to $1,99985 $2,000 to $2,4996 $3,500 or more200 No cash rent
Percentage of workers working in this county: 82.9%Number of people working at home: 1,498 (10.9% of all workers )
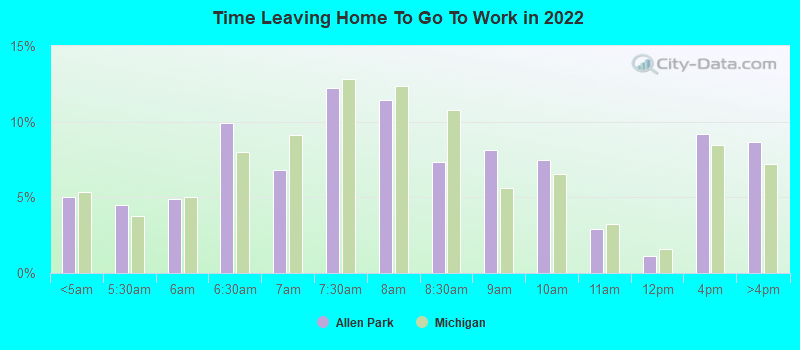
Travel time to work (commute)
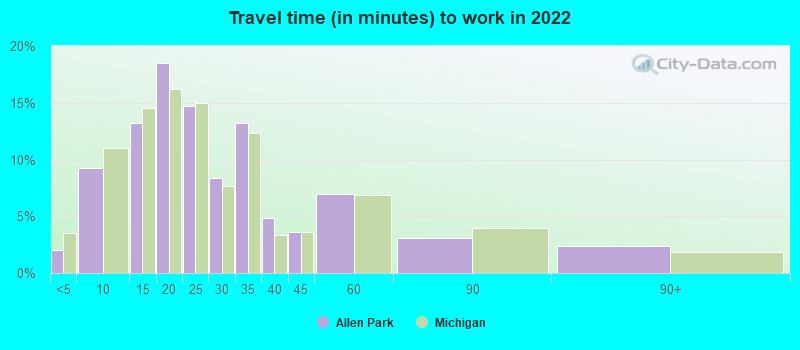
Less than 5 minutes: 2825 to 9 minutes: 1,07310 to 14 minutes: 1,79915 to 19 minutes: 2,19220 to 24 minutes: 1,71825 to 29 minutes: 1,08730 to 34 minutes: 1,52435 to 39 minutes: 55940 to 44 minutes: 35345 to 59 minutes: 1,05260 to 89 minutes: 19690 or more minutes: 245
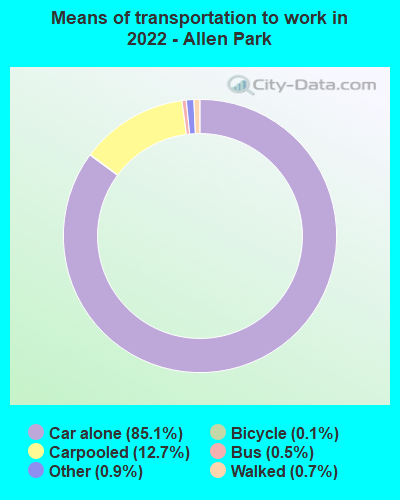
Means of transportation to work:
Drove a car alone: 10,441 (75.3%)Carpooled: 1,541 (11.1%)Bus : 53 (0.4%)Taxi: 120 (0.9%)Bicycle: 20 (0.1%)Walked: 86 (0.6%)Worked at home: 1,498 (10.8%)
Unemployment by race in 2022
Unemployment rate for White non-Hispanic residents 4.2% Males5.7% FemalesUnemployment rate for Black residents 7.7% FemalesUnemployment rate for other race residents 7.1% MalesUnemployment rate for two or more race residents 11.6% Males1.7% FemalesUnemployment rate for Hispanic or Latino residents 1.7% Females
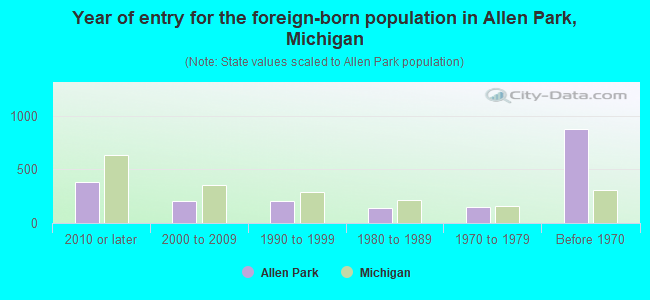
Year of entry for the foreign-born population in Allen Park, Michigan
382 2010 or later 209 2000 to 2009 204 1990 to 1999 139 1980 to 1989 145 1970 to 1979 878 Before 1970
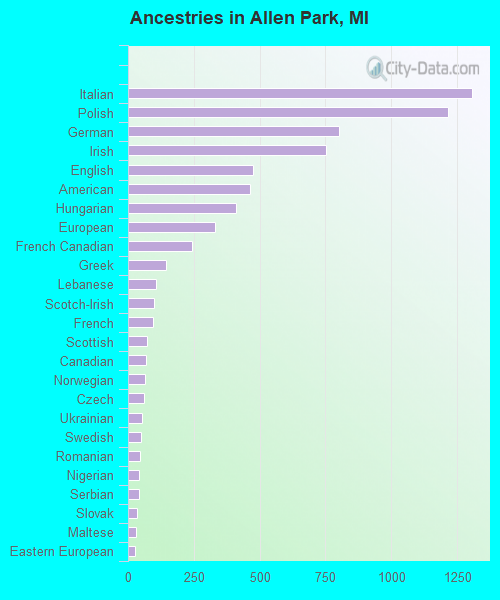
First ancestries reported:
Italian: 1,306 (11.9%)
Polish: 1,217 (11.1%)
German: 800 (7.3%)
Irish: 754 (6.9%)
English: 475 (4.3%)
American: 463 (4.2%)
Hungarian: 410 (3.7%)
European: 331 (3.0%)
French Canadian: 244 (2.2%)
Greek: 145 (1.3%)
Lebanese: 106 (1.0%)
Scotch-Irish: 98 (0.9%)
French: 96 (0.9%)
Scottish: 71 (0.6%)
Canadian: 70 (0.6%)
Norwegian: 64 (0.6%)
Czech: 60 (0.5%)
Ukrainian: 55 (0.5%)
Swedish: 48 (0.4%)
Romanian: 44 (0.4%)
Nigerian: 42 (0.4%)
Serbian: 41 (0.4%)
Slovak: 33 (0.3%)
Maltese: 29 (0.3%)
Eastern European: 28 (0.3%)
British: 24 (0.2%)
African: 23 (0.2%)
Finnish: 20 (0.2%)
Welsh: 19 (0.2%)
Albanian: 18 (0.2%)
Czechoslovakian: 16 (0.1%)
Russian: 15 (0.1%)
Latvian: 15 (0.1%)
Scandinavian: 13 (0.1%)
Armenian: 13 (0.1%)
Slavic: 12 (0.1%)
Lithuanian: 12 (0.1%)
Dutch: 10 (0.09%)
Macedonian: 10 (0.09%)
Danish: 10 (0.09%)
Arab: 9 (0.08%)
Ethiopian: 4 (0.04%)
Belgian: 1 (0.01%)
Syrian: 1 (0.01%) Most common places of birth for foreign-born residents (%): Mexico Allen Park:
23.5% (307)Michigan:
10.9% (75,965)
Philippines Allen Park:
13.3% (173)Michigan:
2.8% (19,112)
Italy Allen Park:
8.4% (110)Michigan:
1.1% (7,792)
Nepal Allen Park:
5.0% (65)Michigan:
0.4% (2,853)
Germany Allen Park:
4.8% (62)Michigan:
2.3% (16,126)
Peru Allen Park:
3.8% (50)Michigan:
0.2% (1,298)
Greece Allen Park:
3.5% (46)Michigan:
0.4% (2,721)
Canada Allen Park:
3.4% (44)Michigan:
5.0% (35,052)
Ireland Allen Park:
3.3% (43)Michigan:
0.2% (1,159)
Venezuela Allen Park:
3.1% (40)Michigan:
0.3% (1,871)
China, excluding Hong Kong and Taiwan Allen Park:
2.8% (37)Michigan:
4.9% (34,295)
Romania Allen Park:
2.5% (33)Michigan:
1.2% (8,563)
India Allen Park:
2.3% (30)Michigan:
11.1% (77,240)
Russia Allen Park:
2.1% (27)Michigan:
0.9% (6,326)
Lebanon Allen Park:
1.8% (24)Michigan:
3.7% (25,634)
Czechoslovakia (includes Czech Republic and Slovakia) Allen Park:
1.6% (21)Michigan:
0.2% (1,437)
Hungary Allen Park:
1.5% (20)Michigan:
0.1% (873)
Place of birth for U.S.-born residents:
This state: 23,867Other state: 2,620Northeast: 551Midwest: 850South: 751West: 476 93.2% of Allen Park residents lived in the same house 1 years ago.
Out of people who lived in different houses, 43.4% lived in this county.
Out of people who lived in different counties, 32.5% lived in Michigan.
Allen Park:
93.2%State average:
88.4%
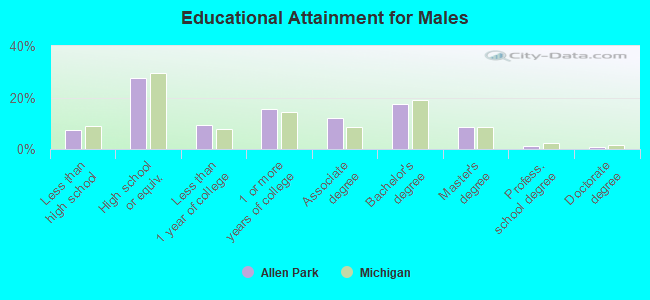
Education attainment for males 25 years and older:
No schooling: 139Nursery to 4th grade: 05th and 6th grade: 787th and 8th grade: 609th grade: 910th grade: 11511th grade: 7712th grade, no diploma: 244High school graduate (or equivalency): 2,649Less than 1 year of college: 908Some college more than 1 year, no degree: 1,482Associate degree: 1,177Bachelor's degree: 1,690Master's degree: 834Professional school degree: 119Doctorate degree: 70
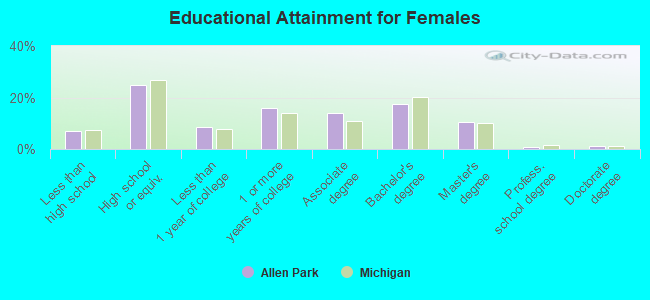
Education attainment for females 25 years and older:
No schooling: 104Nursery to 4th grade: 325th and 6th grade: 237th and 8th grade: 279th grade: 17610th grade: 6911th grade: 17412th grade, no diploma: 147High school graduate (or equivalency): 2,690Less than 1 year of college: 934Some college more than 1 year, no degree: 1,729Associate degree: 1,511Bachelor's degree: 1,912Master's degree: 1,116Professional school degree: 79Doctorate degree: 106
Housing units in structures:
One, detached: 11,372One, attached: 184Two: 843 or 4: 1245 to 9: 26310 to 19: 11920 to 49: 13150 or more: 121Mobile homes: 10Housing units lacking complete plumbing facilities in 2022: 0.6%Housing units lacking complete kitchen facilities in 2022: 0.8%House/condo owner moved in on average 17 years ago
Renter moved in on average 5 years ago
Private vs. public school enrollment:
Students in private schools in grades 1 to 8 (elementary and middle school): 725 Students in private schools in grades 9 to 12 (high school): 157 Students in private undergraduate colleges: 197