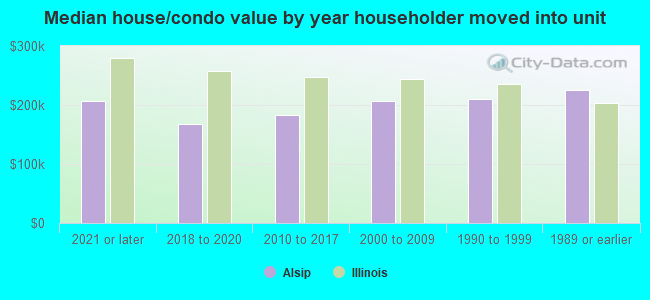
Alsip, IL (Illinois) Houses and Residents
| Alsip: | $203,807 |
| Illinois: | $251,600 |
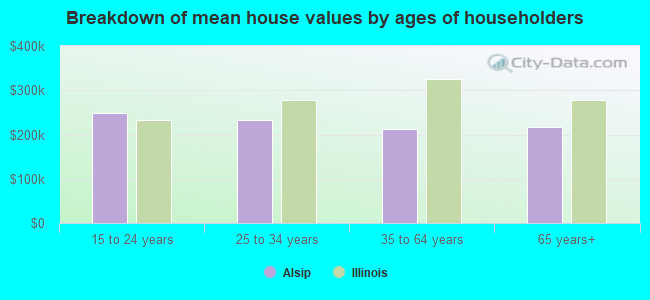
Mean price in 2022:
Detached houses: $230,745
Here: $230,745 State: $310,164 Townhouses or other attached units: $193,588
Here: $193,588 State: $286,230 In 2-unit structures: $181,218
Here: $181,218 State: $299,638 In 3-to-4-unit structures: $160,819
Here: $160,819 State: $330,907 In 5-or-more-unit structures: $100,257
Here: $100,257 State: $318,887
Total population: 19,427 (All urban)
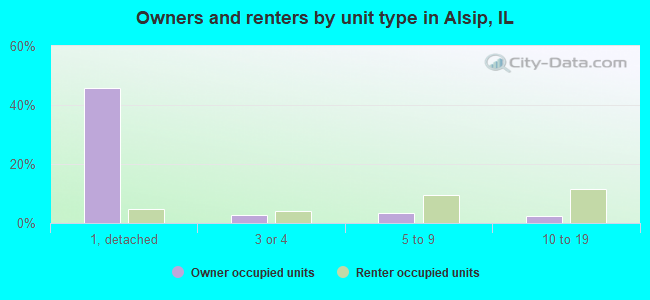
Houses: 7,982 (7,715 occupied: 4,968 owner occupied, 2,879 renter occupied)
| % of renters here: | 37% |
| State: | 33% |
Housing density: 1,254 houses/condos per square mile
Median price asked for vacant for-sale houses and condos in 2022: $46,256.
Median contract rent in 2022: $959 (lower quartile is $840, upper quartile is $1,126)
Median rent asked for vacant for-rent units in 2022: $5,699
Median gross rent in Alsip, IL in 2022: $1,072
Housing units in Alsip with a mortgage: 3,182 (335 second mortgage, 0 home equity loan, 207 both second mortgage and home equity loan)
Houses without a mortgage: 99
Median household income for houses/condos with a mortgage: $92,690
Median household income for apartments without a mortgage: $57,207
Median monthly housing costs: $1,105
Compare current foreclosures in Alsip, IL:
| Photo | Address | Area | Beds / Baths | Price | Details |
|---|---|---|---|---|---|

|
#1
W 129th St
Alsip, IL 60803
|
1,332 sq. feet
|
2 baths 3 beds |
show details | |

|
#2
S Keeler Ave
Alsip, IL 60803
|
1,403 sq. feet
|
1 baths - beds |
show details | |

|
#3
S Knox Ave
Alsip, IL 60803
|
996 sq. feet
|
2 baths - beds |
show details | |

|
#4
S Keeler Ave
Alsip, IL 60803
|
854 sq. feet
|
1 baths - beds |
show details | |

|
#5
S Ridgeway Ave
Alsip, IL 60803
|
854 sq. feet
|
1 baths - beds |
show details | |

|
#6
S Meadow Lane Dr
Alsip, IL 60803
|
986 sq. feet
|
1 baths - beds |
show details | |

|
#7
W Park Lane Dr
Alsip, IL 60803
|
6,060 sq. feet
|
6 baths - beds |
show details | |

|
#8
S Joalyce Dr
Alsip, IL 60803
|
1,632 sq. feet
|
2 baths - beds |
show details | |

|
#9
S Harding Ave
Alsip, IL 60803
|
1,418 sq. feet
|
1 baths - beds |
show details | |

|
#10
W Dixie Dr
Alsip, IL 60803
|
1,478 sq. feet
|
1 baths - beds |
show details |
| Photo | Address | Area | Beds / Baths | Price | Details |
|---|---|---|---|---|---|

|
#11
S Lavergne Ave
Alsip, IL 60803
|
864 sq. feet
|
1 baths - beds |
show details | |

|
#12
S Troy Dr
Alsip, IL 60803
|
1,308 sq. feet
|
1 baths - beds |
show details | |

|
#13
S Leclaire Ave
Alsip, IL 60803
|
1,276 sq. feet
|
1 baths - beds |
show details | |

|
#14
S Kolin Ave
Alsip, IL 60803
|
1,080 sq. feet
|
1 baths - beds |
show details | |

|
#15
S Orchard Ln
Alsip, IL 60803
|
1,332 sq. feet
|
1 baths - beds |
show details | |

|
#16
S Laramie Ave
Alsip, IL 60803
|
1,940 sq. feet
|
1 baths - beds |
show details | |

|
#17
W Holmberg Ct
Alsip, IL 60803
|
1,296 sq. feet
|
2 baths - beds |
show details | |

|
#18
S Austin Ave
Alsip, IL 60803
|
1,214 sq. feet
|
2 baths - beds |
show details | |

|
#19
W Palisades Dr
Alsip, IL 60803
|
1,246 sq. feet
|
1 baths - beds |
show details | |

|
#20
S Kilbourn Ave
Alsip, IL 60803
|
1,693 sq. feet
|
2 baths - beds |
show details |
| Photo | Address | Area | Beds / Baths | Price | Details |
|---|---|---|---|---|---|

|
#21
S Kedzie Ave
Alsip, IL 60803
|
986 sq. feet
|
1 baths - beds |
show details | |

|
#22
W Linecrest Dr
Alsip, IL 60803
|
1,080 sq. feet
|
1 baths - beds |
show details | |

|
#23
S Meadow Lane Dr
Alsip, IL 60803
|
986 sq. feet
|
1 baths - beds |
show details | |

|
#24
S Ridgeway Ave
Alsip, IL 60803
|
- sq. feet
|
- baths - beds |
show details | |

|
#25
W 124th St
Alsip, IL 60803
|
- sq. feet
|
- baths - beds |
show details | |

|
#26
S Homan Ave, Trlr 74
Alsip, IL 60803
|
- sq. feet
|
- baths - beds |
show details | |

|
#27
S Homan Ave, Trlr 216
Alsip, IL 60803
|
- sq. feet
|
- baths - beds |
show details | |

|
#28
W 123rd Pl
Alsip, IL 60803
|
- sq. feet
|
- baths - beds |
show details | |

|
#29
S Karlov Ave Apt 1a
Alsip, IL 60803
|
- sq. feet
|
- baths - beds |
show details | |

|
#30
W 122nd St
Alsip, IL 60803
|
- sq. feet
|
- baths - beds |
show details |
| Photo | Address | Area | Beds / Baths | Price | Details |
|---|---|---|---|---|---|

|
#31
S Kildare Ave Apt 1w
Alsip, IL 60803
|
- sq. feet
|
- baths - beds |
show details | |

|
#32
W 124th St Apt 2w
Alsip, IL 60803
|
- sq. feet
|
- baths - beds |
show details | |

|
#33
W Park Lane Dr
Alsip, IL 60803
|
- sq. feet
|
- baths - beds |
show details | |

|
#34
W 120th St Apt 1c
Alsip, IL 60803
|
- sq. feet
|
- baths - beds |
show details | |

|
#35
S Kenneth Ave Apt D5
Alsip, IL 60803
|
- sq. feet
|
- baths - beds |
show details | |

|
#36
W Park Lane Dr Apt 2c
Alsip, IL 60803
|
- sq. feet
|
- baths - beds |
show details | |

|
#37
W 125th St
Alsip, IL 60803
|
- sq. feet
|
- baths - beds |
show details | |

|
#38
S La Crosse Ave Apt 3a
Alsip, IL 60803
|
- sq. feet
|
- baths - beds |
show details | |

|
#39
W Park Lane Dr Apt 3d
Alsip, IL 60803
|
- sq. feet
|
- baths - beds |
show details | |

|
#40
W 124th Pl Apt 1w
Alsip, IL 60803
|
- sq. feet
|
- baths - beds |
show details |
| Photo | Address | Area | Beds / Baths | Price | Details |
|---|---|---|---|---|---|

|
#41
W 115th St, Apt 9
Alsip, IL 60803
|
- sq. feet
|
- baths - beds |
show details | |

|
#42
W 115th Pl
Alsip, IL 60803
|
- sq. feet
|
- baths - beds |
show details | |

|
#43
W Park Lane Dr Apt 2b
Alsip, IL 60803
|
- sq. feet
|
- baths - beds |
show details | |

|
#44
W 123rd Pl Apt 108
Alsip, IL 60803
|
- sq. feet
|
- baths - beds |
show details | |

|
#45
W 118th St # 9
Alsip, IL 60803
|
- sq. feet
|
- baths - beds |
show details | |

|
#46
W 122nd St Apt 203
Alsip, IL 60803
|
- sq. feet
|
- baths - beds |
show details | |

|
#47
W 121st Pl
Alsip, IL 60803
|
- sq. feet
|
- baths - beds |
show details | |

|
#48
S Karlov Ave Apt 3w
Alsip, IL 60803
|
- sq. feet
|
- baths - beds |
show details | |

|
#49
W 127th St Apt 7
Alsip, IL 60803
|
- sq. feet
|
- baths - beds |
show details | |

|
Check over 1 million property listings on Foreclosure.com!
|
browse all offers | |||

Latest news about housing in Alsip, IL collected exclusively by city-data.com from local newspapers, TV, and radio stations

 | Suburbs that are obscure or little-known (240 replies) |
| Buying a place-100k budget (7 replies) |
| Suburb Danger Tiers (75 replies) |
| Studio apartment in the Blue Island or Alsip Area (1 reply) |
| Thinking of Moving to ALSIP - How is the Suburb (7 replies) |
| Buying a house in Alsip need help (2 replies) |

Median year apartment built: 1978
Household type by relationship:
Households: 18,446- Male householders: 3,158 (1,206 living alone), Female householders: 4,354 (1,557 living alone)
3,020 spouses (3,020 opposite-sex spouses), 444 unmarried partners, (349 opposite-sex unmarried partners), 5,936 children (5,691 natural, 13 adopted, 230 stepchildren), 657 grandchildren, 159 brothers or sisters, 214 parents, 46 foster children, 230 other relatives, 190 non-relatives
- In group quarters: 34
Size of family households: 1,605 2-persons, 1,263 3-persons, 935 4-persons, 486 5-persons, 125 6-persons, 89 7-or-more-persons.
Size of nonfamily households: 2,969 1-person, 350 2-persons, 12 3-persons.
2,374 married couples with children.
1,242 single-parent households (204 men, 1,038 women).
79.4% of residents of Alsip speak English at home.
14.4% of residents speak Spanish at home (69% speak English very well, 22% speak English well, 5% speak English not well, 4% don't speak English at all).
2.4% of residents speak other Indo-European language at home (71% speak English very well, 12% speak English well, 17% speak English not well).
1.4% of residents speak Asian or Pacific Island language at home (58% speak English very well, 21% speak English well, 21% speak English not well).
2.0% of residents speak other language at home (58% speak English very well, 33% speak English well, 9% speak English not well).
Foreign born population: 1,831 (9.9%)
(60.1% of them are naturalized citizens)
| Here: | 6.4 |
| State: | 6.4 |
| Here: | 4.1 |
| State: | 4.1 |
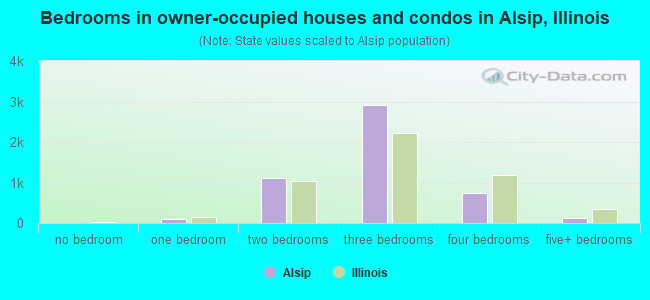
- Bedrooms in owner-occupied houses and condos in Alsip, Illinois
- 0no bedroom
- 921 bedroom
- 1,1092 bedrooms
- 2,9063 bedrooms
- 7354 bedrooms
- 1265+ bedrooms
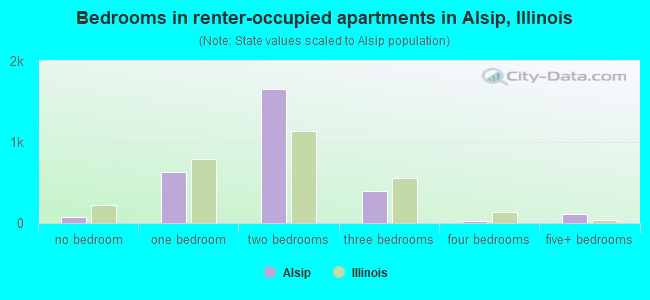
- Bedrooms in renter-occupied apartments in Alsip, Illinois
- 70no bedroom
- 6281 bedroom
- 1,6522 bedrooms
- 3993 bedrooms
- 234 bedrooms
- 1065+ bedrooms
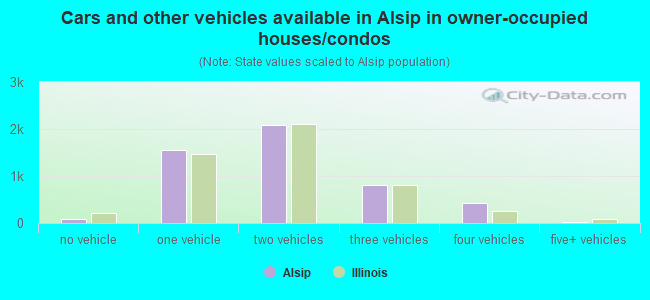
- Cars and other vehicles available in Alsip in owner-occupied houses/condos
- 80no vehicle
- 1,5531 vehicle
- 2,0792 vehicles
- 8113 vehicles
- 4234 vehicles
- 235+ vehicles
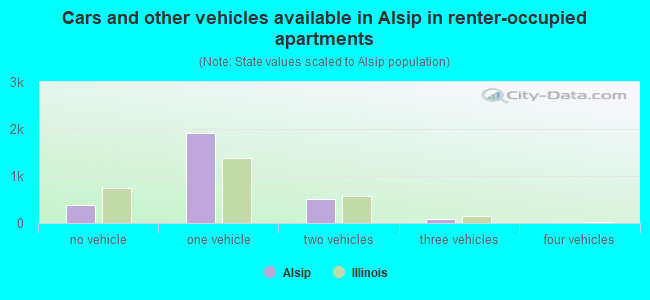
- Cars and other vehicles available in Alsip in renter-occupied apartments
- 387no vehicle
- 1,9051 vehicle
- 5022 vehicles
- 863 vehicles
- 04 vehicles
- 05+ vehicles
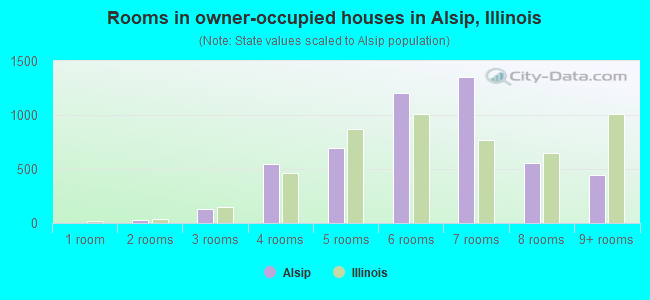
- Rooms in owner-occupied houses in Alsip, Illinois
- 01 room
- 302 rooms
- 1343 rooms
- 5464 rooms
- 6955 rooms
- 1,2086 rooms
- 1,3567 rooms
- 5558 rooms
- 4449+ rooms
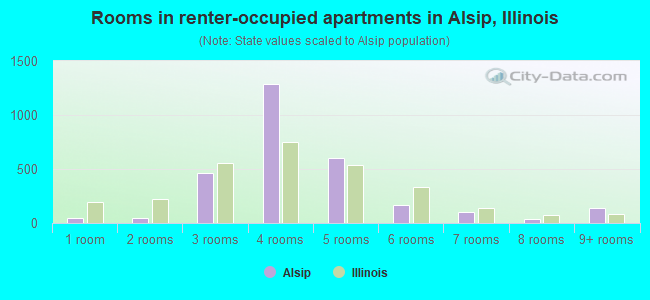
- Rooms in renter-occupied apartments in Alsip, Illinois
- 461 room
- 472 rooms
- 4623 rooms
- 1,2894 rooms
- 5995 rooms
- 1696 rooms
- 987 rooms
- 358 rooms
- 1369+ rooms
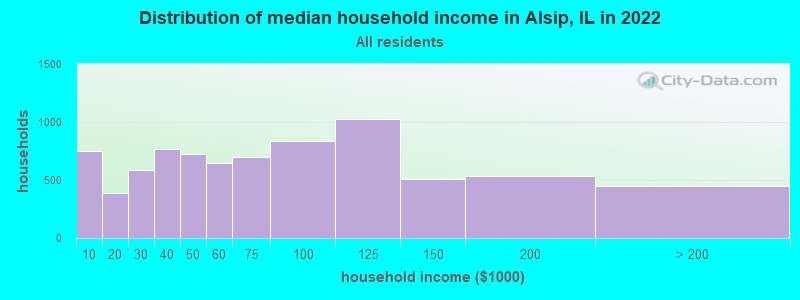
Alsip, IL household income distribution

- 753Less than $10,000
- 384$10,000 to $19,999
- 584$20,000 to $29,999
- 765$30,000 to $39,999
- 720$40,000 to $49,999
- 650$50,000 to $59,999
- 699$60,000 to $74,999
- 838$75,000 to $99,999
- 1,027$100,000 to $124,999
- 507$125,000 to $149,999
- 538$150,000 to $199,999
- 452$200,000 or more
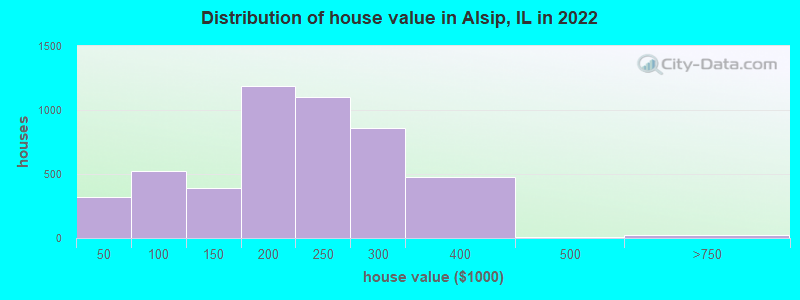
Home value of owner - occupied houses in 2022 in Alsip, IL
-
- 91Less than $10,000
- 10$10,000 to $14,999
- 88$20,000 to $24,999
- 7$25,000 to $29,999
- 44$30,000 to $34,999
- 76$40,000 to $49,999
- 73$60,000 to $69,999
- 61$70,000 to $79,999
- 144$80,000 to $89,999
- 171$90,000 to $99,999
- 142$100,000 to $124,999
- 246$125,000 to $149,999
- 721$150,000 to $174,999
- 463$175,000 to $199,999
- 1,100$200,000 to $249,999
- 858$250,000 to $299,999
- 473$300,000 to $399,999
- 8$400,000 to $499,999
- 24$500,000 to $749,999
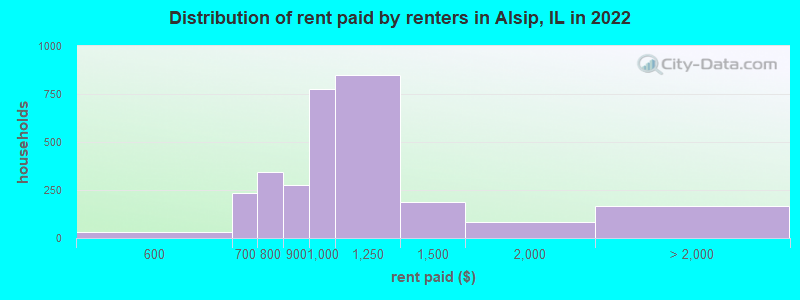
Rent paid by renters in 2022 in Alsip, IL
-
- 30$500 to $549
- 120$600 to $649
- 115$650 to $699
- 183$700 to $749
- 160$750 to $799
- 275$800 to $899
- 776$900 to $999
- 847$1,000 to $1,249
- 184$1,250 to $1,499
- 84$1,500 to $1,999
- 164No cash rent
Percentage of workers working in this county: 90.9%
Number of people working at home: 599 (6.6% of all workers)
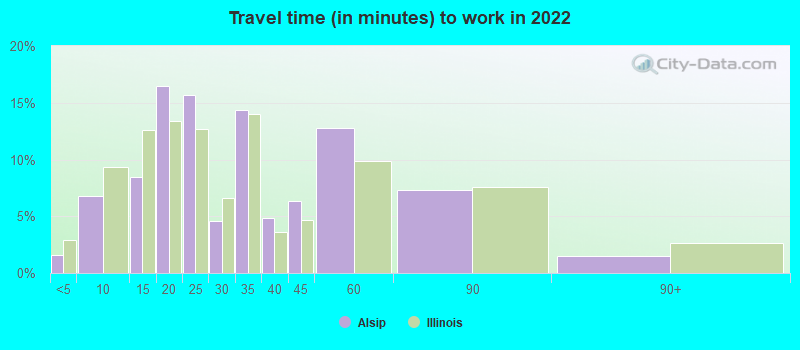
Travel time to work (commute)
- Less than 5 minutes: 111
- 5 to 9 minutes: 861
- 10 to 14 minutes: 878
- 15 to 19 minutes: 620
- 20 to 24 minutes: 950
- 25 to 29 minutes: 472
- 30 to 34 minutes: 1,518
- 35 to 39 minutes: 237
- 40 to 44 minutes: 433
- 45 to 59 minutes: 1,053
- 60 to 89 minutes: 777
- 90 or more minutes: 223
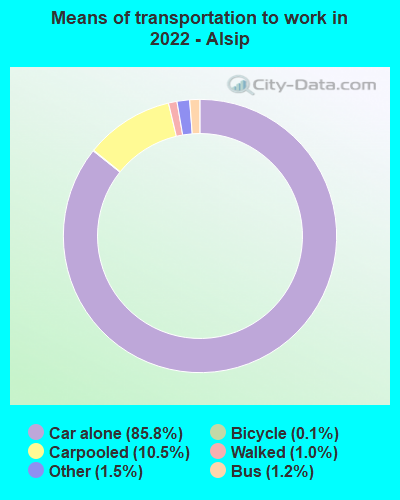
Means of transportation to work:
- Drove a car alone: 10,241 (80.2%)
- Carpooled: 1,337 (10.5%)
- Bus: 130 (1.0%)
- Taxi: 178 (1.4%)
- Bicycle: 13 (0.1%)
- Walked: 117 (0.9%)
- Worked at home: 599 (4.7%)
- Unemployment by race in 2022
- Unemployment rate for White non-Hispanic residents
- 3.9%Males
- 2.5%Females
- Unemployment rate for Black residents
- 3.3%Males
- 8.7%Females
- Unemployment rate for American Indian and Alaska Native residents
- 34.8%Females
- Unemployment rate for Asian residents
- 6.9%Females
- Unemployment rate for other race residents
- 20.2%Males
- 7.3%Females
- Unemployment rate for two or more race residents
- 18.4%Males
- 5.6%Females
- Unemployment rate for Hispanic or Latino residents
- 8.0%Males
- 5.0%Females
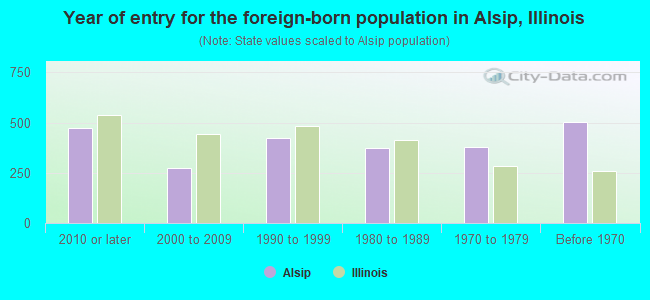
- Year of entry for the foreign-born population in Alsip, Illinois
- 4752010 or later
- 2722000 to 2009
- 4241990 to 1999
- 3731980 to 1989
- 3771970 to 1979
- 502Before 1970
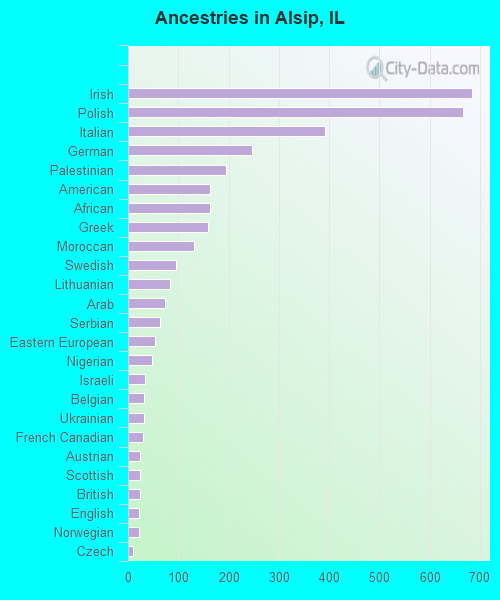
First ancestries reported:
- Irish: 684 (7.1%)
- Polish: 667 (6.9%)
- Italian: 392 (4.1%)
- German: 246 (2.6%)
- Palestinian: 194 (2.0%)
- American: 164 (1.7%)
- African: 164 (1.7%)
- Greek: 160 (1.7%)
- Moroccan: 132 (1.4%)
- Swedish: 95 (1.0%)
- Lithuanian: 84 (0.9%)
- Arab: 74 (0.8%)
- Serbian: 63 (0.7%)
- Eastern European: 54 (0.6%)
- Nigerian: 47 (0.5%)
- Israeli: 34 (0.4%)
- Belgian: 31 (0.3%)
- Ukrainian: 31 (0.3%)
- French Canadian: 29 (0.3%)
- Austrian: 24 (0.2%)
- Scottish: 24 (0.2%)
- British: 23 (0.2%)
- English: 21 (0.2%)
- Norwegian: 21 (0.2%)
- Czech: 10 (0.1%)
- Romanian: 9 (0.09%)
- Danish: 7 (0.07%)
- Dutch: 7 (0.07%)
- Turkish: 7 (0.07%)
Most common places of birth for foreign-born residents (%):
| Alsip: | 40.0% (733) |
| Illinois: | 34.7% (626,958) |
| Alsip: | 13.7% (251) |
| Illinois: | 5.2% (93,003) |
| Alsip: | 6.1% (111) |
| Illinois: | 1.2% (21,186) |
| Alsip: | 5.4% (99) |
| Illinois: | 6.9% (124,474) |
| Alsip: | 4.7% (86) |
| Illinois: | 0.2% (3,781) |
| Alsip: | 3.7% (68) |
| Illinois: | 0.5% (8,574) |
| Alsip: | 3.5% (64) |
| Illinois: | 0.6% (10,720) |
| Alsip: | 2.9% (54) |
| Illinois: | 0.9% (15,679) |
| Alsip: | 2.7% (50) |
| Illinois: | 1.2% (22,269) |
| Alsip: | 2.4% (44) |
| Illinois: | 0.4% (7,117) |
| Alsip: | 2.1% (38) |
| Illinois: | 0.2% (4,177) |
Place of birth for U.S.-born residents:
- This state: 14,231
- Other state: 1,848
- Northeast: 73
- Midwest: 635
- South: 984
- West: 128
94.9% of Alsip residents lived in the same house 1 years ago.
Out of people who lived in different houses, 42.4% lived in this county.
Out of people who lived in different counties, 9.9% lived in Illinois.
| Alsip: | 94.9% |
| State average: | 88.3% |
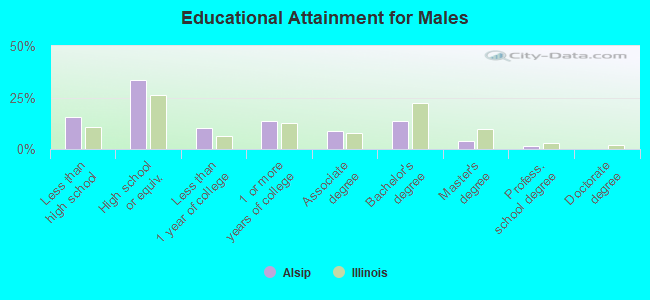
Education attainment for males 25 years and older:
- No schooling: 198
- Nursery to 4th grade: 75
- 5th and 6th grade: 56
- 7th and 8th grade: 20
- 9th grade: 120
- 10th grade: 98
- 11th grade: 76
- 12th grade, no diploma: 256
- High school graduate (or equivalency): 1,967
- Less than 1 year of college: 582
- Some college more than 1 year, no degree: 790
- Associate degree: 517
- Bachelor's degree: 786
- Master's degree: 219
- Professional school degree: 72
- Doctorate degree: 0
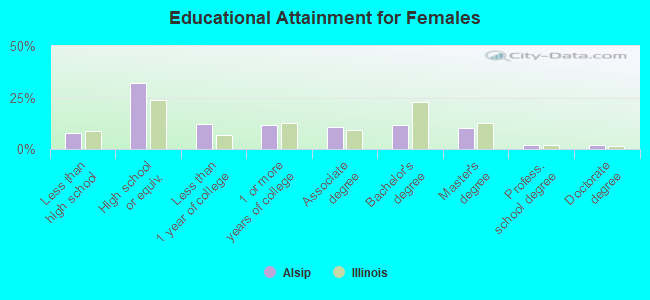
Education attainment for females 25 years and older:
- No schooling: 38
- Nursery to 4th grade: 105
- 5th and 6th grade: 40
- 7th and 8th grade: 23
- 9th grade: 8
- 10th grade: 81
- 11th grade: 68
- 12th grade, no diploma: 173
- High school graduate (or equivalency): 2,148
- Less than 1 year of college: 818
- Some college more than 1 year, no degree: 782
- Associate degree: 719
- Bachelor's degree: 786
- Master's degree: 700
- Professional school degree: 120
- Doctorate degree: 114


Housing units in structures:
- One, detached: 4,300
- One, attached: 397
- Two: 164
- 3 or 4: 601
- 5 to 9: 1,005
- 10 to 19: 1,095
- 20 to 49: 266
- 50 or more: 142
- Mobile homes: 9
Housing units lacking complete kitchen facilities in 2022: 2.0%
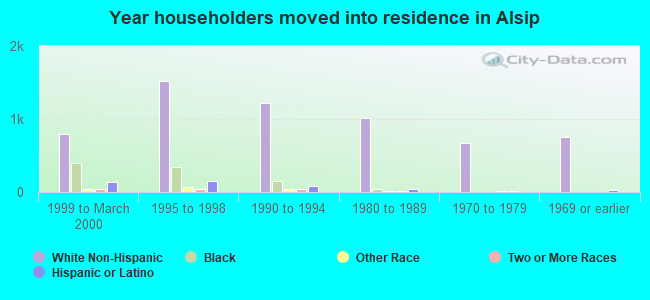
House/condo owner moved in on average 17 years ago
Renter moved in on average 7 years ago
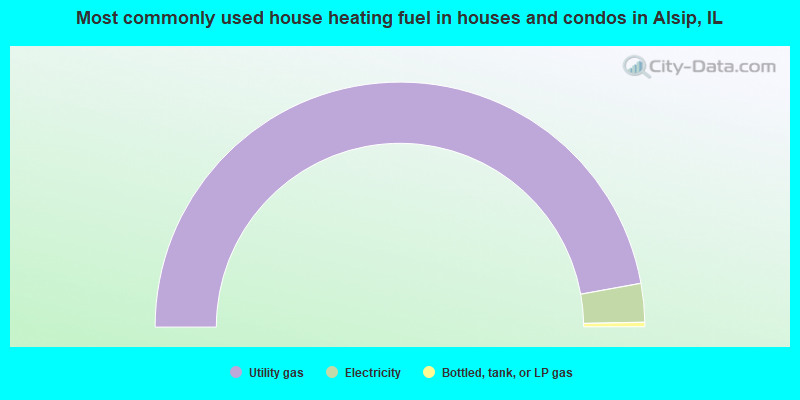
- 94.3%Utility gas
- 5.1%Electricity
- 0.6%Bottled, tank, or LP gas
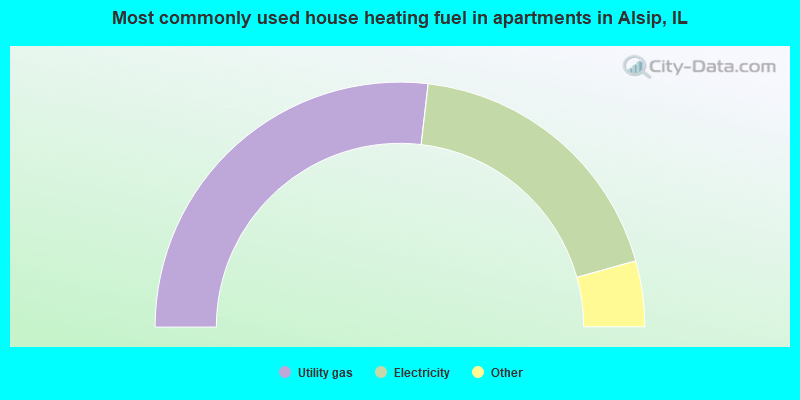
- 53.7%Utility gas
- 37.6%Electricity
- 3.9%Other fuel
- 3.3%No fuel used
- 1.5%Bottled, tank, or LP gas
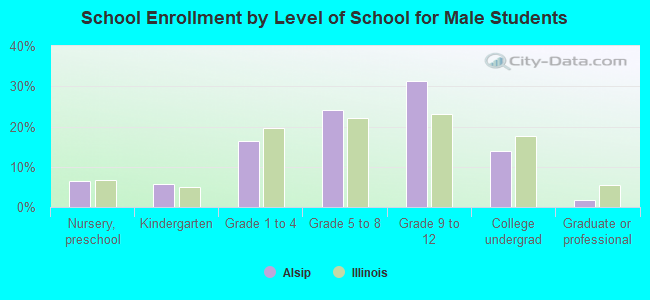
Private vs. public school enrollment:
| Here: | 8.6% |
| Illinois: | 13.3% |
| Here: | 1.2% |
| Illinois: | 9.9% |
| Here: | 22.1% |
| Illinois: | 27.4% |