Appleton, WI (Wisconsin) Houses and Residents
Estimated median house or condo value in 2022: $215,600 (it was $97,600 in 2000 )
Appleton:
$215,600Wisconsin:
$252,800
Lower value quartile - upper value quartile: $162,000 - $294,500Mean price in 2022: Detached houses: $245,471 Here:
$245,471State:
$308,468
Townhouses or other attached units: $262,012 Here:
$262,012State:
$265,873
In 2-unit structures: $197,246 Here:
$197,246State:
$203,667
In 3-to-4-unit structures: $156,406 Here:
$156,406State:
$216,833
In 5-or-more-unit structures: $236,472 Here:
$236,472State:
$280,537
Mobile homes: $27,436 Here:
$27,436State:
$79,042
Total population: 73,971 (Urban population: 69,597, Rural population: 527 (all nonfarm) )
Houses: 33,633 (33,104 occupied: 21,624 owner occupied, 11,480 renter occupied )
% of renters here:
35%State:
32%
Housing density: 1,610 houses/condos per square mile
Median price asked for vacant for-sale houses and condos in 2022: $189,845.
Median contract rent in 2022: $814 (lower quartile is $645, upper quartile is $1,058)
Median rent asked for vacant for-rent units in 2022: $935
Median gross rent in Appleton, WI in 2022: $983
Housing units in Appleton with a mortgage: 13,307 (1,727 second mortgage, 55 home equity loan, 1,456 both second mortgage and home equity loan )Houses without a mortgage: 208
Median household income for houses/condos with a mortgage: $94,297
Median household income for apartments without a mortgage: $73,858
Median monthly housing costs: $1,046
Data:
Median house or condo value ($)
Median house or condo value ($ change since 2000)
Median house or condo value ($) - White
Median house or condo value ($) - Black or African American
Median house or condo value ($) - Asian
Median house or condo value ($) - Hispanic or Latino
Median house or condo value ($) - American Indian and Alaska Native
Median house or condo value ($) - Multirace
Median house or condo value ($) - Other Race
Median price asked for mobile homes ($)
Household density (households per square mile)
Mean house or condo value by units in structure - 1, detached ($)
Mean house or condo value by units in structure - 1, attached ($)
Mean house or condo value by units in structure - 2 ($)
Mean house or condo value by units in structure by units in structure - 3 or 4 ($)
Mean house or condo value by units in structure - 5 or more ($)
Mean house or condo value by units in structure - Boat, RV, van, etc. ($)
Mean house or condo value by units in structure - Mobile home ($)
Median contract rent ($)
Median contract rent - Lower quartile ($)
Median contract rent - Upper quartile ($)
Median gross rent ($)
Urban houses (%)
Rural houses (%)
Houses occupied (%)
Houses occupied (% change since 2000)
Houses owner occupied (%)
Houses owner occupied (% change since 2000)
Houses renter occupied (%)
Houses renter occupied (% change since 2000)
Vacant housing units - For rent (%)
Vacant housing units - For rent (% change since 2000)
Vacant housing units - For sale only (%)
Vacant housing units - For sale only (% change since 2000)
Vacant housing units - Rented or sold, not occupied (%)
Vacant housing units - Rented or sold, not occupied (% change since 2000)
Vacant housing units - For seasonal, recreational, or occasional use (%)
Vacant housing units - For seasonal, recreational, or occasional use (% change since 2000)
Vacant housing units - For migrant workers (%)
Vacant housing units - For migrant workers (% change since 2000)
Vacant housing units - Other vacant (%)
Vacant housing units - Other vacant (% change since 2000)
Median monthly housing costs ($)
Median household income for houses/condos with a mortgage ($)
Median household income for houses/condos without a mortgage ($)
Median household income ($)
Median household income ($) - White
Median household income ($) - Black or African American
Median household income ($) - Asian
Median household income ($) - Hispanic or Latino
Median household income ($) - American Indian and Alaska Native
Median household income ($) - Multirace
Median household income ($) - Other Race
Mortgage status - with mortgage (%)
Mortgage status - with second mortgage (%)
Mortgage status - with home equity loan (%)
Mortgage status - with both second mortgage and home equity loan (%)
Mortgage status - without a mortgage (%)
Median year house/condo built
Median year apartment built
Household type by relationship - Male householder living alone (%)
Household type by relationship - Male householder not living alone (%)
Household type by relationship - Female householder living alone (%)
Household type by relationship - Female householder not living alone (%)
Household type by relationship - Opposite-Sex spouse (%)
Household type by relationship - Same-Sex spouse (%)
Household type by relationship - Opposite-Sex unmarried partner (%)
Household type by relationship - Same-Sex unmarried partner (%)
Household type by relationship - In group quarters (%)
Size of family households - 2-person household (%)
Size of family households - 3-person household (%)
Size of family households - 4-person household (%)
Size of family households - 5-person household (%)
Size of family households - 6-person household (%)
Size of family households - 7-or-more-person household (%)
Size of nonfamily households - 1-person household (%)
Size of nonfamily households - 2-person household (%)
Size of nonfamily households - 3-person household (%)
Size of nonfamily households - 4-person household (%)
Size of nonfamily households - 5-person household (%)
Size of nonfamily households - 6-person household (%)
Size of nonfamily households - 7-or-moreperson household (%)
Year house built - Built 2010 or later (%)
Year house built - Built 2000 to 2009 (%)
Year house built - Built 1990 to 1999 (%)
Year house built - Built 1980 to 1989 (%)
Year house built - Built 1970 to 1979 (%)
Year house built - Built 1960 to 1969 (%)
Year house built - Built 1950 to 1959 (%)
Year house built - Built 1940 to 1949 (%)
Year house built - Built 1939 or earlier (%)
Median number of rooms in houses and condos
Median number of rooms in apartments
Median number of bedrooms in owner occupied houses
Mean number of bedrooms in owner occupied houses
Median number of bedrooms in renter occupied houses
Mean number of bedrooms in renter occupied houses
Median number of vehichles in owner occupied houses
Mean number of vehichles in owner occupied houses
Median number of vehichles in renter occupied houses
Mean number of vehichles in renter occupied houses
Rooms in owner-occupied houses - 1 room (%)
Rooms in owner-occupied houses - 2 rooms (%)
Rooms in owner-occupied houses - 3 rooms (%)
Rooms in owner-occupied houses - 4 rooms (%)
Rooms in owner-occupied houses - 5 rooms (%)
Rooms in owner-occupied houses - 6 rooms (%)
Rooms in owner-occupied houses - 7 rooms (%)
Rooms in owner-occupied houses - 8 rooms (%)
Rooms in owner-occupied houses - 9+ rooms (%)
Rooms in renter-occupied houses - 1 room (%)
Rooms in renter-occupied houses - 2 rooms (%)
Rooms in renter-occupied houses - 3 rooms (%)
Rooms in renter-occupied houses - 4 rooms (%)
Rooms in renter-occupied houses - 5 rooms (%)
Rooms in renter-occupied houses - 6 rooms (%)
Rooms in renter-occupied houses - 7 rooms (%)
Rooms in renter-occupied houses - 8 rooms (%)
Rooms in renter-occupied houses - 9+ rooms (%)
Bedrooms in owner-occupied houses - no bedrooms (%)
Bedrooms in owner-occupied houses - 1 bedroom (%)
Bedrooms in owner-occupied houses - 2 bedrooms (%)
Bedrooms in owner-occupied houses - 3 bedrooms (%)
Bedrooms in owner-occupied houses - 4 bedrooms (%)
Bedrooms in owner-occupied houses - 5+ bedrooms (%)
Bedrooms in renter-occupied houses - no bedrooms (%)
Bedrooms in renter-occupied houses - 1 bedroom (%)
Bedrooms in renter-occupied houses - 2 bedrooms (%)
Bedrooms in renter-occupied houses - 3 bedrooms (%)
Bedrooms in renter-occupied houses - 4 bedrooms (%)
Bedrooms in renter-occupied houses - 5+ bedrooms (%)
Vehicles available in owner-occupied houses - no vehicle available (%)
Vehicles available in owner-occupied houses - 1 vehicle available(%)
Vehicles available in owner-occupied houses - 2 Vehicles available (%)
Vehicles available in owner-occupied houses - 3 Vehicles available (%)
Vehicles available in owner-occupied houses - 4 Vehicles available (%)
Vehicles available in owner-occupied houses - 5+ Vehicles available (%)
Vehicles available in renter-occupied houses - no vehicle available (%)
Vehicles available in renter-occupied houses - 1 vehicle available (%)
Vehicles available in renter-occupied houses - 2 Vehicles available (%)
Vehicles available in renter-occupied houses - 3 Vehicles available (%)
Vehicles available in renter-occupied houses - 4 Vehicles available (%)
Vehicles available in renter-occupied houses - 5+ Vehicles available (%)
Housing units in structures - 1, detached (%)
Housing units in structures - 1, attached (%)
Housing units in structures - 2 (%)
Housing units in structures - 3 or 4 (%)
Housing units in structures - 5 to 9 (%)
Housing units in structures - 10 to 19 (%)
Housing units in structures - 20 to 49 (%)
Housing units in structures - 50 or more (%)
Housing units in structures - Mobile home (%)
Housing units in structures - Boat, RV, van, etc. (%)
Housing units in structures - Owners - 1, detached (%)
Housing units in structures - Owners - 1, attached (%)
Housing units in structures - Owners - 2 (%)
Housing units in structures - Owners - 3 or 4 (%)
Housing units in structures - Owners - 5 to 9 (%)
Housing units in structures - Owners - 10 to 19 (%)
Housing units in structures - Owners - 20 to 49 (%)
Housing units in structures - Owners - 50 or more (%)
Housing units in structures - Owners - Mobile home (%)
Housing units in structures - Owners - Boat, RV, van, etc. (%)
Housing units in structures - Renters - 1, detached (%)
Housing units in structures - Renters - 1, attached (%)
Housing units in structures - Renters - 2 (%)
Housing units in structures - Renters - 3 or 4 (%)
Housing units in structures - Renters - 5 to 9 (%)
Housing units in structures - Renters - 10 to 19 (%)
Housing units in structures - Renters - 20 to 49 (%)
Housing units in structures - Renters - 50 or more (%)
Housing units in structures - Renters - Mobile home (%)
Housing units in structures - Renters - Boat, RV, van, etc. (%)
House/condo owner moved in on average (years ago)
Renter moved in on average (years ago)
Year householder moved into unit - Moved in 1999 to March 2000 (%)
Year householder moved into unit - Moved in 1999 to March 2000 (%) - White
Year householder moved into unit - Moved in 1999 to March 2000 (%) - Black or African American
Year householder moved into unit - Moved in 1999 to March 2000 (%) - Asian
Year householder moved into unit - Moved in 1999 to March 2000 (%) - Hispanic or Latino
Year householder moved into unit - Moved in 1999 to March 2000 (%) - American Indian and Alaska Native
Year householder moved into unit - Moved in 1999 to March 2000 (%) - Multirace
Year householder moved into unit - Moved in 1999 to March 2000 (%) - Other Race
Year householder moved into unit - Moved in 1995 to 1998 (%)
Year householder moved into unit - Moved in 1995 to 1998 (%) - White
Year householder moved into unit - Moved in 1995 to 1998 (%) - Black or African American
Year householder moved into unit - Moved in 1995 to 1998 (%) - Asian
Year householder moved into unit - Moved in 1995 to 1998 (%) - Hispanic or Latino
Year householder moved into unit - Moved in 1995 to 1998 (%) - American Indian and Alaska Native
Year householder moved into unit - Moved in 1995 to 1998 (%) - Multirace
Year householder moved into unit - Moved in 1995 to 1998 (%) - Other Race
Year householder moved into unit - Moved in 1990 to 1994 (%)
Year householder moved into unit - Moved in 1990 to 1994 (%) - White
Year householder moved into unit - Moved in 1990 to 1994 (%) - Black or African American
Year householder moved into unit - Moved in 1990 to 1994 (%) - Asian
Year householder moved into unit - Moved in 1990 to 1994 (%) - Hispanic or Latino
Year householder moved into unit - Moved in 1990 to 1994 (%) - American Indian and Alaska Native
Year householder moved into unit - Moved in 1990 to 1994 (%) - Multirace
Year householder moved into unit - Moved in 1990 to 1994 (%) - Other Race
Year householder moved into unit - Moved in 1980 to 1989 (%)
Year householder moved into unit - Moved in 1980 to 1989 (%) - White
Year householder moved into unit - Moved in 1980 to 1989 (%) - Black or African American
Year householder moved into unit - Moved in 1980 to 1989 (%) - Asian
Year householder moved into unit - Moved in 1980 to 1989 (%) - Hispanic or Latino
Year householder moved into unit - Moved in 1980 to 1989 (%) - American Indian and Alaska Native
Year householder moved into unit - Moved in 1980 to 1989 (%) - Multirace
Year householder moved into unit - Moved in 1980 to 1989 (%) - Other Race
Year householder moved into unit - Moved in 1970 to 1979 (%)
Year householder moved into unit - Moved in 1970 to 1979 (%) - White
Year householder moved into unit - Moved in 1970 to 1979 (%) - Black or African American
Year householder moved into unit - Moved in 1970 to 1979 (%) - Asian
Year householder moved into unit - Moved in 1970 to 1979 (%) - Hispanic or Latino
Year householder moved into unit - Moved in 1970 to 1979 (%) - American Indian and Alaska Native
Year householder moved into unit - Moved in 1970 to 1979 (%) - Multirace
Year householder moved into unit - Moved in 1970 to 1979 (%) - Other Race
Year householder moved into unit - Moved in 1969 or earlier (%)
Year householder moved into unit - Moved in 1969 or earlier (%) - White
Year householder moved into unit - Moved in 1969 or earlier (%) - Black or African American
Year householder moved into unit - Moved in 1969 or earlier (%) - Asian
Year householder moved into unit - Moved in 1969 or earlier (%) - Hispanic or Latino
Year householder moved into unit - Moved in 1969 or earlier (%) - American Indian and Alaska Native
Year householder moved into unit - Moved in 1969 or earlier (%) - Multirace
Year householder moved into unit - Moved in 1969 or earlier (%) - Other Race
Housing units lacking complete plumbing facilities (%)
Housing units lacking complete kitchen facilities (%)
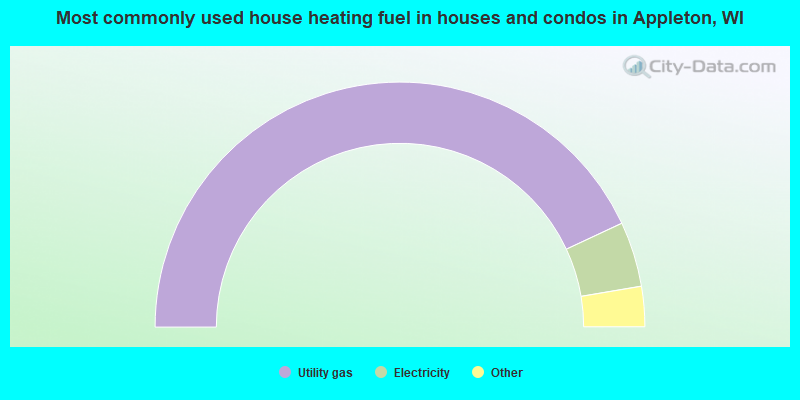
House heating fuel used in houses and condos - Utility gas (%)
House heating fuel used in houses and condos - Bottled, tank, or LP gas (%)
House heating fuel used in houses and condos - Electricity (%)
House heating fuel used in houses and condos - Fuel oil, kerosene, etc. (%)
House heating fuel used in houses and condos - Coal or coke (%)
House heating fuel used in houses and condos - Wood (%)
House heating fuel used in houses and condos - Solar energy (%)
House heating fuel used in houses and condos - Other fuel (%)
House heating fuel used in houses and condos - No fuel used (%)
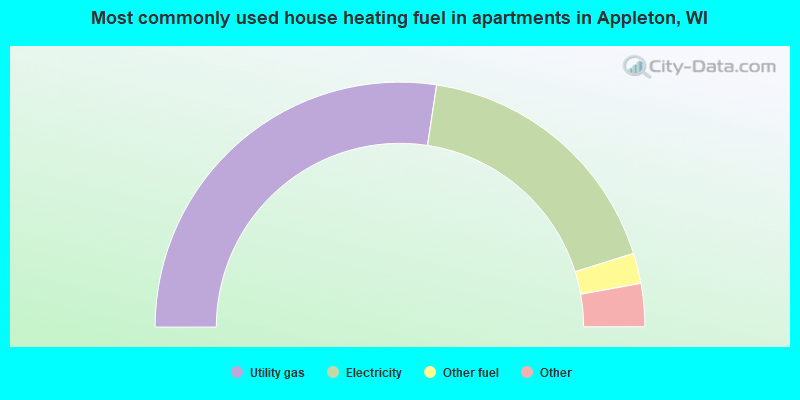
House heating fuel used in apartments - Utility gas (%)
House heating fuel used in apartments - Bottled, tank, or LP gas (%)
House heating fuel used in apartments - Electricity (%)
House heating fuel used in apartments - Fuel oil, kerosene, etc. (%)
House heating fuel used in apartments - Coal or coke (%)
House heating fuel used in apartments - Wood (%)
House heating fuel used in apartments - Solar energy (%)
House heating fuel used in apartments - Other fuel (%)
House heating fuel used in apartments - No fuel used (%)
Latest news about housing in Appleton, WI collected exclusively by city-data.com from local newspapers, TV, and radio stations
Median year house/condo built: 1972Median year apartment built: 1970Household type by relationship:
Households: 75,018
Male householders: 17,312 (5,634 living alone ), Female householders: 15,792 (5,897 living alone )14,701 spouses (14,409 opposite-sex spouses ), 3,170 unmarried partners , (3,053 opposite-sex unmarried partners ), 18,706 children (17,261 natural , 876 adopted , 569 stepchildren ), 465 grandchildren , 322 brothers or sisters , 359 parents , 64 foster children , 538 other relatives , 1,484 non-relatives In group quarters: 2,105
Size of family households: 9,709 2-persons , 3,471 3-persons , 2,509 4-persons , 2,143 5-persons , 600 6-persons , 148 7-or-more-persons .
Size of nonfamily households: 11,531 1-person , 2,732 2-persons , 69 3-persons , 192 4-persons .
10,500 married couples with children. single-parent households (1,035 men , 1,611 women ).
89.2% of residents of Appleton speak English at home. of residents speak Spanish at home (64% speak English very well , 13% speak English well , 21% speak English not well , 2% don't speak English at all ).of residents speak other Indo-European language at home (88% speak English very well , 7% speak English well , 4% speak English not well ).of residents speak Asian or Pacific Island language at home (50% speak English very well , 33% speak English well , 15% speak English not well , 2% don't speak English at all ).of residents speak other language at home (25% speak English very well , 8% speak English well , 59% speak English not well , 8% don't speak English at all ).
Foreign born population: 4,136 (5.5%)of them are naturalized citizens )
Median number of rooms in houses and condos:
Median number of rooms in apartments
Owner-occupied Renter-occupied
Rooms in owner-occupied houses in Appleton, Wisconsin
0 1 room 84 2 rooms 161 3 rooms 973 4 rooms 4,468 5 rooms 4,718 6 rooms 4,205 7 rooms 3,142 8 rooms 3,873 9+ rooms
Rooms in renter-occupied apartments in Appleton, Wisconsin
282 1 room 556 2 rooms 2,227 3 rooms 4,390 4 rooms 2,186 5 rooms 686 6 rooms 748 7 rooms 185 8 rooms 220 9+ rooms
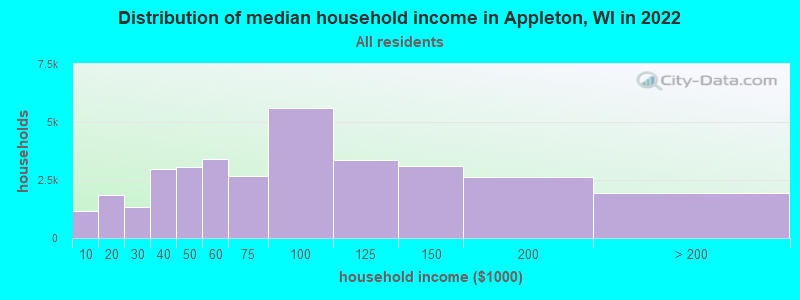
Appleton, WI household income distribution 1,169 Less than $10,0001,832 $10,000 to $19,9991,353 $20,000 to $29,9992,988 $30,000 to $39,9993,040 $40,000 to $49,9993,399 $50,000 to $59,9992,669 $60,000 to $74,9995,598 $75,000 to $99,9993,350 $100,000 to $124,9993,121 $125,000 to $149,9992,629 $150,000 to $199,9991,956 $200,000 or more
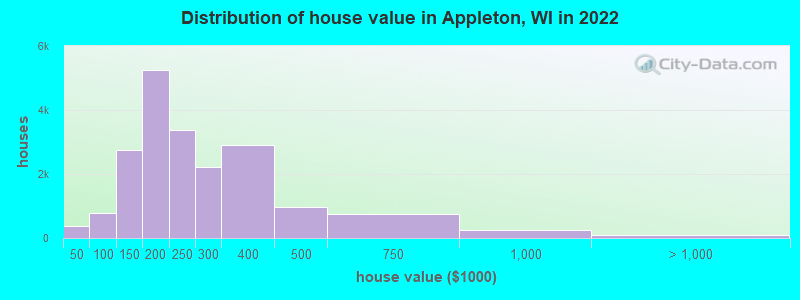
Home value of owner - occupied houses in 2022 in Appleton, WI 151 Less than $10,00093 $10,000 to $14,99959 $15,000 to $19,99919 $20,000 to $24,99936 $25,000 to $29,9997 $30,000 to $34,9998 $35,000 to $39,99910 $40,000 to $49,99930 $60,000 to $69,999218 $70,000 to $79,999236 $80,000 to $89,999274 $90,000 to $99,9991,146 $100,000 to $124,9991,604 $125,000 to $149,9992,407 $150,000 to $174,9992,854 $175,000 to $199,9993,382 $200,000 to $249,9992,229 $250,000 to $299,9992,905 $300,000 to $399,999979 $400,000 to $499,999750 $500,000 to $749,999249 $750,000 to $999,99981 $1,000,000 to $1,499,99914 $1,500,000 to $1,999,9999 $2,000,000 or moreRent paid by renters in 2022 in Appleton, WI 282 $200 to $249288 $250 to $29968 $300 to $349182 $400 to $449518 $500 to $549373 $550 to $5991,260 $600 to $649809 $650 to $6991,018 $700 to $749713 $750 to $7991,254 $800 to $8991,488 $900 to $9991,221 $1,000 to $1,249925 $1,250 to $1,499444 $1,500 to $1,999124 $3,000 to $3,499414 $3,500 or more99 No cash rent
Percentage of workers working in this county: 65.9%Number of people working at home: 6,141 (14.8% of all workers )
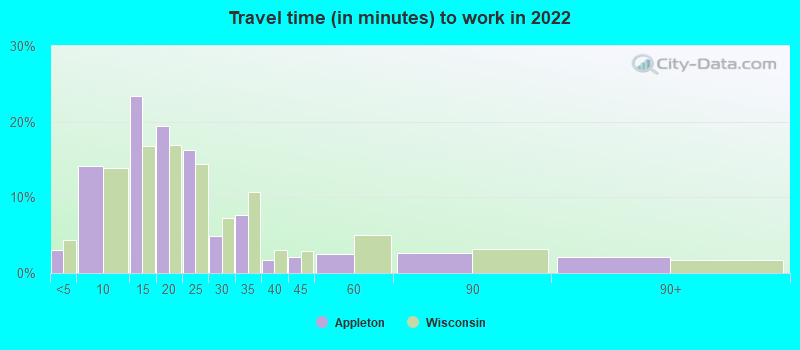
Travel time to work (commute)
Less than 5 minutes: 1,0025 to 9 minutes: 5,37410 to 14 minutes: 9,10315 to 19 minutes: 7,43820 to 24 minutes: 4,98625 to 29 minutes: 1,92630 to 34 minutes: 2,63335 to 39 minutes: 91140 to 44 minutes: 50745 to 59 minutes: 50660 to 89 minutes: 59590 or more minutes: 400
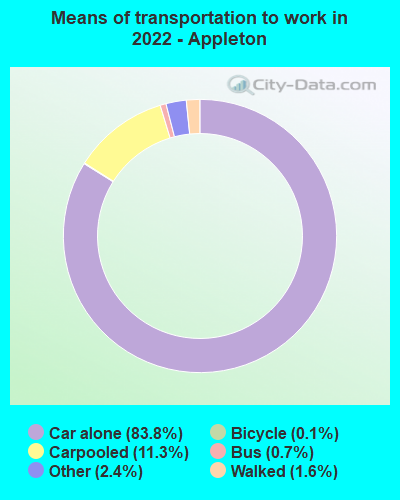
Means of transportation to work:
Drove a car alone: 31,434 (72.0%)Carpooled: 4,224 (9.7%)Bus : 274 (0.6%)Taxi: 900 (2.1%)Bicycle: 50 (0.1%)Walked: 610 (1.4%)Worked at home: 6,141 (14.1%)
Unemployment by race in 2022
Unemployment rate for White non-Hispanic residents 3.9% Males0.9% FemalesUnemployment rate for Black residents 23.6% Males6.8% FemalesUnemployment rate for American Indian and Alaska Native residents 12.7% MalesUnemployment rate for Asian residents 5.0% Males1.7% FemalesUnemployment rate for other race residents 5.8% FemalesUnemployment rate for two or more race residents 3.2% Males1.8% FemalesUnemployment rate for Hispanic or Latino residents 3.8% Males4.0% Females
Year of entry for the foreign-born population in Appleton, Wisconsin
1,717 2010 or later 1,056 2000 to 2009 914 1990 to 1999 852 1980 to 1989 539 1970 to 1979 376 Before 1970
First ancestries reported:
German: 11,778 (34.9%)
American: 2,125 (6.3%)
Polish: 1,701 (5.0%)
Irish: 1,149 (3.4%)
English: 1,146 (3.4%)
European: 1,117 (3.3%)
Dutch: 674 (2.0%)
Norwegian: 553 (1.6%)
Italian: 355 (1.1%)
Scandinavian: 354 (1.0%)
Swedish: 212 (0.6%)
Czech: 193 (0.6%)
Belgian: 166 (0.5%)
Eastern European: 152 (0.5%)
French: 134 (0.4%)
French Canadian: 118 (0.3%)
Scottish: 117 (0.3%)
Croatian: 115 (0.3%)
Finnish: 88 (0.3%)
Scotch-Irish: 85 (0.3%)
Greek: 70 (0.2%)
Danish: 58 (0.2%)
Canadian: 57 (0.2%)
Ukrainian: 57 (0.2%)
Ethiopian: 40 (0.1%)
Northern European: 35 (0.1%)
Hungarian: 34 (0.1%)
British: 32 (0.09%)
Turkish: 26 (0.08%)
Austrian: 25 (0.07%)
Russian: 25 (0.07%)
Jamaican: 24 (0.07%)
Welsh: 19 (0.06%)
Swiss: 17 (0.05%)
Luxembourger: 16 (0.05%)
Lithuanian: 14 (0.04%)
Czechoslovakian: 12 (0.04%)
Nigerian: 12 (0.04%)
Latvian: 8 (0.02%)
Portuguese: 8 (0.02%)
Lebanese: 6 (0.02%)
Liberian: 4 (0.01%)
Haitian: 3 (0.01%)
Serbian: 2 (0.01%) Most common places of birth for foreign-born residents (%): Thailand Appleton:
13.8% (676)Wisconsin:
3.3% (9,655)
Mexico Appleton:
13.5% (663)Wisconsin:
29.5% (87,182)
Laos Appleton:
12.1% (592)Wisconsin:
4.3% (12,681)
India Appleton:
7.3% (360)Wisconsin:
8.0% (23,594)
Philippines Appleton:
6.7% (330)Wisconsin:
3.1% (9,280)
Other Eastern Africa Appleton:
4.5% (219)Wisconsin:
0.1% (294)
Canada Appleton:
4.1% (199)Wisconsin:
2.3% (6,747)
China, excluding Hong Kong and Taiwan Appleton:
3.2% (155)Wisconsin:
5.1% (15,165)
Vietnam Appleton:
2.9% (143)Wisconsin:
1.5% (4,400)
Democratic Republic of Congo (Zaire) Appleton:
2.7% (131)Wisconsin:
0.3% (808)
Korea Appleton:
2.4% (120)Wisconsin:
1.8% (5,320)
Hong Kong Appleton:
2.1% (105)Wisconsin:
0.2% (645)
England Appleton:
2.1% (101)Wisconsin:
0.8% (2,478)
Nepal Appleton:
2.1% (101)Wisconsin:
0.4% (1,187)
Germany Appleton:
1.8% (87)Wisconsin:
3.0% (8,773)
Guatemala Appleton:
1.6% (80)Wisconsin:
1.0% (2,903)
Place of birth for U.S.-born residents:
This state: 52,602Other state: 17,858Northeast: 2,332Midwest: 9,402South: 2,806West: 3,318 87.2% of Appleton residents lived in the same house 1 years ago.
Out of people who lived in different houses, 27.8% lived in this county.
Out of people who lived in different counties, 67.7% lived in Wisconsin.
Appleton:
87.2%State average:
87.7%
Education attainment for males 25 years and older:
No schooling: 180Nursery to 4th grade: 575th and 6th grade: 07th and 8th grade: 3049th grade: 8610th grade: 11711th grade: 20212th grade, no diploma: 409High school graduate (or equivalency): 6,805Less than 1 year of college: 1,198Some college more than 1 year, no degree: 3,699Associate degree: 2,638Bachelor's degree: 7,603Master's degree: 2,183Professional school degree: 861Doctorate degree: 359
Education attainment for females 25 years and older:
No schooling: 142Nursery to 4th grade: 335th and 6th grade: 1157th and 8th grade: 1699th grade: 18310th grade: 011th grade: 19512th grade, no diploma: 212High school graduate (or equivalency): 6,266Less than 1 year of college: 1,530Some college more than 1 year, no degree: 2,900Associate degree: 3,309Bachelor's degree: 8,618Master's degree: 2,886Professional school degree: 499Doctorate degree: 260
Housing units in structures:
One, detached: 22,952One, attached: 2,052Two: 1,5963 or 4: 1,0045 to 9: 1,33210 to 19: 1,34120 to 49: 1,55550 or more: 1,700Mobile homes: 101Housing units lacking complete plumbing facilities in 2022: 0.6%Housing units lacking complete kitchen facilities in 2022: 0.8%House/condo owner moved in on average 11 years ago
Renter moved in on average 3 years ago
Private vs. public school enrollment:
Students in private schools in grades 1 to 8 (elementary and middle school): 1,188 Here:
19.7%Wisconsin:
16.7%
Students in private schools in grades 9 to 12 (high school): 312 Students in private undergraduate colleges: 1,370 Here:
37.6%Wisconsin:
17.5%