Arlington Heights, IL (Illinois) Houses and Residents
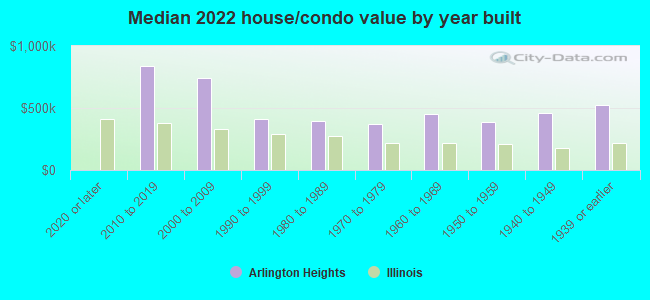
| Arlington Heights: | $426,300 |
| Illinois: | $251,600 |
Mean price in 2022:
Detached houses: $505,387
Here: $505,387 State: $310,164 Townhouses or other attached units: $339,986
Here: $339,986 State: $286,230 In 3-to-4-unit structures: $343,092
Here: $343,092 State: $330,907 In 5-or-more-unit structures: $180,325
Here: $180,325 State: $318,887
Total population: 76,024 (All urban)
Houses: 32,213 (30,267 occupied: 21,705 owner occupied, 8,562 renter occupied)
| % of renters here: | 28% |
| State: | 33% |
Housing density: 1,963 houses/condos per square mile
Median price asked for vacant for-sale houses and condos in 2022: $173,855.
Median contract rent in 2022: $1,423 (lower quartile is $1,150, upper quartile is $1,824)
Median rent asked for vacant for-rent units in 2022: $1,999
Median gross rent in Arlington Heights, IL in 2022: $1,592
Housing units in Arlington Heights with a mortgage: 13,639 (900 second mortgage, 0 home equity loan, 809 both second mortgage and home equity loan)
Houses without a mortgage: 297
Median household income for houses/condos with a mortgage: $169,625
Median household income for apartments without a mortgage: $116,641
Median monthly housing costs: $1,670
Compare current foreclosures in Arlington Heights, IL:
| Photo | Address | Area | Beds / Baths | Price | Details |
|---|---|---|---|---|---|

|
#1
Carriage Way Dr
Arlington Heights, IL 60004
|
- sq. feet
|
2 baths 2 beds |
$179,900
|
show details |

|
#2
N Harvard Ave
Arlington Heights, IL 60004
|
1,614 sq. feet
|
2 baths 4 beds |
show details | |

|
#3
S Prindle Ave
Arlington Heights, IL 60004
|
1,160 sq. feet
|
1 baths - beds |
show details | |

|
#4
W White Oak St
Arlington Heights, IL 60005
|
1,125 sq. feet
|
1 baths - beds |
show details | |

|
#5
N Derbyshire Ave
Arlington Heights, IL 60004
|
2,194 sq. feet
|
2 baths - beds |
show details | |

|
#6
E Kensington Rd
Arlington Heights, IL 60004
|
1,119 sq. feet
|
1 baths - beds |
show details | |

|
#7
N Stratford Rd
Arlington Heights, IL 60004
|
1,248 sq. feet
|
1 baths - beds |
show details | |

|
#8
S Vail Ave
Arlington Heights, IL 60005
|
2,149 sq. feet
|
2 baths - beds |
show details | |

|
#9
N Douglas Ave
Arlington Heights, IL 60004
|
1,756 sq. feet
|
2 baths - beds |
show details | |

|
#10
S Vail Ave
Arlington Heights, IL 60005
|
1,215 sq. feet
|
1 baths - beds |
show details |
| Photo | Address | Area | Beds / Baths | Price | Details |
|---|---|---|---|---|---|

|
#11
N Galesburg Ct
Arlington Heights, IL 60004
|
1,328 sq. feet
|
1 baths - beds |
show details | |

|
#12
S Vail Ave
Arlington Heights, IL 60005
|
1,110 sq. feet
|
1 baths - beds |
show details | |

|
#13
N Beverly Ln
Arlington Heights, IL 60004
|
1,188 sq. feet
|
1 baths - beds |
show details | |

|
#14
N Harvard Ave
Arlington Heights, IL 60004
|
2,698 sq. feet
|
2 baths - beds |
show details | |

|
#15
N Kennicott Ave
Arlington Heights, IL 60005
|
1,152 sq. feet
|
1 baths - beds |
show details | |

|
#16
S Chestnut Ave
Arlington Heights, IL 60005
|
1,161 sq. feet
|
1 baths - beds |
show details | |

|
#17
S Goebbert Rd
Arlington Heights, IL 60005
|
2,387 sq. feet
|
2 baths - beds |
show details | |

|
#18
E Canterbury Dr
Arlington Heights, IL 60004
|
1,982 sq. feet
|
3 baths - beds |
show details | |

|
#19
W Richmond St
Arlington Heights, IL 60004
|
1,155 sq. feet
|
1 baths - beds |
show details | |

|
#20
N Windsor Dr
Arlington Heights, IL 60004
|
1,013 sq. feet
|
1 baths - beds |
show details |
| Photo | Address | Area | Beds / Baths | Price | Details |
|---|---|---|---|---|---|

|
#21
N Wilshire Ave
Arlington Heights, IL 60004
|
1,844 sq. feet
|
1 baths - beds |
show details | |

|
#22
E Central Rd Apt 116
Arlington Heights, IL 60005
|
- sq. feet
|
- baths - beds |
show details | |

|
#23
N Wilke Rd # 410
Arlington Heights, IL 60004
|
- sq. feet
|
- baths - beds |
show details | |

|
#24
S Mckinley Ave Apt 3a
Arlington Heights, IL 60005
|
- sq. feet
|
- baths - beds |
show details | |

|
#25
Euclid Ave
Arlington Heights, IL 60004
|
- sq. feet
|
- baths - beds |
show details | |

|
#26
W Woods Dr Apt 1610
Arlington Heights, IL 60004
|
- sq. feet
|
- baths - beds |
show details | |

|
#27
S Goebbert Rd Unit 102
Arlington Heights, IL 60005
|
- sq. feet
|
- baths - beds |
show details | |

|
#28
S Mckinley Ave
Arlington Heights, IL 60005
|
- sq. feet
|
- baths - beds |
show details | |

|
#29
6th Ave
Arlington Heights, IL 60005
|
- sq. feet
|
- baths - beds |
show details | |

|
#30
E Hintz Rd
Arlington Heights, IL 60004
|
- sq. feet
|
- baths - beds |
show details |
| Photo | Address | Area | Beds / Baths | Price | Details |
|---|---|---|---|---|---|

|
#31
N Heritage Ln
Arlington Heights, IL 60004
|
- sq. feet
|
- baths - beds |
show details | |

|
#32
S Arlington Heights Rd
Arlington Heights, IL 60005
|
- sq. feet
|
- baths - beds |
show details | |

|
#33
E Golf Rd Apt 1
Arlington Heights, IL 60005
|
- sq. feet
|
- baths - beds |
show details | |

|
#34
N Dunton Ave Apt 621
Arlington Heights, IL 60004
|
- sq. feet
|
- baths - beds |
show details | |

|
#35
S Evergreen Ave
Arlington Heights, IL 60005
|
- sq. feet
|
- baths - beds |
show details | |

|
#36
E Oakton St Ste C1
Arlington Heights, IL 60005
|
- sq. feet
|
- baths - beds |
show details | |

|
#37
4th Ave
Arlington Heights, IL 60005
|
- sq. feet
|
- baths - beds |
show details | |

|
#38
Nichols Rd Apt B
Arlington Heights, IL 60004
|
- sq. feet
|
- baths - beds |
show details | |

|
#39
N Arlington Heights Rd
Arlington Heights, IL 60004
|
- sq. feet
|
- baths - beds |
show details | |

|
#40
N Windsor Dr
Arlington Heights, IL 60004
|
- sq. feet
|
- baths - beds |
show details |
| Photo | Address | Area | Beds / Baths | Price | Details |
|---|---|---|---|---|---|

|
#41
S Goebbert Rd Apt 1033
Arlington Heights, IL 60005
|
- sq. feet
|
- baths - beds |
show details | |

|
#42
E Seegers Rd Apt 134
Arlington Heights, IL 60005
|
- sq. feet
|
- baths - beds |
show details | |

|
#43
S Goebbert Rd Apt 119
Arlington Heights, IL 60005
|
- sq. feet
|
- baths - beds |
show details | |

|
#44
E Algonquin Rd Apt 15
Arlington Heights, IL 60005
|
- sq. feet
|
- baths - beds |
show details | |

|
#45
E Northwest Hwy # W
Arlington Heights, IL 60004
|
- sq. feet
|
- baths - beds |
show details | |

|
#46
E Falcon Dr Unit 209
Arlington Heights, IL 60005
|
- sq. feet
|
- baths - beds |
show details | |

|
#47
S Fernandez Ave
Arlington Heights, IL 60005
|
- sq. feet
|
- baths - beds |
show details | |

|
#48
E Brandenberry Ct Apt 20
Arlington Heights, IL 60004
|
- sq. feet
|
- baths - beds |
show details | |

|
#49
N Kennicott Ave
Arlington Heights, IL 60004
|
- sq. feet
|
- baths - beds |
show details | |

|
Check over 1 million property listings on Foreclosure.com!
|
browse all offers | |||


Median year apartment built: 1979
Household type by relationship:
Households: 74,207- Male householders: 16,886 (3,141 living alone), Female householders: 13,381 (5,626 living alone)
16,361 spouses (16,361 opposite-sex spouses), 1,834 unmarried partners, (1,585 opposite-sex unmarried partners), 21,540 children (21,423 natural, 31 adopted, 86 stepchildren), 660 grandchildren, 705 brothers or sisters, 603 parents, 0 foster children, 284 other relatives, 1,069 non-relatives
- In group quarters: 884
Size of family households: 8,884 2-persons, 3,484 3-persons, 5,142 4-persons, 2,005 5-persons, 363 6-persons.
Size of nonfamily households: 8,767 1-person, 1,622 2-persons.
12,998 married couples with children.
2,578 single-parent households (455 men, 2,123 women).
71.3% of residents of Arlington Heights speak English at home.
5.6% of residents speak Spanish at home (71% speak English very well, 18% speak English well, 7% speak English not well, 5% don't speak English at all).
16.5% of residents speak other Indo-European language at home (68% speak English very well, 22% speak English well, 8% speak English not well, 2% don't speak English at all).
5.9% of residents speak Asian or Pacific Island language at home (62% speak English very well, 23% speak English well, 13% speak English not well, 3% don't speak English at all).
1.1% of residents speak other language at home (62% speak English very well, 19% speak English well, 9% speak English not well, 9% don't speak English at all).
Foreign born population: 15,862 (21.4%)
(54.0% of them are naturalized citizens)
| Here: | 7.2 |
| State: | 6.4 |
| Here: | 3.6 |
| State: | 4.1 |
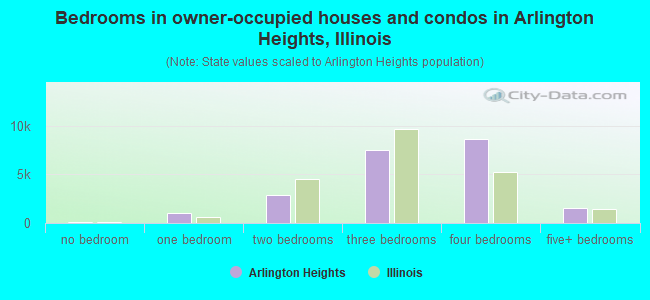
- Bedrooms in owner-occupied houses and condos in Arlington Heights, Illinois
- 105no bedroom
- 1,0691 bedroom
- 2,8652 bedrooms
- 7,5033 bedrooms
- 8,6354 bedrooms
- 1,5285+ bedrooms
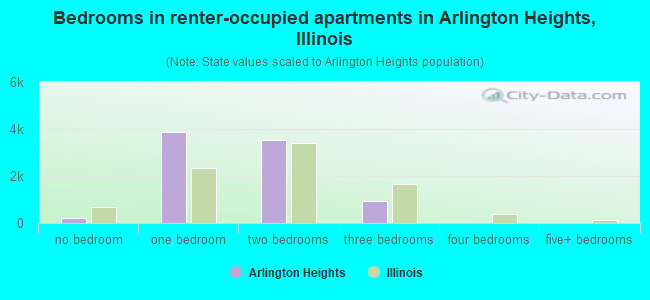
- Bedrooms in renter-occupied apartments in Arlington Heights, Illinois
- 231no bedroom
- 3,8891 bedroom
- 3,5152 bedrooms
- 9273 bedrooms
- 04 bedrooms
- 05+ bedrooms
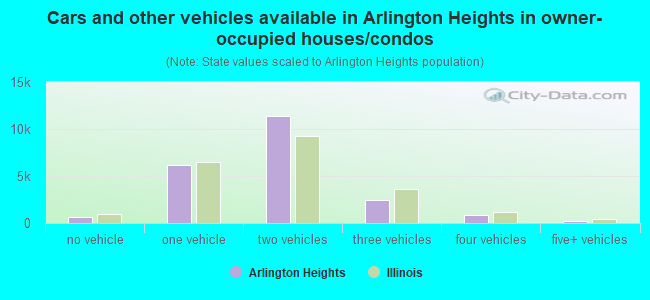
- Cars and other vehicles available in Arlington Heights in owner-occupied houses/condos
- 613no vehicle
- 6,1361 vehicle
- 11,4282 vehicles
- 2,4323 vehicles
- 8404 vehicles
- 2565+ vehicles
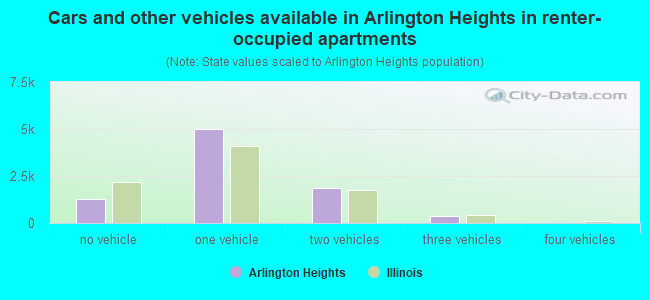
- Cars and other vehicles available in Arlington Heights in renter-occupied apartments
- 1,279no vehicle
- 5,0261 vehicle
- 1,8772 vehicles
- 3803 vehicles
- 04 vehicles
- 05+ vehicles
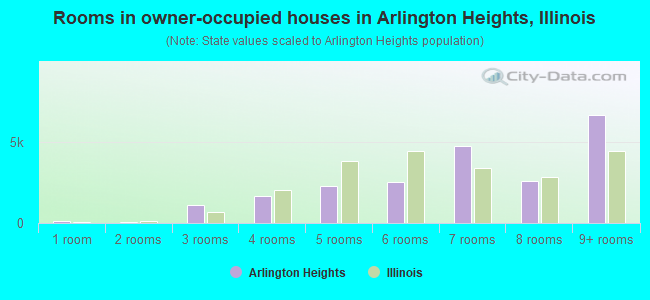
- Rooms in owner-occupied houses in Arlington Heights, Illinois
- 1051 room
- 842 rooms
- 1,0863 rooms
- 1,6594 rooms
- 2,2945 rooms
- 2,5346 rooms
- 4,7327 rooms
- 2,5748 rooms
- 6,6379+ rooms
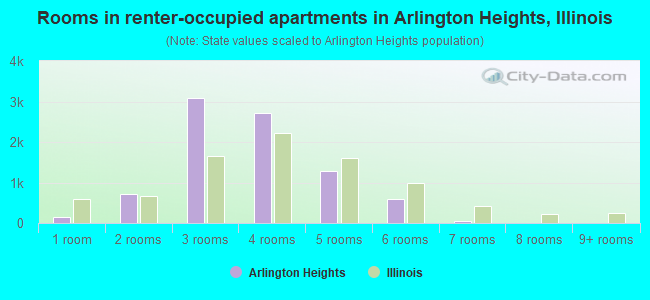
- Rooms in renter-occupied apartments in Arlington Heights, Illinois
- 1511 room
- 7072 rooms
- 3,0763 rooms
- 2,7084 rooms
- 1,2835 rooms
- 5906 rooms
- 477 rooms
- 08 rooms
- 09+ rooms
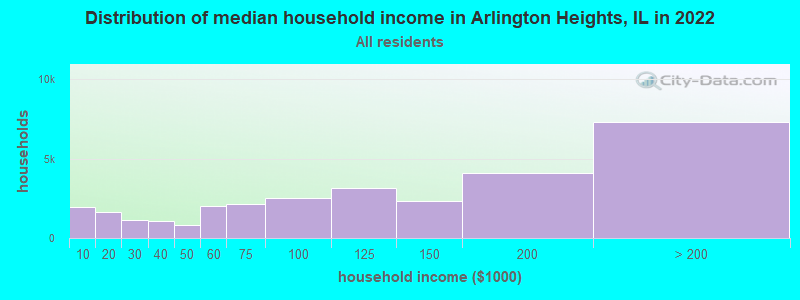
Arlington Heights, IL household income distribution

- 1,950Less than $10,000
- 1,640$10,000 to $19,999
- 1,132$20,000 to $29,999
- 1,102$30,000 to $39,999
- 795$40,000 to $49,999
- 2,041$50,000 to $59,999
- 2,147$60,000 to $74,999
- 2,545$75,000 to $99,999
- 3,166$100,000 to $124,999
- 2,339$125,000 to $149,999
- 4,097$150,000 to $199,999
- 7,313$200,000 or more
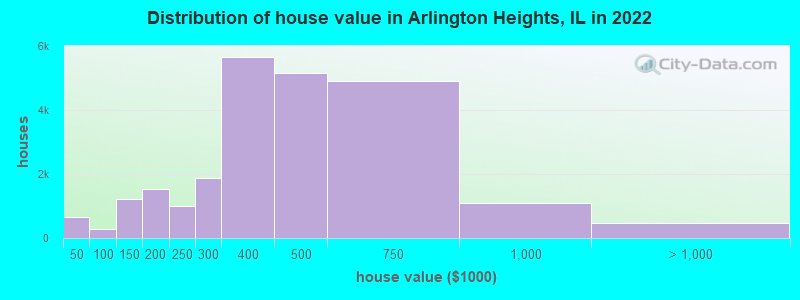
Home value of owner - occupied houses in 2022 in Arlington Heights, IL
-
- 135Less than $10,000
- 54$10,000 to $14,999
- 38$15,000 to $19,999
- 69$20,000 to $24,999
- 135$25,000 to $29,999
- 7$30,000 to $34,999
- 186$35,000 to $39,999
- 15$40,000 to $49,999
- 19$50,000 to $59,999
- 10$60,000 to $69,999
- 55$70,000 to $79,999
- 52$80,000 to $89,999
- 127$90,000 to $99,999
- 598$100,000 to $124,999
- 620$125,000 to $149,999
- 748$150,000 to $174,999
- 772$175,000 to $199,999
- 1,014$200,000 to $249,999
- 1,888$250,000 to $299,999
- 5,662$300,000 to $399,999
- 5,152$400,000 to $499,999
- 4,905$500,000 to $749,999
- 1,104$750,000 to $999,999
- 305$1,000,000 to $1,499,999
- 39$1,500,000 to $1,999,999
- 111$2,000,000 or more
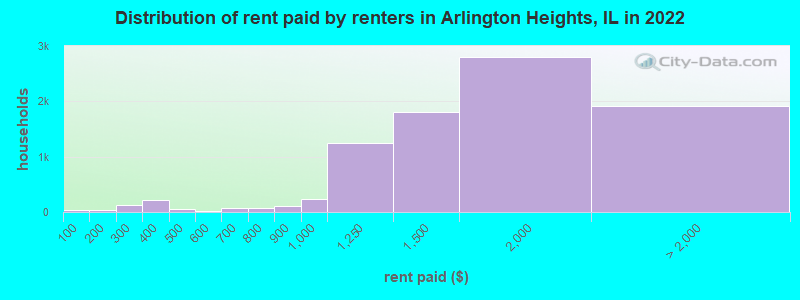
Rent paid by renters in 2022 in Arlington Heights, IL
-
- 34Less than $100
- 41$150 to $199
- 107$200 to $249
- 17$250 to $299
- 96$300 to $349
- 124$350 to $399
- 27$400 to $449
- 20$450 to $499
- 14$550 to $599
- 59$600 to $649
- 19$650 to $699
- 26$700 to $749
- 47$750 to $799
- 108$800 to $899
- 241$900 to $999
- 1,251$1,000 to $1,249
- 1,810$1,250 to $1,499
- 2,800$1,500 to $1,999
- 933$2,000 to $2,499
- 430$2,500 to $2,999
- 81$3,000 to $3,499
- 225$3,500 or more
- 244No cash rent
Percentage of workers working in this county: 83.3%
Number of people working at home: 10,208 (26.0% of all workers)
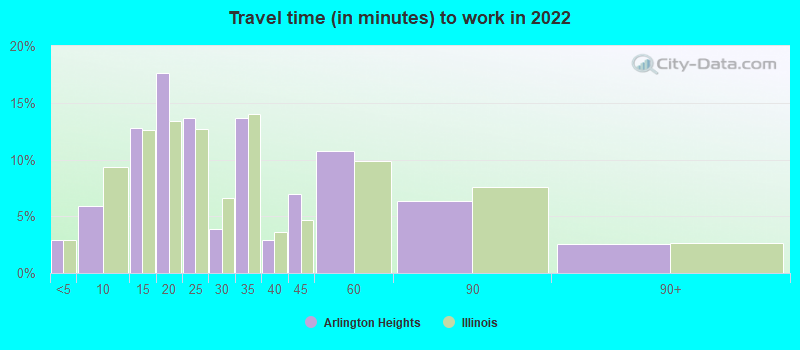
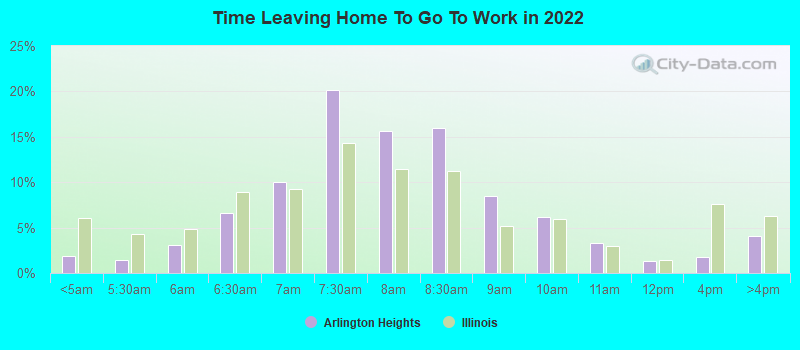
Travel time to work (commute)
- Less than 5 minutes: 394
- 5 to 9 minutes: 1,626
- 10 to 14 minutes: 3,351
- 15 to 19 minutes: 3,484
- 20 to 24 minutes: 4,744
- 25 to 29 minutes: 1,853
- 30 to 34 minutes: 3,613
- 35 to 39 minutes: 1,279
- 40 to 44 minutes: 1,608
- 45 to 59 minutes: 1,962
- 60 to 89 minutes: 2,706
- 90 or more minutes: 439
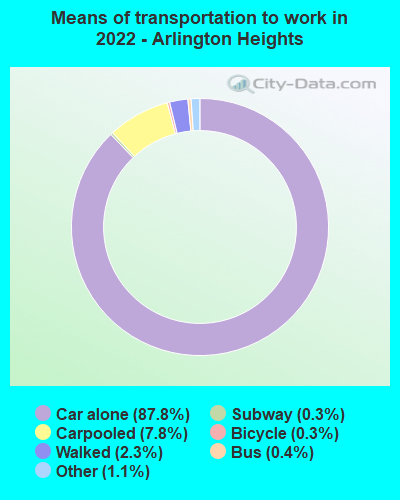
Means of transportation to work:
- Drove a car alone: 27,366 (69.0%)
- Carpooled: 2,612 (6.6%)
- Bus: 103 (0.3%)
- Subway or elevated rail: 2 (0.0%)
- Long-distance train or commuter rail: 56 (0.1%)
- Light rail, streetcar or trolley: 16 (0.0%)
- Taxi: 337 (0.8%)
- Bicycle: 87 (0.2%)
- Walked: 754 (1.9%)
- Worked at home: 10,208 (25.7%)
- Unemployment by race in 2022
- Unemployment rate for White non-Hispanic residents
- 3.7%Males
- 1.7%Females
- Unemployment rate for Black residents
- 5.4%Males
- 1.2%Females
- Unemployment rate for American Indian and Alaska Native residents
- 8.7%Females
- Unemployment rate for Asian residents
- 2.6%Males
- 0.7%Females
- Unemployment rate for two or more race residents
- 5.4%Males
- Unemployment rate for Hispanic or Latino residents
- 4.0%Males
- 0.3%Females
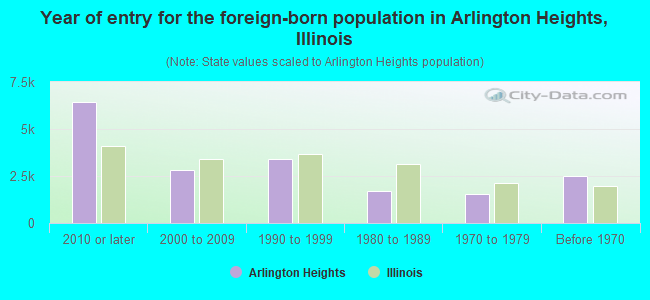
- Year of entry for the foreign-born population in Arlington Heights, Illinois
- 6,4362010 or later
- 2,8112000 to 2009
- 3,3831990 to 1999
- 1,7131980 to 1989
- 1,5351970 to 1979
- 2,526Before 1970
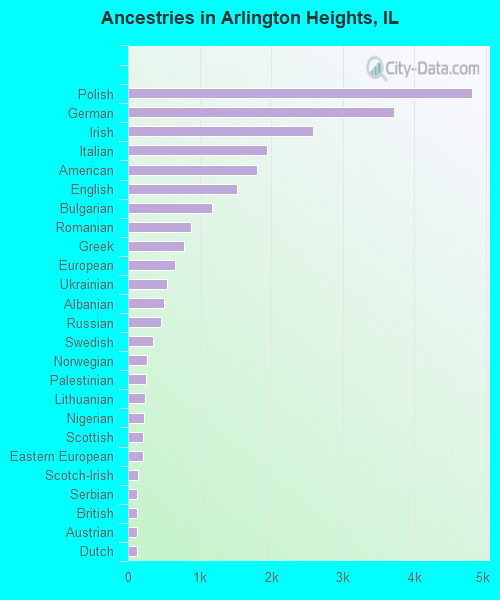
First ancestries reported:
- Polish: 4,801 (13.0%)
- German: 3,714 (10.1%)
- Irish: 2,582 (7.0%)
- Italian: 1,938 (5.3%)
- American: 1,798 (4.9%)
- English: 1,520 (4.1%)
- Bulgarian: 1,171 (3.2%)
- Romanian: 876 (2.4%)
- Greek: 786 (2.1%)
- European: 656 (1.8%)
- Ukrainian: 544 (1.5%)
- Albanian: 503 (1.4%)
- Russian: 466 (1.3%)
- Swedish: 346 (0.9%)
- Norwegian: 267 (0.7%)
- Palestinian: 250 (0.7%)
- Lithuanian: 243 (0.7%)
- Nigerian: 226 (0.6%)
- Scottish: 214 (0.6%)
- Eastern European: 212 (0.6%)
- Scotch-Irish: 140 (0.4%)
- Serbian: 124 (0.3%)
- British: 123 (0.3%)
- Austrian: 120 (0.3%)
- Dutch: 120 (0.3%)
- Northern European: 105 (0.3%)
- Croatian: 104 (0.3%)
- Assyrian: 96 (0.3%)
- Canadian: 96 (0.3%)
- Scandinavian: 94 (0.3%)
- Egyptian: 93 (0.3%)
- Czech: 79 (0.2%)
- Turkish: 74 (0.2%)
- Hungarian: 70 (0.2%)
- Luxembourger: 61 (0.2%)
- Belgian: 59 (0.2%)
- Slavic: 59 (0.2%)
- Iranian: 59 (0.2%)
- Slovak: 57 (0.2%)
- Moroccan: 52 (0.1%)
- French: 43 (0.1%)
- African: 38 (0.1%)
- Armenian: 36 (0.10%)
- Portuguese: 27 (0.07%)
- Danish: 26 (0.07%)
- Welsh: 24 (0.07%)
- Yugoslavian: 24 (0.07%)
- Macedonian: 16 (0.04%)
- Brazilian: 14 (0.04%)
- Haitian: 11 (0.03%)
- Arab: 10 (0.03%)
- Latvian: 9 (0.02%)
- Czechoslovakian: 8 (0.02%)
- French Canadian: 6 (0.02%)
- Israeli: 2 (0.01%)
Most common places of birth for foreign-born residents (%):
| Arlington Heights: | 17.2% (2,708) |
| Illinois: | 9.2% (166,409) |
| Arlington Heights: | 13.0% (2,047) |
| Illinois: | 6.9% (124,474) |
| Arlington Heights: | 7.8% (1,230) |
| Illinois: | 34.7% (626,958) |
| Arlington Heights: | 5.9% (934) |
| Illinois: | 0.8% (14,165) |
| Arlington Heights: | 5.0% (782) |
| Illinois: | 2.2% (40,393) |
| Arlington Heights: | 4.0% (635) |
| Illinois: | 5.2% (93,003) |
| Arlington Heights: | 3.9% (619) |
| Illinois: | 1.6% (29,316) |
| Arlington Heights: | 3.7% (582) |
| Illinois: | 0.6% (10,943) |
| Arlington Heights: | 3.0% (475) |
| Illinois: | 0.4% (6,488) |
| Arlington Heights: | 2.6% (409) |
| Illinois: | 0.3% (6,186) |
| Arlington Heights: | 2.4% (372) |
| Illinois: | 0.3% (4,938) |
| Arlington Heights: | 2.3% (359) |
| Illinois: | 0.9% (15,679) |
| Arlington Heights: | 1.9% (303) |
| Illinois: | 0.8% (14,736) |
| Arlington Heights: | 1.8% (285) |
| Illinois: | 4.1% (74,364) |
| Arlington Heights: | 1.7% (265) |
| Illinois: | 0.9% (16,308) |
Place of birth for U.S.-born residents:
- This state: 46,559
- Other state: 10,956
- Northeast: 2,808
- Midwest: 4,813
- South: 2,168
- West: 1,167
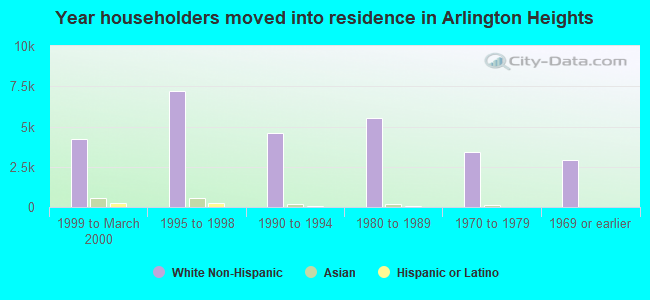
88.7% of Arlington Heights residents lived in the same house 1 years ago.
Out of people who lived in different houses, 41.9% lived in this county.
Out of people who lived in different counties, 42.8% lived in Illinois.
| Arlington Heights: | 88.7% |
| State average: | 88.3% |
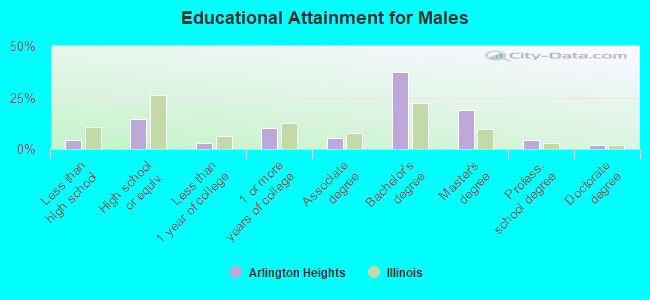
Education attainment for males 25 years and older:
- No schooling: 425
- Nursery to 4th grade: 0
- 5th and 6th grade: 0
- 7th and 8th grade: 47
- 9th grade: 83
- 10th grade: 0
- 11th grade: 60
- 12th grade, no diploma: 544
- High school graduate (or equivalency): 3,832
- Less than 1 year of college: 710
- Some college more than 1 year, no degree: 2,640
- Associate degree: 1,406
- Bachelor's degree: 9,800
- Master's degree: 4,918
- Professional school degree: 1,186
- Doctorate degree: 544
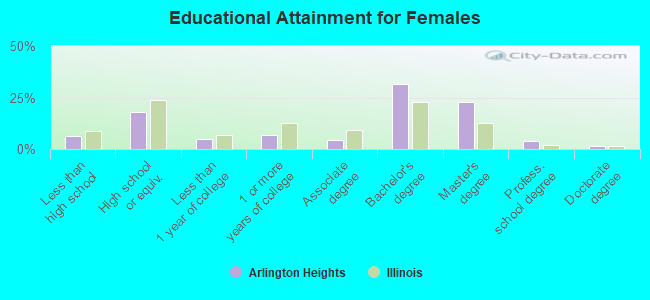
Education attainment for females 25 years and older:
- No schooling: 459
- Nursery to 4th grade: 48
- 5th and 6th grade: 102
- 7th and 8th grade: 462
- 9th grade: 45
- 10th grade: 85
- 11th grade: 10
- 12th grade, no diploma: 471
- High school graduate (or equivalency): 4,802
- Less than 1 year of college: 1,303
- Some college more than 1 year, no degree: 1,781
- Associate degree: 1,193
- Bachelor's degree: 8,502
- Master's degree: 6,169
- Professional school degree: 1,068
- Doctorate degree: 343
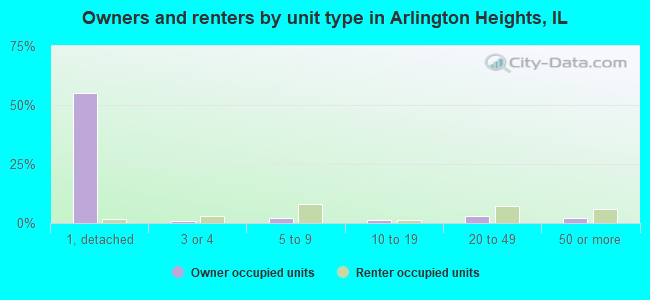
Housing units in structures:
- One, detached: 17,906
- One, attached: 2,459
- Two: 92
- 3 or 4: 1,201
- 5 to 9: 3,939
- 10 to 19: 706
- 20 to 49: 3,166
- 50 or more: 2,744
Housing units lacking complete kitchen facilities in 2022: 0.9%
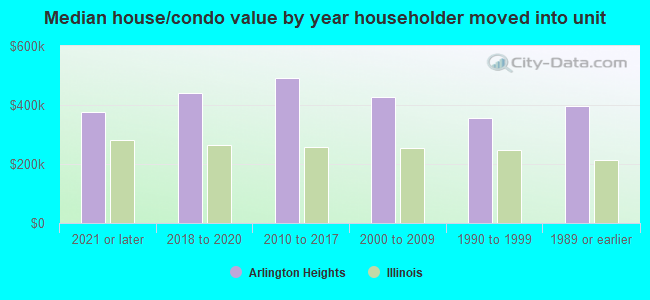
House/condo owner moved in on average 12 years ago
Renter moved in on average 1 years ago
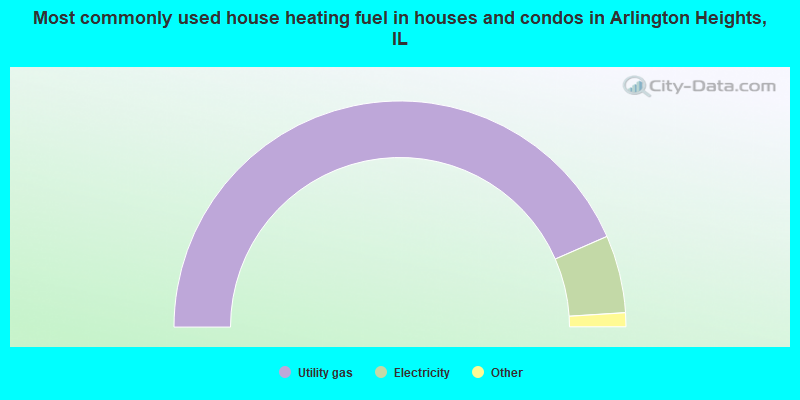
- 86.8%Utility gas
- 11.1%Electricity
- 1.1%Bottled, tank, or LP gas
- 0.5%No fuel used
- 0.2%Other fuel
- 0.1%Fuel oil, kerosene, etc.
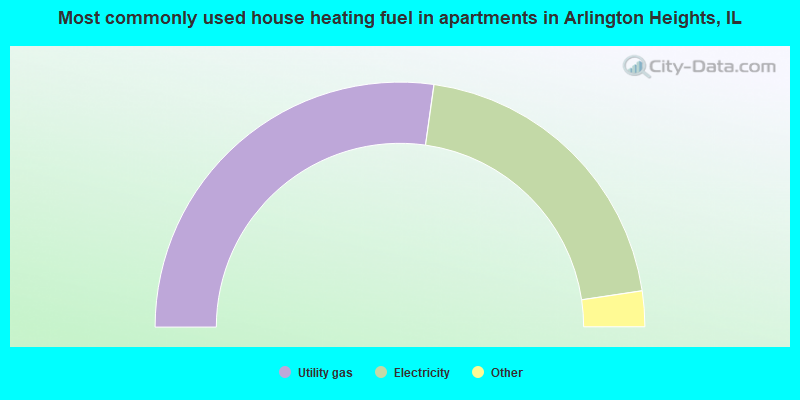
- 54.5%Utility gas
- 40.9%Electricity
- 2.3%Bottled, tank, or LP gas
- 1.3%No fuel used
- 1.1%Other fuel
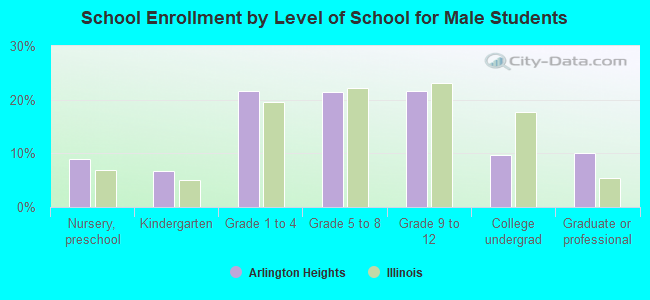
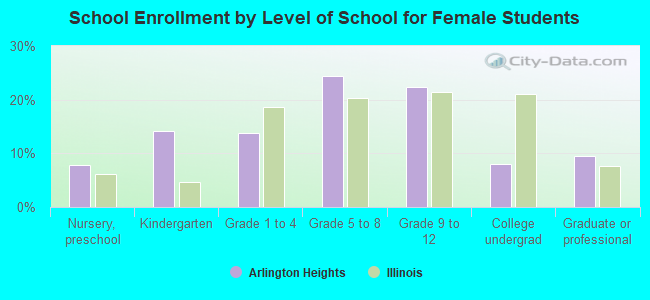
Private vs. public school enrollment:
| Here: | 13.9% |
| Illinois: | 13.3% |
| Here: | 4.4% |
| Illinois: | 9.9% |
| Here: | 18.7% |
| Illinois: | 27.4% |