Jump to a detailed profile or search site with Google Custom Search

Ashfield, MA (Massachusetts) Houses and Residents

Estimated median house or condo value in 2022: $357,616 (it was $143,900 in 2000)
Ashfield:

$357,616
Massachusetts:

$534,700
Lower value quartile - upper value quartile: $241,806 - $429,469

Total population: 1,737 (Urban population: 0, Rural population: 1,801 (48 farm, 1,753 nonfarm))

Houses: 821 (742 occupied: 577 owner occupied, 165 renter occupied)

% of renters here:

22%
State:

38%

Housing density: 20 houses/condos per square mile

Median price asked for vacant for-sale houses and condos in 2022 in this county: $191,319.

Median contract rent in 2022: $910 (lower quartile is $550, upper quartile is $1,221)


Median rent asked for vacant for-rent units in 2022: $871


Median gross rent in Ashfield, MA in 2022: $1,053

Housing units in Ashfield with a mortgage: 250 (20 second mortgage, 33 home equity loan, 0 both second mortgage and home equity loan)
Houses without a mortgage: 104

Compare current foreclosures near Ashfield, MA:

Check out more offers near Ashfield, MA.
Powered by Foreclosure.com


Latest news about housing in Ashfield, MA collected exclusively by city-data.com from local newspapers, TV, and radio stations

Ashfield, Massachusetts Age and Sex of Residents

Household type by relationship:

Households: 69,891
  • In family households: 54,236 (12,210 male householders, 6,107 female householders)
    13,655 spouses, 17,750 children (16,448 natural, 543 adopted, 759 stepchildren), 917 grandchildren, 418 brothers or sisters, 464 parents, foster children, 409 other relatives, 1,987 non-relatives
  • In nonfamily households: 15,655 (5,446 male householders (3,978 living alone)), 6,699 female householders (5,318 living alone)), 3,510 nonrelatives
  • In group quarters: 1,481 (665 institutionalized population)

11,122 married couples with children.
4,422 single-parent households (1,025 men, 3,397 women).

95.9% of residents of Ashfield speak English at home.
1.2% of residents speak Spanish at home (60% speak English very well, 30% speak English well, 10% speak English not well).
2.2% of residents speak other Indo-European language at home (86% speak English very well, 14% speak English well).
0.3% of residents speak Asian or Pacific Island language at home (100% speak English very well).
0.4% of residents speak other language at home (100% speak English very well).

Foreign born population: 82 (4.6%)
(41.5% of them are naturalized citizens)

Median number of rooms in houses and condos:
Here:

6.4
State:

6.5

Median number of rooms in apartments
Here:

4.0
State:

4.0

Owner-occupied Renter-occupied
Bedrooms in owner-occupied houses and condos in Ashfield, Massachusetts
  • Bedrooms in owner-occupied houses and condos in Ashfield, Massachusetts
  • 0no bedroom
  • 261 bedroom
  • 1352 bedrooms
  • 2473 bedrooms
  • 1194 bedrooms
  • 505+ bedrooms
Bedrooms in renter-occupied apartments in Ashfield, Massachusetts
  • Bedrooms in renter-occupied apartments in Ashfield, Massachusetts
  • 9no bedroom
  • 421 bedroom
  • 622 bedrooms
  • 273 bedrooms
  • 194 bedrooms
  • 65+ bedrooms
Owner-occupied Renter-occupied
Cars and other vehicles available in Ashfield in owner-occupied houses/condos
  • Cars and other vehicles available in Ashfield in owner-occupied houses/condos
  • 11no vehicle
  • 1361 vehicle
  • 2892 vehicles
  • 1203 vehicles
  • 214 vehicles
  • 05+ vehicles
Cars and other vehicles available in Ashfield in renter-occupied apartments
  • Cars and other vehicles available in Ashfield in renter-occupied apartments
  • 5no vehicle
  • 961 vehicle
  • 512 vehicles
  • 83 vehicles
  • 34 vehicles
  • 25+ vehicles
Owner-occupied Renter-occupied
Rooms in owner-occupied houses in Ashfield, Massachusetts
  • Rooms in owner-occupied houses in Ashfield, Massachusetts
  • 01 room
  • 52 rooms
  • 173 rooms
  • 564 rooms
  • 1085 rooms
  • 1336 rooms
  • 897 rooms
  • 768 rooms
  • 939+ rooms
Rooms in renter-occupied apartments in Ashfield, Massachusetts
  • Rooms in renter-occupied apartments in Ashfield, Massachusetts
  • 41 room
  • 182 rooms
  • 253 rooms
  • 294 rooms
  • 395 rooms
  • 226 rooms
  • 167 rooms
  • 68 rooms
  • 69+ rooms
Year house built
Breakdown of mean house values by ages of householders
Owners and renters by unit type in Ashfield, MA
  • Ashfield, MA household income distribution

  • Distribution of median household income in Ashfield, MA in 2022
  • 1,927Less than $10,000
  • 4,225$10,000 to $19,999
  • 3,956$20,000 to $29,999
  • 2,887$30,000 to $39,999
  • 2,528$40,000 to $49,999
  • 3,694$50,000 to $59,999
  • 3,663$60,000 to $74,999
  • 6,522$75,000 to $99,999
  • 4,019$100,000 to $124,999
  • 2,900$125,000 to $149,999
  • 2,331$150,000 to $199,999
  • 3,035$200,000 or more

Percentage of workers working in this county: 57.7%
Number of people working at home: 213 (18.4% of all workers)

Travel time to work (commute)

  • Less than 5 minutes: 45
  • 5 to 9 minutes: 79
  • 10 to 14 minutes: 43
  • 15 to 19 minutes: 55
  • 20 to 24 minutes: 51
  • 25 to 29 minutes: 80
  • 30 to 34 minutes: 162
  • 35 to 39 minutes: 82
  • 40 to 44 minutes: 92
  • 45 to 59 minutes: 132
  • 60 to 89 minutes: 72
  • 90 or more minutes: 15

Means of transportation to work:

  • Drove a car alone: 767 (74.7%)
  • Carpooled: 85 (8.3%)
  • Bus or trolley bus: 3 (0.3%)
  • Subway or elevated: 4 (0.4%)
  • Bicycle: 2 (0.2%)
  • Walked: 45 (4.4%)
  • Other means: 2 (0.2%)
  • Worked at home: 119 (11.6%)
Class of Workers in 2000
Year of entry for the foreign-born population in Ashfield, Massachusetts
  • Year of entry for the foreign-born population in Ashfield, Massachusetts
  • 231995 to March 2000
  • 41990 to 1994
  • 81985 to 1989
  • 01980 to 1984
  • 41975 to 1979
  • 01970 to 1974
  • 01965 to 1969
  • 14Before 1965
Ancestries in Ashfield, MA

First ancestries reported:

  • English: 408 (18.0%)
  • Irish: 339 (14.9%)
  • German: 266 (11.7%)
  • Other: 243 (10.7%)
  • French: 156 (6.9%)
  • Italian: 132 (5.8%)
  • Polish: 125 (5.5%)
  • French Canadian: 121 (5.3%)
  • United States: 83 (3.7%)
  • Scottish: 73 (3.2%)
  • Dutch: 64 (2.8%)
  • Swedish: 62 (2.7%)
  • Scotch-Irish: 36 (1.6%)
  • Norwegian: 31 (1.4%)
  • Russian: 31 (1.4%)
  • Ukrainian: 26 (1.1%)
  • Welsh: 18 (0.8%)
  • Danish: 14 (0.6%)
  • Portuguese: 11 (0.5%)
  • Hungarian: 10 (0.4%)
  • Lithuanian: 8 (0.4%)
  • Swiss: 4 (0.2%)
  • West Indian: 3 (0.1%)
  • Czech: 2 (0.09%)
  • Slovak: 2 (0.09%)

Most common places of birth for foreign-born residents (%):

Canada
Ashfield:

22.6% (12)
Massachusetts:

5.2% (40,247)

United Kingdom
Ashfield:

11.3% (6)
Massachusetts:

3.3% (25,403)

Other Northern Europe
Ashfield:

7.5% (4)
Massachusetts:

0.4% (3,051)

Germany
Ashfield:

7.5% (4)
Massachusetts:

1.9% (14,883)

Russia
Ashfield:

7.5% (4)
Massachusetts:

2.3% (17,449)

Chile
Ashfield:

7.5% (4)
Massachusetts:

0.2% (1,617)

China, excluding Hong Kong and Taiwan
Ashfield:

5.7% (3)
Massachusetts:

5.1% (39,255)

Other Caribbean
Ashfield:

5.7% (3)
Massachusetts:

0.6% (4,539)

Argentina
Ashfield:

5.7% (3)
Massachusetts:

0.4% (2,780)

Ireland
Ashfield:

3.8% (2)
Massachusetts:

2.3% (17,987)

Other Western Europe
Ashfield:

3.8% (2)
Massachusetts:

0.3% (2,642)

India
Ashfield:

3.8% (2)
Massachusetts:

3.6% (28,086)

Israel
Ashfield:

3.8% (2)
Massachusetts:

0.4% (3,319)

Egypt
Ashfield:

3.8% (2)
Massachusetts:

0.4% (2,726)

Place of birth for U.S.-born residents:

  • This state: 1,151
  • Other state: 578
  • Northeast: 377
  • Midwest: 98
  • South: 59
  • West: 44

71% of Ashfield residents lived in the same house 5 years ago.
   Out of people who lived in different houses, 51% lived in this county.
   Out of people who lived in different counties, 45% lived in Massachusetts.

Education attainment for males 25 years and older:

  • No schooling: 2
  • Nursery to 4th grade: 0
  • 5th and 6th grade: 3
  • 7th and 8th grade: 4
  • 9th grade: 11
  • 10th grade: 15
  • 11th grade: 5
  • 12th grade, no diploma: 2
  • High school graduate (or equivalency): 144
  • Less than 1 year of college: 34
  • Some college more than 1 year, no degree: 92
  • Associate degree: 42
  • Bachelor's degree: 111
  • Master's degree: 78
  • Professional school degree: 21
  • Doctorate degree: 21
Educational Attainment for Males

Education attainment for females 25 years and older:

  • No schooling: 0
  • Nursery to 4th grade: 0
  • 5th and 6th grade: 0
  • 7th and 8th grade: 7
  • 9th grade: 8
  • 10th grade: 2
  • 11th grade: 2
  • 12th grade, no diploma: 10
  • High school graduate (or equivalency): 129
  • Less than 1 year of college: 33
  • Some college more than 1 year, no degree: 80
  • Associate degree: 65
  • Bachelor's degree: 203
  • Master's degree: 117
  • Professional school degree: 34
  • Doctorate degree: 15
Educational Attainment for Females
Ashfield marital status for males
Ashfield marital status for females

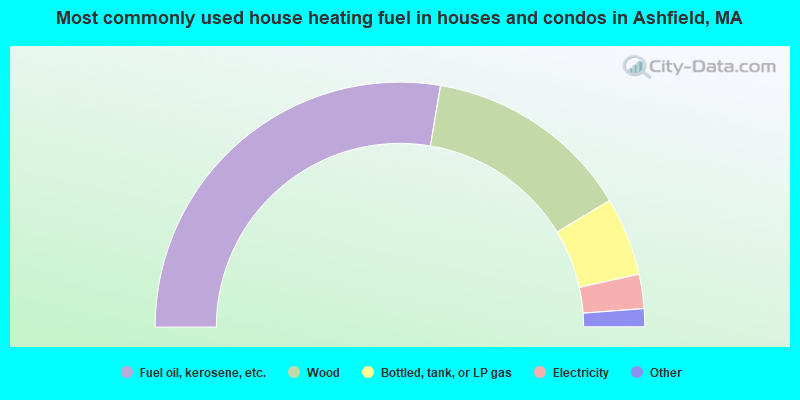
Housing units in structures:

  • One, detached: 687
  • One, attached: 14
  • Two: 58
  • 3 or 4: 17
  • 5 to 9: 14
  • 10 to 19: 17
  • Mobile homes: 14

Median worth of mobile homes: $44,126

Housing units lacking complete plumbing facilities: 2.1%

Housing units lacking complete kitchen facilities: 1.3%
Year householders moved into residence in Ashfield
Houses and condos Apartments
Most commonly used house heating fuel in houses and condos in Ashfield, MA
  • 55.3%Fuel oil, kerosene, etc.
  • 27.4%Wood
  • 10.4%Bottled, tank, or LP gas
  • 4.5%Electricity
  • 1.0%Other fuel
  • 0.7%Coal or coke
  • 0.3%Utility gas
  • 0.3%Solar energy
Most commonly used house heating fuel in apartments in Ashfield, MA
  • 52.7%Fuel oil, kerosene, etc.
  • 19.4%Bottled, tank, or LP gas
  • 19.4%Wood
  • 8.5%Electricity

Private vs. public school enrollment:

Students in private schools in grades 1 to 8 (elementary and middle school): 21
Here:

10.3%
Massachusetts:

10.8%

Students in private schools in grades 9 to 12 (high school): 20
Here:

19.8%
Massachusetts:

12.2%

Students in private undergraduate colleges: 26
Here:

42.6%
Massachusetts:

48.2%
School Enrollment by Level of School for Male Students
School Enrollment by Level of School for Female Students
Age and Sex of Sensory-Disabled Noninstitutionalized Residents
Age and Sex of Physically-Disabled Noninstitutionalized Residents
Age and Sex of Mentally-Disabled Noninstitutionalized Residents
Age and Sex of Self-Care Disabled Noninstitutionalized Residents
Age and Sex of Go-Outside-Home Disabled Noninstitutionalized Residents
Age and Sex of Noninstitutionalized Residents with Employment Disability