Ashwood, SC (South Carolina) Houses and Residents
| Ashwood: | $114,148 |
| South Carolina: | $254,600 |
Total population: 3,770 (Urban population: 0, Rural population: 3,849 (281 farm, 3,568 nonfarm))
Houses: 1,547 (1,420 occupied: 1,230 owner occupied, 190 renter occupied)
| % of renters here: | 13% |
| State: | 28% |
Housing density: 17 houses/condos per square mile
Median price asked for vacant for-sale houses and condos in 2022 in this county: $74,356.
Median contract rent in 2022: $587 (lower quartile is $597, upper quartile is $626)
Median rent asked for vacant for-rent units in 2022: $492
Median gross rent in Ashwood, SC in 2022: $870
Housing units in Ashwood with a mortgage: 340 (13 second mortgage, 23 home equity loan, 0 both second mortgage and home equity loan)
Houses without a mortgage: 331


Household type by relationship:
Households: 17,245- In family households: 14,746 (2,313 male householders, 2,254 female householders)
2,551 spouses, 5,256 children (4,941 natural, 141 adopted, 174 stepchildren), 1,078 grandchildren, 288 brothers or sisters, 166 parents, foster children, 393 other relatives, 371 non-relatives
- In nonfamily households: 2,499 (1,061 male householders (928 living alone)), 1,169 female householders (1,065 living alone)), 269 nonrelatives
- In group quarters: 1,975 (1,920 institutionalized population)
2,353 married couples with children.
1,694 single-parent households (220 men, 1,474 women).
95.3% of residents of Ashwood speak English at home.
3.5% of residents speak Spanish at home (10% speak English very well, 34% speak English well, 22% speak English not well, 34% don't speak English at all).
1.3% of residents speak other Indo-European language at home (47% speak English very well, 38% speak English well, 16% speak English not well).
Foreign born population: 269 (6.6%)
(8.2% of them are naturalized citizens)
| Here: | 6.2 |
| State: | 6.4 |
| Here: | 6.1 |
| State: | 4.5 |

- Bedrooms in owner-occupied houses and condos in Ashwood, South Carolina
- 20no bedroom
- 241 bedroom
- 2392 bedrooms
- 7153 bedrooms
- 2074 bedrooms
- 255+ bedrooms

- Bedrooms in renter-occupied apartments in Ashwood, South Carolina
- 0no bedroom
- 101 bedroom
- 622 bedrooms
- 1113 bedrooms
- 74 bedrooms
- 05+ bedrooms

- Cars and other vehicles available in Ashwood in owner-occupied houses/condos
- 74no vehicle
- 4561 vehicle
- 4332 vehicles
- 1913 vehicles
- 704 vehicles
- 65+ vehicles

- Cars and other vehicles available in Ashwood in renter-occupied apartments
- 6no vehicle
- 971 vehicle
- 752 vehicles
- 123 vehicles
- 04 vehicles
- 05+ vehicles

- Rooms in owner-occupied houses in Ashwood, South Carolina
- 01 room
- 252 rooms
- 413 rooms
- 1254 rooms
- 3225 rooms
- 3566 rooms
- 1857 rooms
- 1158 rooms
- 619+ rooms

- Rooms in renter-occupied apartments in Ashwood, South Carolina
- 01 room
- 02 rooms
- 163 rooms
- 324 rooms
- 705 rooms
- 486 rooms
- 197 rooms
- 58 rooms
- 09+ rooms


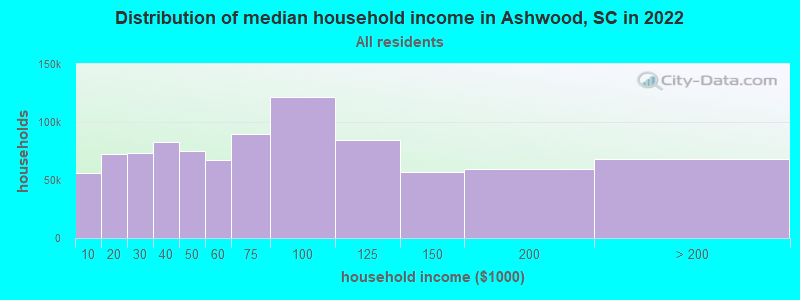
Ashwood, SC household income distribution

- 38,648Less than $10,000
- 59,119$10,000 to $19,999
- 51,716$20,000 to $29,999
- 57,423$30,000 to $39,999
- 53,005$40,000 to $49,999
- 41,399$50,000 to $59,999
- 55,203$60,000 to $74,999
- 73,166$75,000 to $99,999
- 51,629$100,000 to $124,999
- 32,344$125,000 to $149,999
- 32,175$150,000 to $199,999
- 31,721$200,000 or more
Percentage of workers working in this county: 36.4%
Number of people working at home: 128 (7.4% of all workers)
Travel time to work (commute)
- Less than 5 minutes: 54
- 5 to 9 minutes: 6
- 10 to 14 minutes: 149
- 15 to 19 minutes: 312
- 20 to 24 minutes: 273
- 25 to 29 minutes: 162
- 30 to 34 minutes: 307
- 35 to 39 minutes: 43
- 40 to 44 minutes: 84
- 45 to 59 minutes: 131
- 60 to 89 minutes: 80
- 90 or more minutes: 55
Means of transportation to work:
- Drove a car alone: 1,359 (80.1%)
- Carpooled: 251 (14.8%)
- Bus or trolley bus: 13 (0.8%)
- Walked: 19 (1.1%)
- Other means: 14 (0.8%)
- Worked at home: 40 (2.4%)


- Year of entry for the foreign-born population in Ashwood, South Carolina
- 1091995 to March 2000
- 01990 to 1994
- 71985 to 1989
- 01980 to 1984
- 01975 to 1979
- 81970 to 1974
- 01965 to 1969
- 0Before 1965
Most common places of birth for foreign-born residents (%):
| Ashwood: | 87.9% (109) |
| South Carolina: | 27.3% (31,719) |
| Ashwood: | 12.1% (15) |
| South Carolina: | 5.9% (6,890) |
Place of birth for U.S.-born residents:
- This state: 3,323
- Other state: 396
- Northeast: 134
- Midwest: 23
- South: 219
- West: 20
77% of Ashwood residents lived in the same house 5 years ago.
Out of people who lived in different houses, 52% lived in this county.
Out of people who lived in different counties, 57% lived in South Carolina.
Education attainment for males 25 years and older:
- No schooling: 26
- Nursery to 4th grade: 44
- 5th and 6th grade: 51
- 7th and 8th grade: 68
- 9th grade: 66
- 10th grade: 63
- 11th grade: 42
- 12th grade, no diploma: 86
- High school graduate (or equivalency): 386
- Less than 1 year of college: 57
- Some college more than 1 year, no degree: 106
- Associate degree: 45
- Bachelor's degree: 21
- Master's degree: 17
- Professional school degree: 7
- Doctorate degree: 0

Education attainment for females 25 years and older:
- No schooling: 42
- Nursery to 4th grade: 16
- 5th and 6th grade: 52
- 7th and 8th grade: 37
- 9th grade: 76
- 10th grade: 82
- 11th grade: 86
- 12th grade, no diploma: 65
- High school graduate (or equivalency): 456
- Less than 1 year of college: 81
- Some college more than 1 year, no degree: 113
- Associate degree: 49
- Bachelor's degree: 53
- Master's degree: 67
- Professional school degree: 6
- Doctorate degree: 0


Housing units in structures:
- One, detached: 925
- One, attached: 7
- Mobile homes: 615
Median worth of mobile homes: $54,909
Housing units lacking complete kitchen facilities: 0.9%

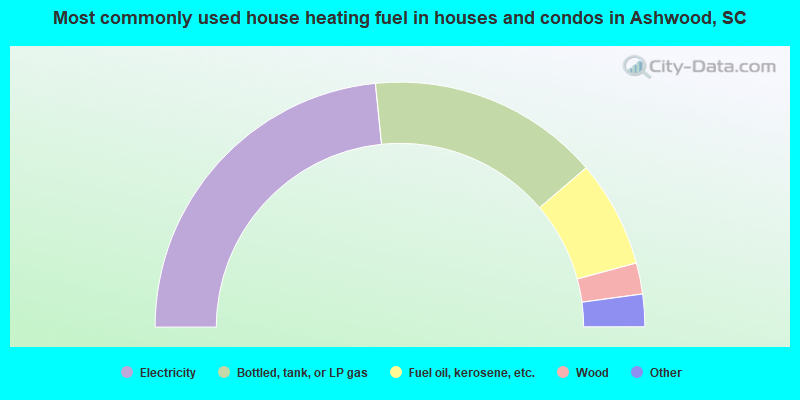
- 46.8%Electricity
- 30.7%Bottled, tank, or LP gas
- 14.1%Fuel oil, kerosene, etc.
- 4.1%Wood
- 2.8%Utility gas
- 1.1%No fuel used
- 0.5%Solar energy
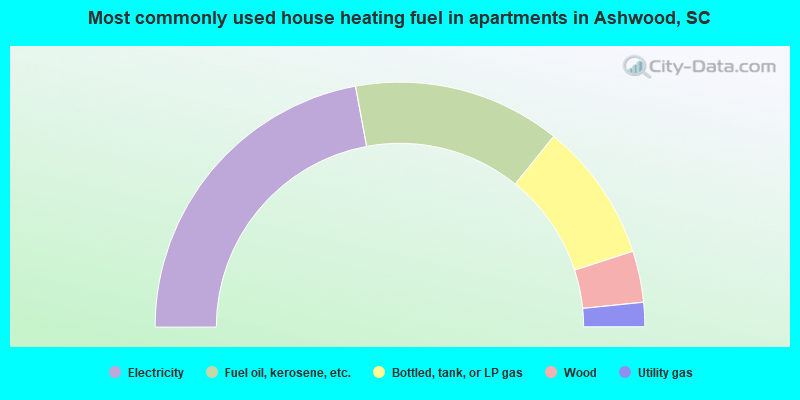
- 44.2%Electricity
- 27.4%Fuel oil, kerosene, etc.
- 18.4%Bottled, tank, or LP gas
- 6.8%Wood
- 3.2%Utility gas
Private vs. public school enrollment:
| Here: | 23.3% |
| South Carolina: | 9.2% |
| Here: | 20.3% |
| South Carolina: | 8.1% |
| Here: | 25.8% |
| South Carolina: | 20.3% |


