Back Mountain, PA (Pennsylvania) Houses and Residents
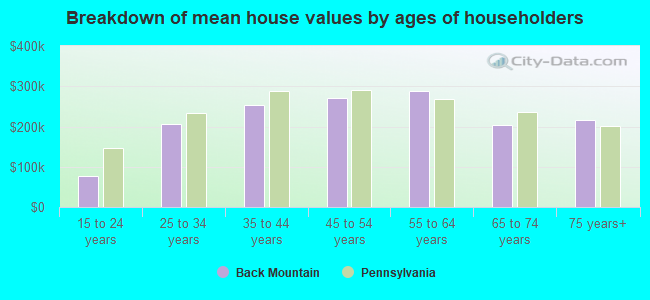
| Back Mountain: | $241,096 |
| Pennsylvania: | $245,500 |
Total population: 26,134 (Urban population: 14,160, Rural population: 12,532 (50 farm, 12,482 nonfarm))
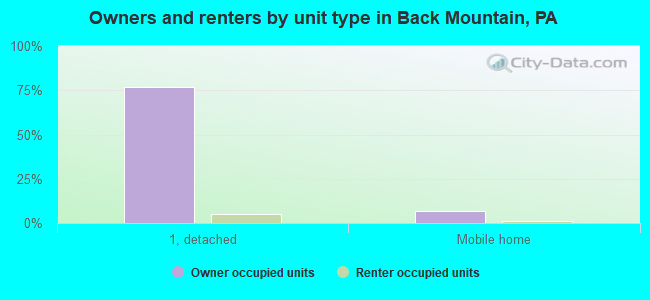
Houses: 9,997 (9,267 occupied: 7,905 owner occupied, 1,362 renter occupied)
| % of renters here: | 15% |
| State: | 31% |
Housing density: 93 houses/condos per square mile
Median price asked for vacant for-sale houses and condos in 2022 in this county: $138,564.
Median contract rent in 2022: $825 (lower quartile is $568, upper quartile is $1,227)
Median rent asked for vacant for-rent units in 2022: $844
Median gross rent in Back Mountain, PA in 2022: $1,074
Housing units in Back Mountain with a mortgage: 4,181 (414 second mortgage, 816 home equity loan, 8 both second mortgage and home equity loan)
Houses without a mortgage: 2,308
Compare current foreclosures near Back Mountain, PA:
| Photo | Address | Area | Beds / Baths | Price | Details |
|---|---|---|---|---|---|

|
#1
Cedar Ave
Scranton, PA 18505
|
1,500 sq. feet
|
1 baths 3 beds |
$26,900
|
show details |

|
#2
Keelersburg Rd
Tunkhannock, PA 18657
|
2,552 sq. feet
|
2 baths 4 beds |
$79,900
|
show details |

|
#3
Liberty St
Pittston, PA 18641
|
960 sq. feet
|
1 baths 2 beds |
$152,500
|
show details |

|
#4
Searle St
Pittston, PA 18640
|
1,176 sq. feet
|
1 baths 2 beds |
$169,900
|
show details |

|
#5
W Harrison St
Tunkhannock, PA 18657
|
1,710 sq. feet
|
1 baths 3 beds |
$228,900
|
show details |

|
#6
Maple St
Scranton, PA 18505
|
1,500 sq. feet
|
1 baths 3 beds |
$195,500
|
show details |

|
#7
W Main St
Nanticoke, PA 18634
|
1,474 sq. feet
|
1 baths 3 beds |
$214,750
|
show details |

|
#8
Allen St
Luzerne, PA 18709
|
- sq. feet
|
2 baths 2 beds |
$109,900
|
show details |

|
#9
Old Mill Rd
Dalton, PA 18414
|
- sq. feet
|
1 baths 2 beds |
$114,400
|
show details |

|
#10
Charles St
Dallas, PA 18612
|
1,248 sq. feet
|
1 baths 3 beds |
show details |
| Photo | Address | Area | Beds / Baths | Price | Details |
|---|---|---|---|---|---|

|
#11
Lawrence St
Wilkes Barre, PA 18702
|
1,150 sq. feet
|
1 baths 3 beds |
show details | |

|
#12
Pittston Ave
Scranton, PA 18505
|
1,856 sq. feet
|
2 baths 2 beds |
show details | |

|
#13
Cliffside Ave
Shavertown, PA 18708
|
1,118 sq. feet
|
2 baths 3 beds |
show details | |

|
#14
S Hyde Park Ave
Scranton, PA 18504
|
1,760 sq. feet
|
2 baths 4 beds |
show details | |

|
#15
Meadowcrest Dr
Shavertown, PA 18708
|
- sq. feet
|
2 baths 3 beds |
show details | |

|
#16
N Maple Ave
Kingston, PA 18704
|
2,800 sq. feet
|
2 baths 6 beds |
show details | |

|
#17
N Garfield Ave
Scranton, PA 18504
|
1,776 sq. feet
|
1 baths 4 beds |
show details | |

|
#18
Linden St
Pittston, PA 18643
|
2,428 sq. feet
|
3 baths 3 beds |
show details | |

|
#19
2nd St
Harveys Lake, PA 18618
|
1,676 sq. feet
|
1 baths 3 beds |
show details | |

|
#20
S Main St
Wilkes Barre, PA 18706
|
1,728 sq. feet
|
1 baths 3 beds |
show details |
| Photo | Address | Area | Beds / Baths | Price | Details |
|---|---|---|---|---|---|

|
#21
Elizabeth St
Pittston, PA 18640
|
1,711 sq. feet
|
1 baths 3 beds |
show details | |

|
#22
Circle Dr
Pittston, PA 18643
|
- sq. feet
|
1 baths 3 beds |
show details | |

|
#23
N Main St
Wilkes Barre, PA 18705
|
1,782 sq. feet
|
2 baths 3 beds |
show details | |

|
#24
Ashley St
Wilkes Barre, PA 18706
|
1,895 sq. feet
|
2 baths 3 beds |
show details | |

|
#25
Evergreen Dr
Clarks Summit, PA 18411
|
1,100 sq. feet
|
1 baths 3 beds |
show details | |

|
#26
E Ridge St
Nanticoke, PA 18634
|
1,328 sq. feet
|
1 baths 3 beds |
show details | |

|
#27
Anthracite St
Pittston, PA 18643
|
1,144 sq. feet
|
1 baths 3 beds |
show details | |

|
#28
Norman St
Pittston, PA 18640
|
1,452 sq. feet
|
2 baths 2 beds |
show details | |

|
#29
Slocum St
Kingston, PA 18704
|
- sq. feet
|
2 baths 3 beds |
show details | |

|
#30
Bear Creek Blvd
Wilkes Barre, PA 18702
|
- sq. feet
|
1 baths 3 beds |
show details |
| Photo | Address | Area | Beds / Baths | Price | Details |
|---|---|---|---|---|---|

|
#31
Knox St
Wilkes Barre, PA 18706
|
- sq. feet
|
2 baths 4 beds |
show details | |

|
#32
Dymond Ter
Tunkhannock, PA 18657
|
- sq. feet
|
1 baths 2 beds |
show details | |

|
#33
Main St
Noxen, PA 18636
|
- sq. feet
|
1 baths 2 beds |
show details | |

|
#34
Mizdail Rd
Hunlock Creek, PA 18621
|
- sq. feet
|
1 baths 2 beds |
show details | |

|
#35
W Grove St
Taylor, PA 18517
|
- sq. feet
|
1 baths 3 beds |
show details | |

|
#36
Carey Ave
Wilkes Barre, PA 18702
|
- sq. feet
|
1 baths 3 beds |
show details | |

|
#37
Wyoming Ave
Wyoming, PA 18644
|
- sq. feet
|
3 baths 3 beds |
show details | |

|
#38
Oak St
Taylor, PA 18517
|
- sq. feet
|
1 baths 4 beds |
show details | |

|
#39
Fairview Dr
Nanticoke, PA 18634
|
- sq. feet
|
2 baths 3 beds |
show details | |

|
#40
Follies Rd
Dallas, PA 18612
|
1,786 sq. feet
|
- baths 3 beds |
show details |
| Photo | Address | Area | Beds / Baths | Price | Details |
|---|---|---|---|---|---|

|
#41
Blytheburn Rd
Mountain Top, PA 18707
|
- sq. feet
|
2 baths 3 beds |
show details | |

|
#42
Village Rd
Dallas, PA 18612
|
- sq. feet
|
1 baths 3 beds |
show details | |

|
#43
Lincoln St
Harveys Lake, PA 18618
|
- sq. feet
|
- baths - beds |
show details | |

|
#44
Jones St
Wilkes Barre, PA 18702
|
1,696 sq. feet
|
- baths - beds |
show details | |

|
#45
Sparrow Dr
Shavertown, PA 18708
|
- sq. feet
|
- baths - beds |
show details | |

|
#46
High Blvd
Wilkes Barre, PA 18702
|
- sq. feet
|
- baths - beds |
show details | |

|
#47
High Blvd
Wilkes Barre, PA 18702
|
- sq. feet
|
- baths - beds |
show details | |

|
#48
High St
Wilkes Barre, PA 18706
|
- sq. feet
|
- baths - beds |
show details | |

|
#49
E 42nd St
Dallas, PA 18612
|
- sq. feet
|
- baths - beds |
show details | |

|
Check over 1 million property listings on Foreclosure.com!
|
browse all offers | |||

 | Future NE Penn. residents looking for personal opinions and experiences! (273 replies) |
| Mountain Top, Pa. latest pump-n-dump real estate scam (21 replies) |
| Propane and home heating oil in NEPA (East Stroudsburg area) (25 replies) |
| Jewish population in Wilkes Barre/Dallas area (16 replies) |
| Looking to rent a home. Moving to Northeast, PA ( monroe county) (8 replies) |
| What is a NEPA? (38 replies) |
Household type by relationship:
Households: 309,127- In family households: 251,124 (56,875 male householders, 26,216 female householders)
59,213 spouses, 85,943 children (80,391 natural, 1,957 adopted, 3,595 stepchildren), 5,423 grandchildren, 2,910 brothers or sisters, 3,270 parents, foster children, 2,694 other relatives, 7,025 non-relatives
- In nonfamily households: 58,003 (22,227 male householders (17,950 living alone)), 26,614 female householders (23,531 living alone)), 9,162 nonrelatives
- In group quarters: 11,791 (7,371 institutionalized population)
46,237 married couples with children.
15,256 single-parent households (3,534 men, 11,722 women).
96.4% of residents of Back Mountain speak English at home.
1.2% of residents speak Spanish at home (66% speak English very well, 18% speak English well, 16% speak English not well).
2.2% of residents speak other Indo-European language at home (78% speak English very well, 13% speak English well, 9% speak English not well).
0.1% of residents speak Asian or Pacific Island language at home (78% speak English very well, 22% speak English well).
0.1% of residents speak other language at home (58% speak English very well, 42% speak English well).
Foreign born population: 2,097 (7.7%)
(64.2% of them are naturalized citizens)
| Here: | 6.5 |
| State: | 6.8 |
| Here: | 4.8 |
| State: | 4.3 |
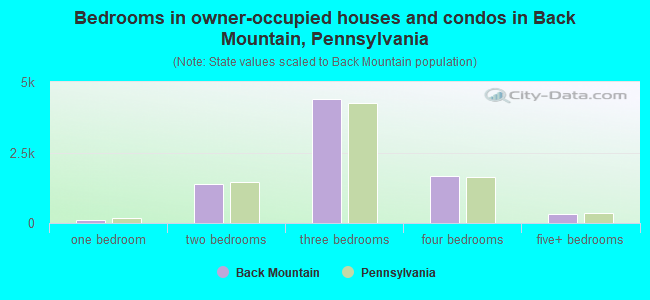
- Bedrooms in owner-occupied houses and condos in Back Mountain, Pennsylvania
- 0no bedroom
- 1121 bedroom
- 1,3772 bedrooms
- 4,4143 bedrooms
- 1,6794 bedrooms
- 3235+ bedrooms
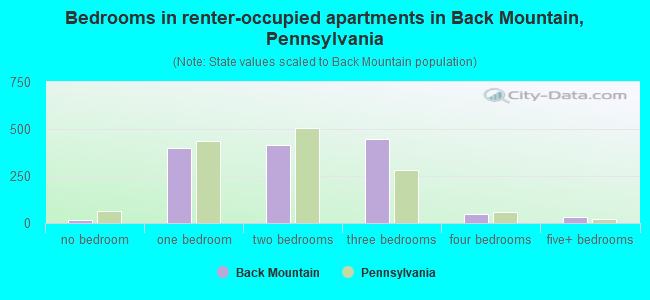
- Bedrooms in renter-occupied apartments in Back Mountain, Pennsylvania
- 17no bedroom
- 4011 bedroom
- 4172 bedrooms
- 4473 bedrooms
- 464 bedrooms
- 345+ bedrooms
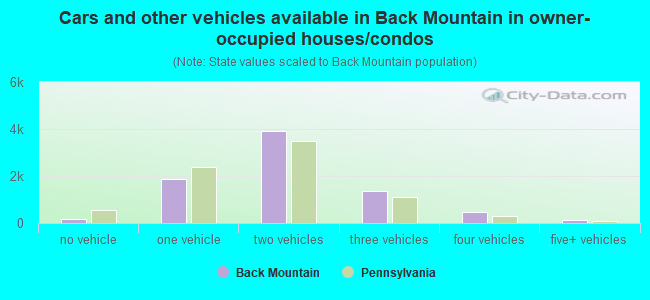
- Cars and other vehicles available in Back Mountain in owner-occupied houses/condos
- 163no vehicle
- 1,8541 vehicle
- 3,9262 vehicles
- 1,3603 vehicles
- 4564 vehicles
- 1465+ vehicles
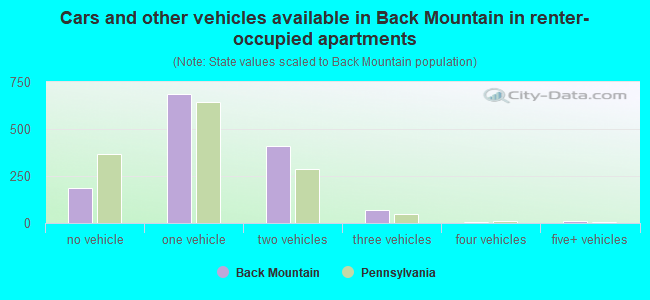
- Cars and other vehicles available in Back Mountain in renter-occupied apartments
- 185no vehicle
- 6861 vehicle
- 4072 vehicles
- 673 vehicles
- 74 vehicles
- 105+ vehicles
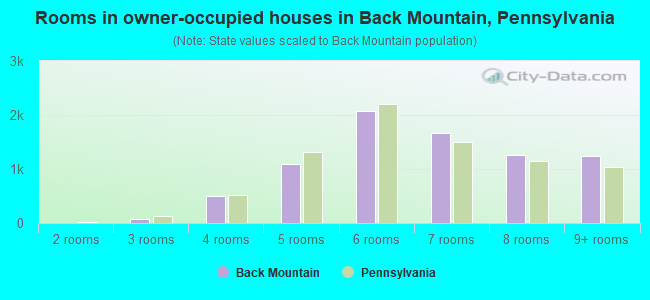
- Rooms in owner-occupied houses in Back Mountain, Pennsylvania
- 01 room
- 22 rooms
- 763 rooms
- 5094 rooms
- 1,0875 rooms
- 2,0696 rooms
- 1,6677 rooms
- 1,2528 rooms
- 1,2439+ rooms
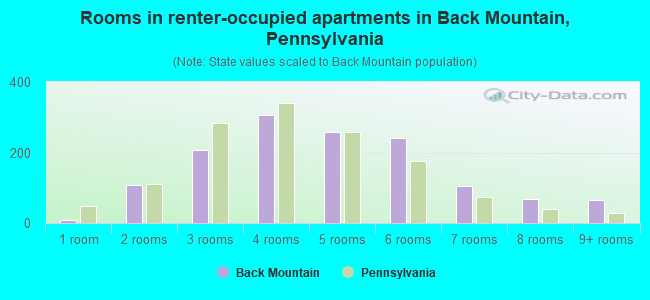
- Rooms in renter-occupied apartments in Back Mountain, Pennsylvania
- 91 room
- 1072 rooms
- 2083 rooms
- 3054 rooms
- 2575 rooms
- 2406 rooms
- 1057 rooms
- 678 rooms
- 649+ rooms
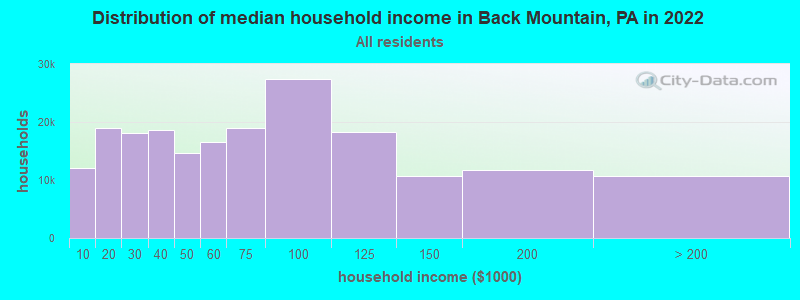
Back Mountain, PA household income distribution

- 12,102Less than $10,000
- 19,003$10,000 to $19,999
- 18,030$20,000 to $29,999
- 18,699$30,000 to $39,999
- 14,681$40,000 to $49,999
- 16,573$50,000 to $59,999
- 18,920$60,000 to $74,999
- 27,461$75,000 to $99,999
- 18,205$100,000 to $124,999
- 10,652$125,000 to $149,999
- 11,789$150,000 to $199,999
- 10,747$200,000 or more
Percentage of workers working in this county: 86.0%
Number of people working at home: 1,235 (9.7% of all workers)
Travel time to work (commute)
- Less than 5 minutes: 326
- 5 to 9 minutes: 1,054
- 10 to 14 minutes: 1,597
- 15 to 19 minutes: 2,144
- 20 to 24 minutes: 2,310
- 25 to 29 minutes: 977
- 30 to 34 minutes: 1,172
- 35 to 39 minutes: 301
- 40 to 44 minutes: 289
- 45 to 59 minutes: 514
- 60 to 89 minutes: 238
- 90 or more minutes: 283
Means of transportation to work:
- Drove a car alone: 10,062 (86.8%)
- Carpooled: 860 (7.4%)
- Bus or trolley bus: 27 (0.2%)
- Motorcycle: 2 (0.0%)
- Walked: 204 (1.8%)
- Other means: 50 (0.4%)
- Worked at home: 393 (3.4%)
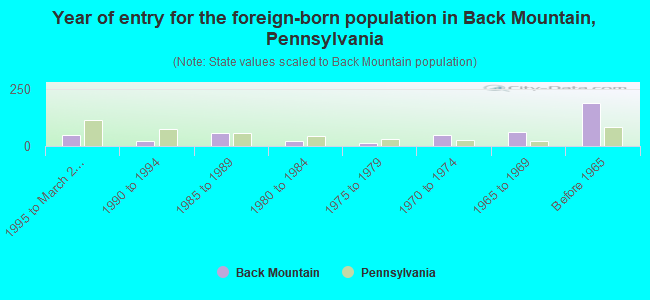
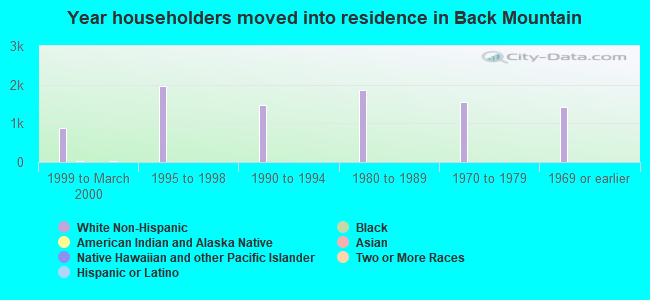
- Year of entry for the foreign-born population in Back Mountain, Pennsylvania
- 491995 to March 2000
- 211990 to 1994
- 581985 to 1989
- 231980 to 1984
- 121975 to 1979
- 491970 to 1974
- 611965 to 1969
- 186Before 1965
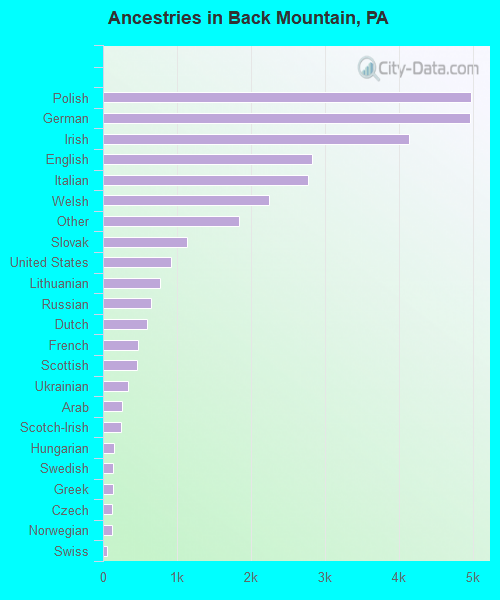
First ancestries reported:
- Polish: 4,970 (16.3%)
- German: 4,961 (16.3%)
- Irish: 4,141 (13.6%)
- English: 2,829 (9.3%)
- Italian: 2,774 (9.1%)
- Welsh: 2,247 (7.4%)
- Other: 1,837 (6.0%)
- Slovak: 1,135 (3.7%)
- United States: 922 (3.0%)
- Lithuanian: 775 (2.5%)
- Russian: 647 (2.1%)
- Dutch: 589 (1.9%)
- French: 470 (1.5%)
- Scottish: 456 (1.5%)
- Ukrainian: 344 (1.1%)
- Arab: 262 (0.9%)
- Scotch-Irish: 242 (0.8%)
- Hungarian: 155 (0.5%)
- Swedish: 135 (0.4%)
- Greek: 130 (0.4%)
- Czech: 121 (0.4%)
- Norwegian: 115 (0.4%)
- Swiss: 52 (0.2%)
- French Canadian: 36 (0.1%)
- Danish: 23 (0.08%)
- Portuguese: 20 (0.07%)
- Subsaharan African: 13 (0.04%)
Most common places of birth for foreign-born residents (%):
| Back Mountain: | 11.8% (54) |
| Pennsylvania: | 4.6% (23,171) |
| Back Mountain: | 10.7% (49) |
| Pennsylvania: | 5.1% (25,685) |
| Back Mountain: | 5.7% (26) |
| Pennsylvania: | 0.8% (3,914) |
| Back Mountain: | 5.7% (26) |
| Pennsylvania: | 7.4% (37,541) |
| Back Mountain: | 5.4% (25) |
| Pennsylvania: | 3.0% (15,200) |
| Back Mountain: | 5.4% (25) |
| Pennsylvania: | 0.7% (3,451) |
| Back Mountain: | 4.1% (19) |
| Pennsylvania: | 2.7% (13,885) |
| Back Mountain: | 3.7% (17) |
| Pennsylvania: | 3.3% (16,897) |
| Back Mountain: | 3.7% (17) |
| Pennsylvania: | 5.3% (26,703) |
| Back Mountain: | 3.3% (15) |
| Pennsylvania: | 1.3% (6,687) |
| Back Mountain: | 3.3% (15) |
| Pennsylvania: | 2.3% (11,916) |
| Back Mountain: | 3.3% (15) |
| Pennsylvania: | 0.5% (2,472) |
| Back Mountain: | 3.1% (14) |
| Pennsylvania: | 6.0% (30,559) |
| Back Mountain: | 3.1% (14) |
| Pennsylvania: | 0.6% (3,034) |
| Back Mountain: | 2.4% (11) |
| Pennsylvania: | 1.3% (6,531) |
| Back Mountain: | 2.2% (10) |
| Pennsylvania: | 0.5% (2,714) |
| Back Mountain: | 2.2% (10) |
| Pennsylvania: | 0.4% (2,023) |
| Back Mountain: | 2.0% (9) |
| Pennsylvania: | 1.7% (8,574) |
| Back Mountain: | 1.7% (8) |
| Pennsylvania: | 0.7% (3,328) |
| Back Mountain: | 1.7% (8) |
| Pennsylvania: | 4.6% (23,478) |
| Back Mountain: | 1.7% (8) |
| Pennsylvania: | 2.2% (11,411) |
| Back Mountain: | 1.7% (8) |
| Pennsylvania: | 0.7% (3,475) |
| Back Mountain: | 1.7% (8) |
| Pennsylvania: | 0.1% (496) |
| Back Mountain: | 1.5% (7) |
| Pennsylvania: | 0.6% (2,863) |
| Back Mountain: | 1.5% (7) |
| Pennsylvania: | 0.8% (3,975) |
| Back Mountain: | 1.5% (7) |
| Pennsylvania: | 2.4% (12,390) |
Place of birth for U.S.-born residents:
- This state: 22,259
- Other state: 3,806
- Northeast: 2,175
- Midwest: 600
- South: 814
- West: 217
67% of Back Mountain residents lived in the same house 5 years ago.
Out of people who lived in different houses, 66% lived in this county.
Out of people who lived in different counties, 71% lived in Pennsylvania.
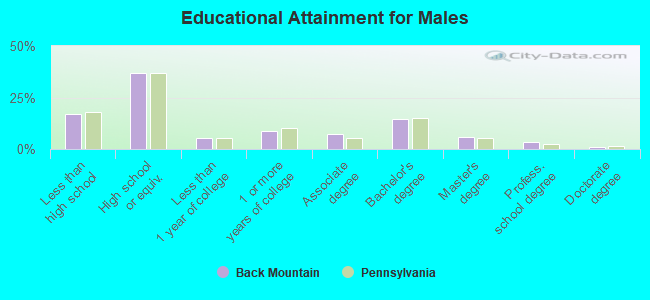
Education attainment for males 25 years and older:
- No schooling: 74
- Nursery to 4th grade: 23
- 5th and 6th grade: 69
- 7th and 8th grade: 318
- 9th grade: 272
- 10th grade: 295
- 11th grade: 303
- 12th grade, no diploma: 275
- High school graduate (or equivalency): 3,569
- Less than 1 year of college: 529
- Some college more than 1 year, no degree: 841
- Associate degree: 708
- Bachelor's degree: 1,431
- Master's degree: 551
- Professional school degree: 317
- Doctorate degree: 94
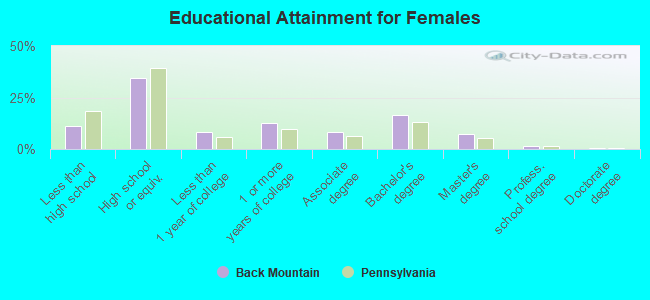
Education attainment for females 25 years and older:
- No schooling: 29
- Nursery to 4th grade: 0
- 5th and 6th grade: 35
- 7th and 8th grade: 245
- 9th grade: 136
- 10th grade: 187
- 11th grade: 169
- 12th grade, no diploma: 199
- High school graduate (or equivalency): 3,123
- Less than 1 year of college: 760
- Some college more than 1 year, no degree: 1,147
- Associate degree: 751
- Bachelor's degree: 1,489
- Master's degree: 641
- Professional school degree: 132
- Doctorate degree: 52
Housing units in structures:
- One, detached: 8,139
- One, attached: 191
- Two: 246
- 3 or 4: 180
- 5 to 9: 50
- 10 to 19: 54
- 20 to 49: 80
- 50 or more: 193
- Mobile homes: 851
- Boats, RVs, vans, etc.: 13
Median worth of mobile homes: $22,215
Housing units lacking complete kitchen facilities: 1.6%
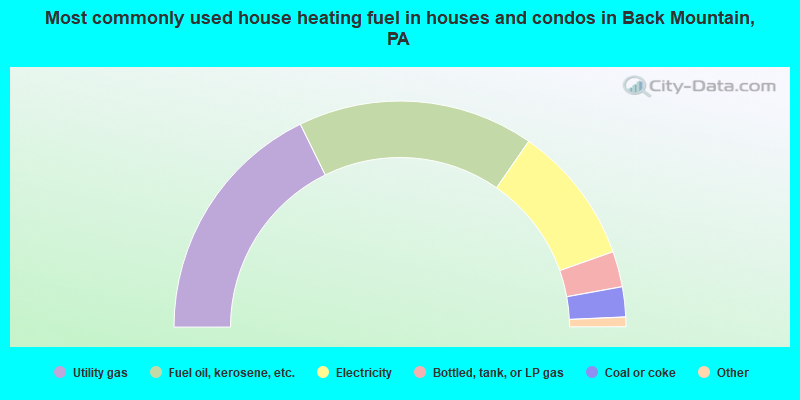
- 35.5%Utility gas
- 33.9%Fuel oil, kerosene, etc.
- 19.9%Electricity
- 5.1%Bottled, tank, or LP gas
- 4.3%Coal or coke
- 1.2%Wood
- 0.1%Other fuel
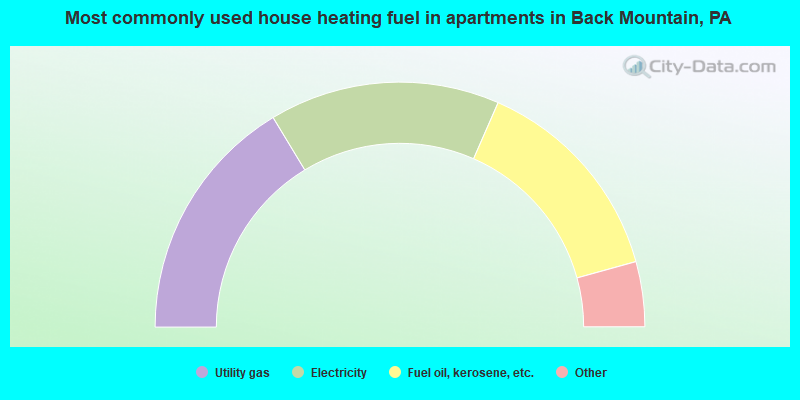
- 32.7%Utility gas
- 30.5%Electricity
- 28.3%Fuel oil, kerosene, etc.
- 3.9%Bottled, tank, or LP gas
- 2.8%Coal or coke
- 0.7%No fuel used
- 0.6%Wood
- 0.6%Other fuel
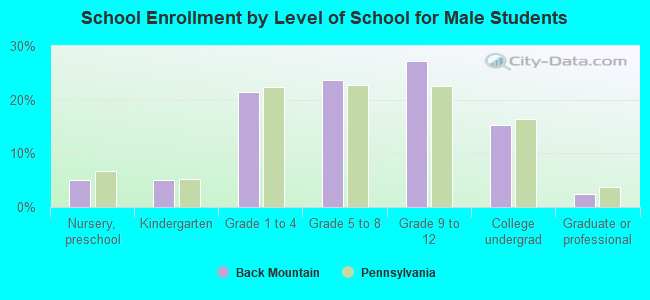
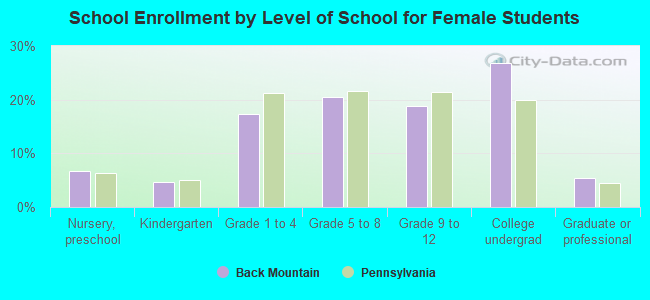
Private vs. public school enrollment:
| Here: | 19.9% |
| Pennsylvania: | 16.0% |
| Here: | 16.4% |
| Pennsylvania: | 13.1% |
| Here: | 56.8% |
| Pennsylvania: | 37.3% |