Bainbridge Island, WA (Washington) Houses and Residents
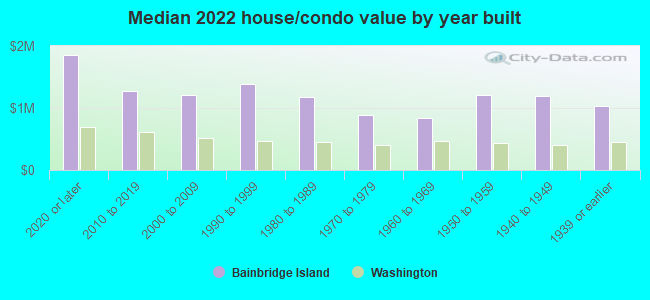
| Bainbridge Island: | $1,145,873 |
| Washington: | $569,500 |
Total population: 23,293 (Urban population: 16,474, Rural population: 3,834 (all nonfarm))
Houses: 10,927 (10,117 occupied: 8,243 owner occupied, 1,905 renter occupied)
| % of renters here: | 19% |
| State: | 36% |
Housing density: 396 houses/condos per square mile
Median price asked for vacant for-sale houses and condos in 2022: $3,144,040.
Median contract rent in 2022: $1,881 (lower quartile is $1,077, upper quartile is over $2,000)
Median rent asked for vacant for-rent units in 2022: $10,812
Median gross rent in Bainbridge Island, WA in 2022: over $2,000
Housing units in Bainbridge Island with a mortgage: 5,082 (803 second mortgage, 47 home equity loan, 635 both second mortgage and home equity loan)
Houses without a mortgage: 89
Median household income for houses/condos with a mortgage: $188,654
Median household income for apartments without a mortgage: $129,834
Median monthly housing costs: $2,343
Compare current foreclosures near Bainbridge Island, WA:
| Photo | Address | Area | Beds / Baths | Price | Details |
|---|---|---|---|---|---|

|
#1
NE Murden Cove Dr
Bainbridge Island, WA 98110
|
2,663 sq. feet
|
2 baths 4 beds |
show details | |

|
#2
Harbor Sq Loop NE Unit A106
Bainbridge Island, WA 98110
|
1,498 sq. feet
|
2 baths 2 beds |
show details | |

|
#3
Forest Ln NE
Bainbridge Island, WA 98110
|
2,336 sq. feet
|
3 baths 3 beds |
show details | |

|
#4
High School Rd Ne, # D3176
Bainbridge Island, WA 98110
|
- sq. feet
|
- baths - beds |
show details | |

|
#5
Hanami Ln Ne, Apt 412
Bainbridge Island, WA 98110
|
- sq. feet
|
- baths - beds |
show details | |

|
#6
High School Rd NW Apt 19
Bainbridge Island, WA 98110
|
- sq. feet
|
- baths - beds |
show details | |

|
#7
NE Bergman Rd
Bainbridge Island, WA 98110
|
- sq. feet
|
- baths - beds |
show details | |

|
#8
1st Ave S # 806
Seattle, WA 98104
|
806 sq. feet
|
1 baths 1 beds |
show details | |

|
#9
SW Wycoff Rd
Port Orchard, WA 98367
|
2,256 sq. feet
|
2 baths 3 beds |
show details | |

|
#10
S Sullivan St
Seattle, WA 98118
|
1,710 sq. feet
|
2 baths 3 beds |
show details |
| Photo | Address | Area | Beds / Baths | Price | Details |
|---|---|---|---|---|---|

|
#11
NE 142nd Pl
Kirkland, WA 98034
|
1,830 sq. feet
|
2 baths 3 beds |
show details | |

|
#12
2nd Ave NW
Seattle, WA 98177
|
1,660 sq. feet
|
2 baths 3 beds |
show details | |

|
#13
NW Holmberg St
Bremerton, WA 98311
|
1,460 sq. feet
|
1 baths 3 beds |
show details | |

|
#14
Ravenna Ave NE
Seattle, WA 98125
|
1,660 sq. feet
|
2 baths 4 beds |
show details | |

|
#15
39th Ave W
Seattle, WA 98199
|
2,800 sq. feet
|
2 baths 3 beds |
show details | |

|
#16
Walnut St
Bremerton, WA 98310
|
- sq. feet
|
2 baths 4 beds |
show details | |

|
#17
NE 88th St
Seattle, WA 98115
|
2,200 sq. feet
|
2 baths 3 beds |
show details | |

|
#18
S Donovan St
Seattle, WA 98108
|
1,450 sq. feet
|
2 baths 4 beds |
show details | |

|
#19
William Heights Ln SW
Port Orchard, WA 98367
|
1,680 sq. feet
|
2 baths 3 beds |
show details | |

|
#20
19th Ave S
Seattle, WA 98168
|
2,420 sq. feet
|
2 baths 2 beds |
show details |
| Photo | Address | Area | Beds / Baths | Price | Details |
|---|---|---|---|---|---|

|
#21
10th Ave S
Seattle, WA 98168
|
830 sq. feet
|
1 baths 2 beds |
show details | |

|
#22
8th Ave W
Seattle, WA 98119
|
1,400 sq. feet
|
1 baths 3 beds |
show details | |

|
#23
Bloomington Ave
Bremerton, WA 98312
|
1,656 sq. feet
|
1 baths 4 beds |
show details | |

|
#24
5th St
Bremerton, WA 98337
|
950 sq. feet
|
1 baths 2 beds |
show details | |

|
#25
91st Ave W
Edmonds, WA 98026
|
1,504 sq. feet
|
1 baths 3 beds |
show details | |

|
#26
16th Ave S
Seattle, WA 98168
|
1,800 sq. feet
|
1 baths 4 beds |
show details | |

|
#27
SW 109th St
Seattle, WA 98146
|
2,410 sq. feet
|
1 baths 4 beds |
show details | |

|
#28
Cynthia Ln SW
Port Orchard, WA 98367
|
2,870 sq. feet
|
2 baths 4 beds |
show details | |

|
#29
3rd Ave S
Seattle, WA 98168
|
870 sq. feet
|
1 baths 2 beds |
show details | |

|
#30
5th Ave NE
Seattle, WA 98155
|
1,460 sq. feet
|
1 baths 3 beds |
show details |
| Photo | Address | Area | Beds / Baths | Price | Details |
|---|---|---|---|---|---|

|
#31
SW 148th St
Seattle, WA 98166
|
1,030 sq. feet
|
1 baths 3 beds |
show details | |

|
#32
Yukon Harbor Rd SE
Port Orchard, WA 98366
|
3,163 sq. feet
|
1 baths 3 beds |
show details | |

|
#33
51st Ave NE
Seattle, WA 98115
|
2,450 sq. feet
|
2 baths 4 beds |
show details | |

|
#34
9th St
Bremerton, WA 98337
|
776 sq. feet
|
1 baths 2 beds |
show details | |

|
#35
NE 190th St
Seattle, WA 98155
|
2,070 sq. feet
|
2 baths 5 beds |
show details | |

|
#36
16th Ave SW
Seattle, WA 98106
|
970 sq. feet
|
1 baths 3 beds |
show details | |

|
#37
Howard Ave NE
Kingston, WA 98346
|
1,008 sq. feet
|
1 baths 2 beds |
show details | |

|
#38
SW 100th St
Seattle, WA 98146
|
2,130 sq. feet
|
1 baths 5 beds |
show details | |

|
#39
114th Ave NE
Kirkland, WA 98033
|
1,950 sq. feet
|
2 baths 4 beds |
show details | |

|
#40
NW 59th St
Seattle, WA 98107
|
1,110 sq. feet
|
1 baths 3 beds |
show details |
| Photo | Address | Area | Beds / Baths | Price | Details |
|---|---|---|---|---|---|

|
#41
Ivy Rd
Bremerton, WA 98310
|
1,296 sq. feet
|
2 baths 3 beds |
show details | |

|
#42
Anderson Hill Rd SW
Port Orchard, WA 98367
|
1,454 sq. feet
|
1 baths 4 beds |
show details | |

|
#43
Aegean Blvd NE
Bremerton, WA 98311
|
1,960 sq. feet
|
2 baths 4 beds |
show details | |

|
#44
116th Ave NE
Kirkland, WA 98033
|
1,260 sq. feet
|
2 baths 3 beds |
show details | |

|
#45
Helena Dr NE
Bremerton, WA 98311
|
1,555 sq. feet
|
2 baths 3 beds |
show details | |

|
#46
E Lynn St # 98102
Seattle, WA 98102
|
792 sq. feet
|
1 baths - beds |
show details | |

|
#47
41st Ave SW
Seattle, WA 98116
|
1,420 sq. feet
|
1 baths 2 beds |
show details | |

|
#48
Concord Ln NE Ste B202
Bremerton, WA 98311
|
- sq. feet
|
2 baths 2 beds |
show details | |

|
#49
29th Ave S
Seattle, WA 98168
|
1,150 sq. feet
|
1 baths 3 beds |
show details | |

|
Check over 1 million property listings on Foreclosure.com!
|
browse all offers | |||


 | Vancouver vs. Portland - Pros and Cons? (40 replies) |
| Questions about Bainbridge Island (0 replies) |
Median year apartment built: 1984
Household type by relationship:
Households: 24,883- Male householders: 4,536 (646 living alone), Female householders: 5,393 (1,322 living alone)
6,526 spouses (6,430 opposite-sex spouses), 432 unmarried partners, (397 opposite-sex unmarried partners), 6,515 children (6,212 natural, 144 adopted, 158 stepchildren), 196 grandchildren, 147 brothers or sisters, 133 parents, 10 foster children, 183 other relatives, 616 non-relatives
- In group quarters: 192
Size of family households: 3,789 2-persons, 1,756 3-persons, 1,335 4-persons, 591 5-persons, 134 6-persons, 59 7-or-more-persons.
Size of nonfamily households: 1,980 1-person, 367 2-persons, 59 3-persons, 13 4-persons.
3,793 married couples with children.
1,058 single-parent households (467 men, 591 women).
94.4% of residents of Bainbridge Island speak English at home.
1.4% of residents speak Spanish at home (91% speak English very well, 6% speak English well, 3% speak English not well).
3.1% of residents speak other Indo-European language at home (96% speak English very well, 4% speak English well).
1.1% of residents speak Asian or Pacific Island language at home (77% speak English very well, 17% speak English well, 6% speak English not well).
0.2% of residents speak other language at home (100% speak English very well).
Foreign born population: 2,017 (8.1%)
(58.2% of them are naturalized citizens)
| Here: | 7.0 |
| State: | 6.5 |
| Here: | 4.1 |
| State: | 3.9 |
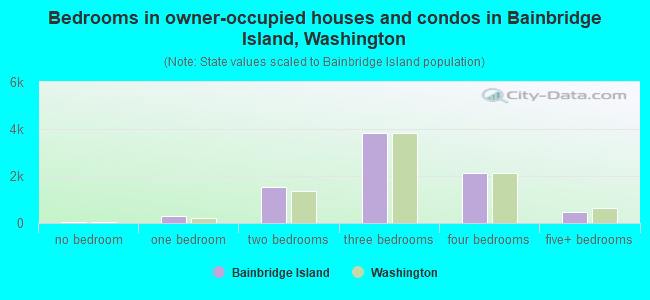
- Bedrooms in owner-occupied houses and condos in Bainbridge Island, Washington
- 33no bedroom
- 2781 bedroom
- 1,5302 bedrooms
- 3,8173 bedrooms
- 2,1224 bedrooms
- 4635+ bedrooms
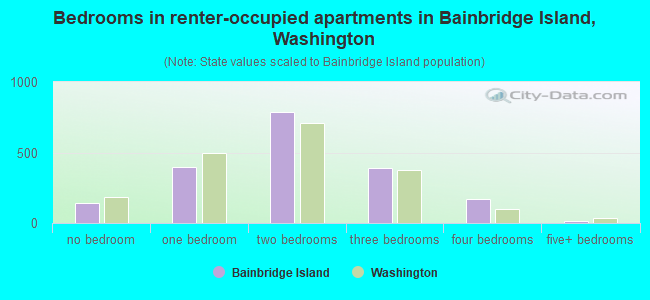
- Bedrooms in renter-occupied apartments in Bainbridge Island, Washington
- 145no bedroom
- 3981 bedroom
- 7872 bedrooms
- 3893 bedrooms
- 1724 bedrooms
- 135+ bedrooms
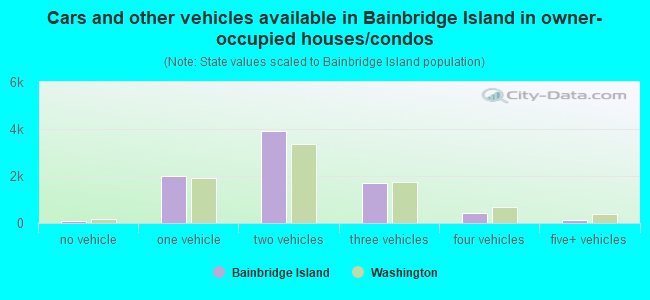
- Cars and other vehicles available in Bainbridge Island in owner-occupied houses/condos
- 84no vehicle
- 2,0121 vehicle
- 3,9312 vehicles
- 1,6873 vehicles
- 4144 vehicles
- 1155+ vehicles
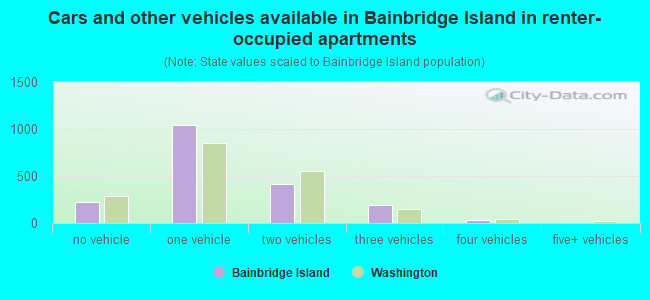
- Cars and other vehicles available in Bainbridge Island in renter-occupied apartments
- 219no vehicle
- 1,0471 vehicle
- 4162 vehicles
- 1953 vehicles
- 284 vehicles
- 05+ vehicles
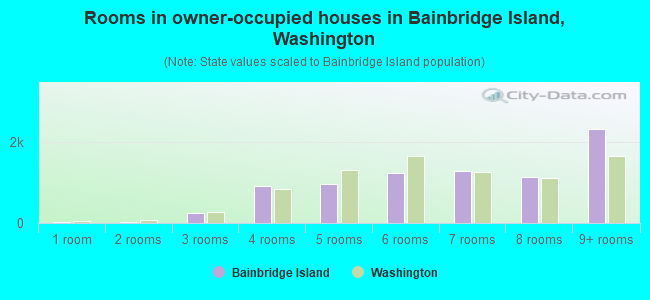
- Rooms in owner-occupied houses in Bainbridge Island, Washington
- 331 room
- 352 rooms
- 2543 rooms
- 9104 rooms
- 9795 rooms
- 1,2466 rooms
- 1,3017 rooms
- 1,1528 rooms
- 2,3349+ rooms
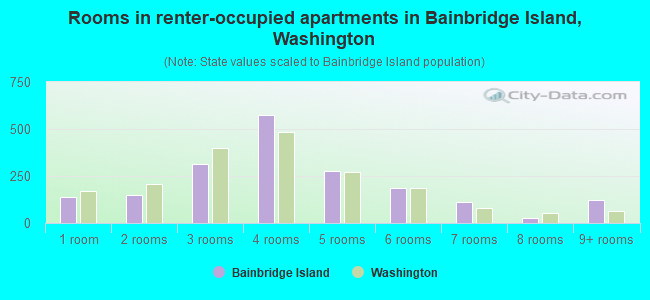
- Rooms in renter-occupied apartments in Bainbridge Island, Washington
- 1381 room
- 1482 rooms
- 3163 rooms
- 5754 rooms
- 2755 rooms
- 1866 rooms
- 1147 rooms
- 278 rooms
- 1259+ rooms
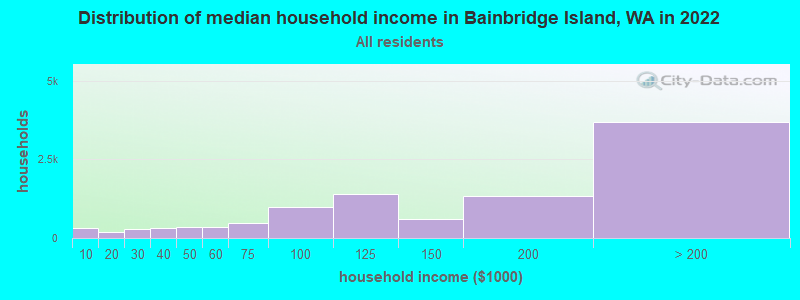
Bainbridge Island, WA household income distribution

- 302Less than $10,000
- 189$10,000 to $19,999
- 274$20,000 to $29,999
- 312$30,000 to $39,999
- 358$40,000 to $49,999
- 340$50,000 to $59,999
- 476$60,000 to $74,999
- 976$75,000 to $99,999
- 1,389$100,000 to $124,999
- 603$125,000 to $149,999
- 1,327$150,000 to $199,999
- 3,683$200,000 or more
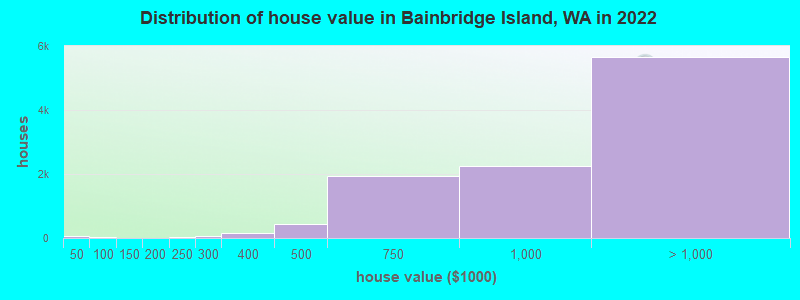
Home value of owner - occupied houses in 2022 in Bainbridge Island, WA
-
- 55Less than $10,000
- 9$50,000 to $59,999
- 22$60,000 to $69,999
- 3$90,000 to $99,999
- 10$125,000 to $149,999
- 8$175,000 to $199,999
- 25$200,000 to $249,999
- 64$250,000 to $299,999
- 143$300,000 to $399,999
- 451$400,000 to $499,999
- 1,953$500,000 to $749,999
- 2,257$750,000 to $999,999
- 2,869$1,000,000 to $1,499,999
- 1,929$1,500,000 to $1,999,999
- 846$2,000,000 or more
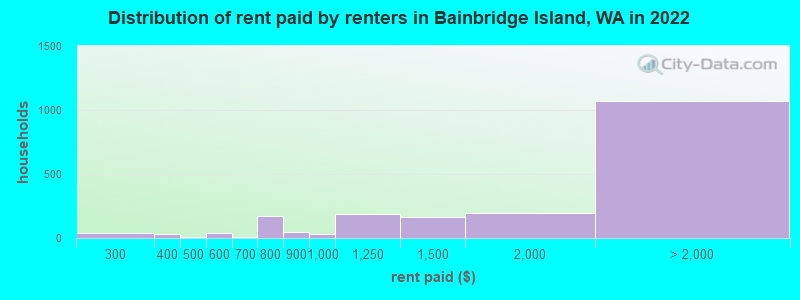
Rent paid by renters in 2022 in Bainbridge Island, WA
-
- 42$200 to $249
- 21$300 to $349
- 13$350 to $399
- 5$450 to $499
- 38$500 to $549
- 10$650 to $699
- 115$700 to $749
- 58$750 to $799
- 45$800 to $899
- 33$900 to $999
- 184$1,000 to $1,249
- 167$1,250 to $1,499
- 194$1,500 to $1,999
- 529$2,000 to $2,499
- 290$2,500 to $2,999
- 106$3,000 to $3,499
- 97$3,500 or more
- 45No cash rent
Percentage of workers working in this county: 78.0%
Number of people working at home: 4,113 (36.4% of all workers)
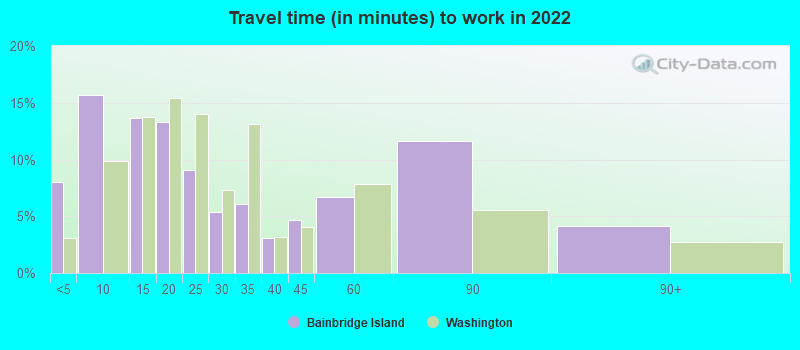
Travel time to work (commute)
- Less than 5 minutes: 577
- 5 to 9 minutes: 1,195
- 10 to 14 minutes: 963
- 15 to 19 minutes: 837
- 20 to 24 minutes: 298
- 25 to 29 minutes: 165
- 30 to 34 minutes: 358
- 35 to 39 minutes: 65
- 40 to 44 minutes: 201
- 45 to 59 minutes: 625
- 60 to 89 minutes: 1,200
- 90 or more minutes: 1,097
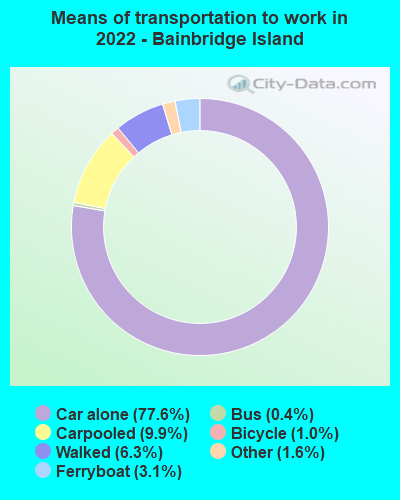
Means of transportation to work:
- Drove a car alone: 5,486 (50.4%)
- Carpooled: 940 (8.6%)
- Bus: 12 (0.1%)
- Ferryboat: 193 (1.8%)
- Taxi: 135 (1.2%)
- Bicycle: 78 (0.7%)
- Walked: 438 (4.0%)
- Worked at home: 4,113 (37.8%)
- Unemployment by race in 2022
- Unemployment rate for White non-Hispanic residents
- 2.1%Males
- 3.4%Females
- Unemployment rate for American Indian and Alaska Native residents
- 100.0%Females
- Unemployment rate for two or more race residents
- 7.3%Males
- 4.1%Females
- Unemployment rate for Hispanic or Latino residents
- 3.2%Females
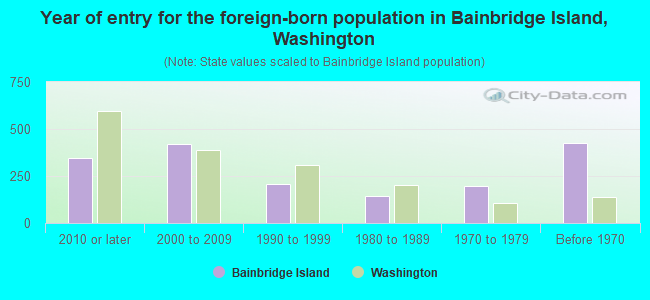
- Year of entry for the foreign-born population in Bainbridge Island, Washington
- 3462010 or later
- 4222000 to 2009
- 2071990 to 1999
- 1411980 to 1989
- 1971970 to 1979
- 427Before 1970
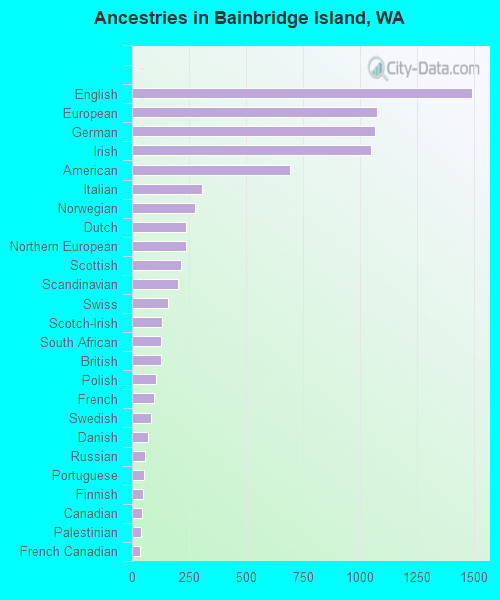
First ancestries reported:
- English: 1,492 (14.8%)
- European: 1,076 (10.7%)
- German: 1,066 (10.6%)
- Irish: 1,050 (10.4%)
- American: 695 (6.9%)
- Italian: 306 (3.0%)
- Norwegian: 277 (2.7%)
- Dutch: 238 (2.4%)
- Northern European: 236 (2.3%)
- Scottish: 216 (2.1%)
- Scandinavian: 202 (2.0%)
- Swiss: 158 (1.6%)
- Scotch-Irish: 133 (1.3%)
- South African: 129 (1.3%)
- British: 127 (1.3%)
- Polish: 107 (1.1%)
- French: 96 (1.0%)
- Swedish: 84 (0.8%)
- Danish: 72 (0.7%)
- Russian: 56 (0.6%)
- Portuguese: 54 (0.5%)
- Finnish: 48 (0.5%)
- Canadian: 43 (0.4%)
- Palestinian: 39 (0.4%)
- French Canadian: 37 (0.4%)
- Eastern European: 32 (0.3%)
- Austrian: 29 (0.3%)
- Croatian: 20 (0.2%)
- German Russian: 17 (0.2%)
- Celtic: 17 (0.2%)
- Belgian: 17 (0.2%)
- Lithuanian: 15 (0.1%)
- Israeli: 15 (0.1%)
- Ukrainian: 14 (0.1%)
- Welsh: 10 (0.10%)
- Arab: 9 (0.09%)
- Guyanese: 7 (0.07%)
- Slovene: 7 (0.07%)
- Latvian: 6 (0.06%)
- African: 1 (0.01%)
Most common places of birth for foreign-born residents (%):
| Bainbridge Island: | 13.3% (250) |
| Washington: | 4.1% (47,238) |
| Bainbridge Island: | 9.8% (185) |
| Washington: | 8.9% (101,353) |
| Bainbridge Island: | 8.0% (151) |
| Washington: | 0.3% (3,373) |
| Bainbridge Island: | 7.5% (142) |
| Washington: | 1.0% (10,943) |
| Bainbridge Island: | 7.0% (132) |
| Washington: | 21.1% (241,655) |
| Bainbridge Island: | 5.8% (110) |
| Washington: | 0.8% (9,457) |
| Bainbridge Island: | 5.1% (97) |
| Washington: | 6.3% (71,661) |
| Bainbridge Island: | 4.6% (86) |
| Washington: | 7.4% (84,470) |
| Bainbridge Island: | 4.0% (76) |
| Washington: | 1.6% (17,761) |
| Bainbridge Island: | 2.9% (55) |
| Washington: | 0.4% (4,951) |
| Bainbridge Island: | 2.8% (52) |
| Washington: | 0.6% (6,294) |
| Bainbridge Island: | 2.5% (48) |
| Washington: | 0.2% (2,551) |
| Bainbridge Island: | 2.4% (46) |
| Washington: | 1.5% (16,607) |
| Bainbridge Island: | 2.0% (38) |
| Washington: | 4.3% (48,886) |
| Bainbridge Island: | 2.0% (38) |
| Washington: | 0.4% (4,499) |
| Bainbridge Island: | 1.6% (30) |
| Washington: | 5.4% (62,003) |
| Bainbridge Island: | 1.5% (29) |
| Washington: | 0.2% (2,284) |
Place of birth for U.S.-born residents:
- This state: 8,394
- Other state: 13,898
- Northeast: 2,456
- Midwest: 3,540
- South: 3,117
- West: 4,917
86.4% of Bainbridge Island residents lived in the same house 1 years ago.
Out of people who lived in different houses, 25.2% lived in this county.
Out of people who lived in different counties, 48.8% lived in Washington.
| Bainbridge Island: | 86.4% |
| State average: | 85.2% |
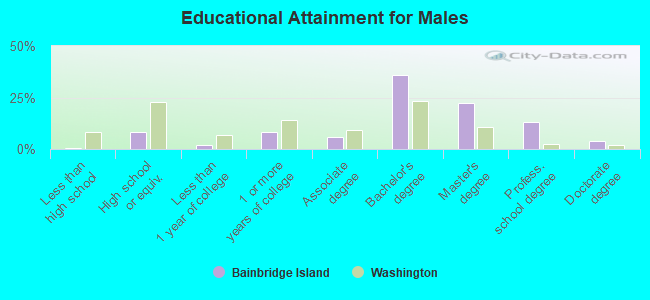
Education attainment for males 25 years and older:
- No schooling: 25
- Nursery to 4th grade: 0
- 5th and 6th grade: 0
- 7th and 8th grade: 0
- 9th grade: 0
- 10th grade: 0
- 11th grade: 0
- 12th grade, no diploma: 9
- High school graduate (or equivalency): 769
- Less than 1 year of college: 197
- Some college more than 1 year, no degree: 753
- Associate degree: 553
- Bachelor's degree: 3,372
- Master's degree: 2,083
- Professional school degree: 1,228
- Doctorate degree: 384
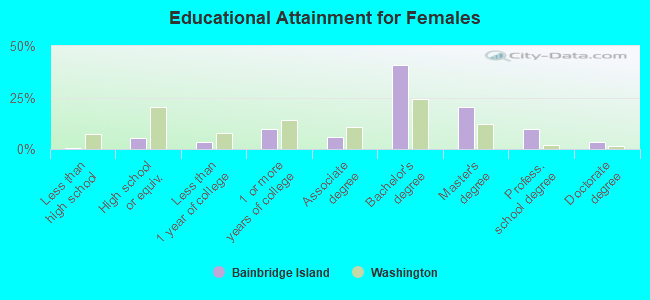
Education attainment for females 25 years and older:
- No schooling: 0
- Nursery to 4th grade: 0
- 5th and 6th grade: 0
- 7th and 8th grade: 19
- 9th grade: 0
- 10th grade: 0
- 11th grade: 11
- 12th grade, no diploma: 12
- High school graduate (or equivalency): 538
- Less than 1 year of college: 346
- Some college more than 1 year, no degree: 946
- Associate degree: 590
- Bachelor's degree: 4,023
- Master's degree: 2,011
- Professional school degree: 973
- Doctorate degree: 351
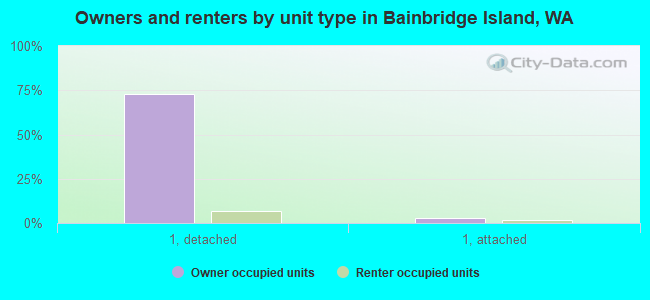
Housing units in structures:
- One, detached: 8,600
- One, attached: 547
- Two: 105
- 3 or 4: 274
- 5 to 9: 251
- 10 to 19: 344
- 20 to 49: 336
- 50 or more: 268
- Mobile homes: 199
Median worth of mobile homes: $272,136
Housing units lacking complete kitchen facilities in 2022: 0.9%
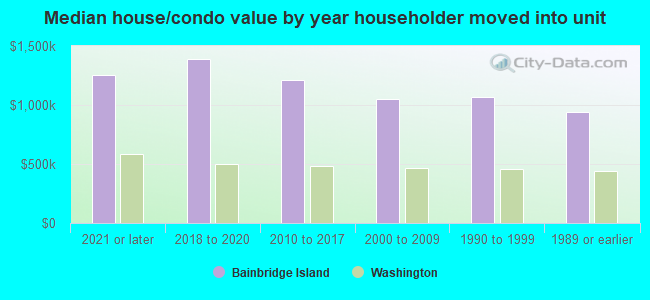
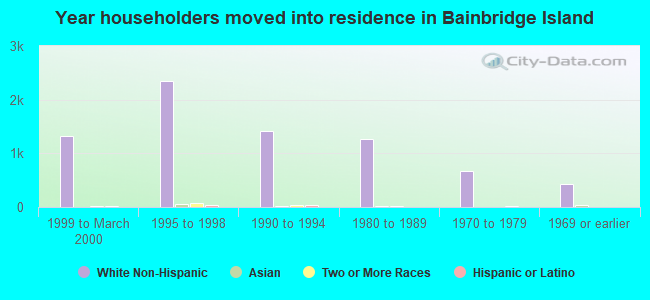
House/condo owner moved in on average 9 years ago
Renter moved in on average 5 years ago
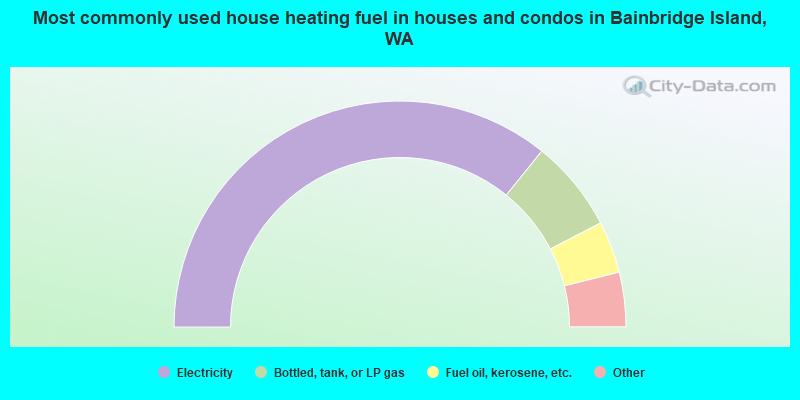
- 71.6%Electricity
- 13.2%Bottled, tank, or LP gas
- 7.4%Fuel oil, kerosene, etc.
- 3.3%Utility gas
- 2.6%Wood
- 0.8%Other fuel
- 0.6%Solar energy
- 0.3%Coal or coke
- 0.2%No fuel used
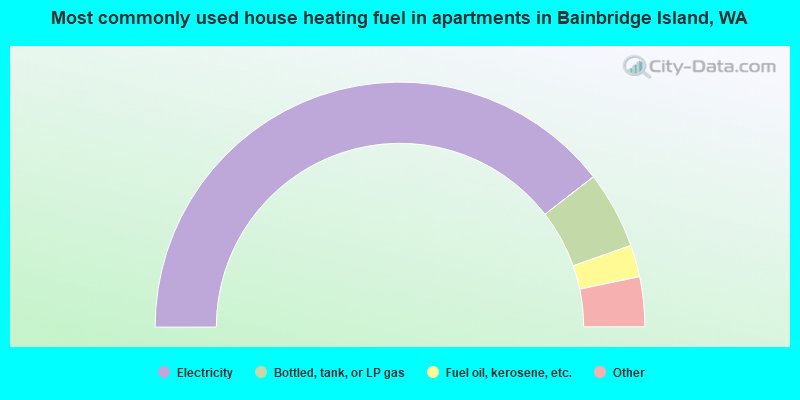
- 79.0%Electricity
- 10.2%Bottled, tank, or LP gas
- 4.2%Fuel oil, kerosene, etc.
- 1.9%Utility gas
- 1.8%No fuel used
- 1.7%Other fuel
- 1.1%Wood
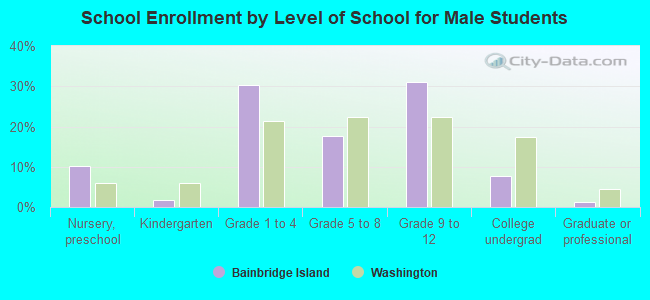
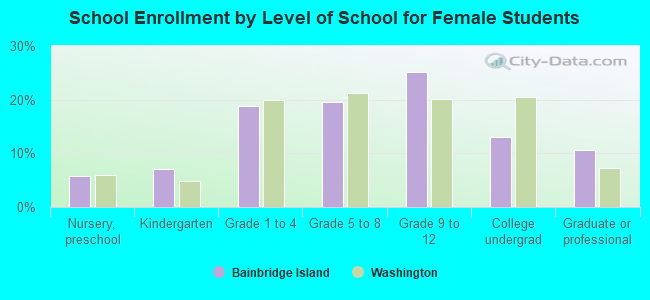
Private vs. public school enrollment:
| Here: | 22.8% |
| Washington: | 12.4% |
| Here: | 19.3% |
| Washington: | 9.2% |
| Here: | 28.2% |
| Washington: | 16.5% |