Baltimore, VT (Vermont) Houses and Residents
| Baltimore: | $249,160 |
| Vermont: | $304,700 |
Total population: 244 (Urban population: 0, Rural population: 285 (all nonfarm))
Houses: 113 (105 occupied: 78 owner occupied, 27 renter occupied)
| % of renters here: | 26% |
| State: | 26% |
Housing density: 24 houses/condos per square mile
Median price asked for vacant for-sale houses and condos in 2022 in this county: $201,418.
Median contract rent in 2022: $871 (lower quartile is $588, upper quartile is $955)
Median gross rent in Baltimore, VT in 2022: $1,116
Housing units in Baltimore with a mortgage: 28 (2 second mortgage, 4 home equity loan, 0 both second mortgage and home equity loan)
Houses without a mortgage: 7


Latest news about housing in Baltimore, VT collected exclusively by city-data.com from local newspapers, TV, and radio stations

 | Relocating to Vermont...need the down and dirty, please (62 replies) |
| In search of a mountain town... (32 replies) |
| Retire to Vermont (39 replies) |
| Considering a move to VT from MD (27 replies) |
| 55 years in VT, first 'home defence' weapons. (18 replies) |
| Hippie Culture in Vermont (33 replies) |

Household type by relationship:
Households: 55,772- In family households: 44,133 (10,625 male householders, 4,795 female householders)
12,152 spouses, 13,426 children (12,313 natural, 493 adopted, 620 stepchildren), 648 grandchildren, 228 brothers or sisters, 332 parents, foster children, 269 other relatives, 1,434 non-relatives
- In nonfamily households: 11,639 (4,242 male householders (3,179 living alone)), 5,091 female householders (4,237 living alone)), 2,306 nonrelatives
- In group quarters: 898 (784 institutionalized population)
9,497 married couples with children.
3,067 single-parent households (795 men, 2,272 women).
98.9% of residents of Baltimore speak English at home.
1.1% of residents speak other Indo-European language at home (100% speak English not well).
Foreign born population: 3 (0.9%)
(0.0% of them are naturalized citizens)
| Here: | 5.3 |
| State: | 6.4 |
| Here: | 4.3 |
| State: | 3.9 |

- Bedrooms in owner-occupied houses and condos in Baltimore, Vermont
- 2no bedroom
- 51 bedroom
- 102 bedrooms
- 453 bedrooms
- 144 bedrooms
- 25+ bedrooms

- Bedrooms in renter-occupied apartments in Baltimore, Vermont
- 0no bedroom
- 71 bedroom
- 42 bedrooms
- 123 bedrooms
- 24 bedrooms
- 25+ bedrooms

- Cars and other vehicles available in Baltimore in owner-occupied houses/condos
- 0no vehicle
- 61 vehicle
- 512 vehicles
- 153 vehicles
- 64 vehicles
- 05+ vehicles

- Cars and other vehicles available in Baltimore in renter-occupied apartments
- 2no vehicle
- 131 vehicle
- 102 vehicles
- 23 vehicles
- 04 vehicles
- 05+ vehicles

- Rooms in owner-occupied houses in Baltimore, Vermont
- 21 room
- 02 rooms
- 23 rooms
- 104 rooms
- 255 rooms
- 166 rooms
- 147 rooms
- 28 rooms
- 79+ rooms

- Rooms in renter-occupied apartments in Baltimore, Vermont
- 01 room
- 02 rooms
- 73 rooms
- 44 rooms
- 65 rooms
- 26 rooms
- 67 rooms
- 28 rooms
- 09+ rooms


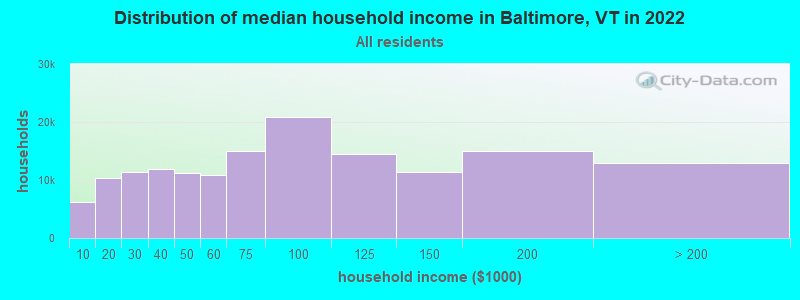
Baltimore, VT household income distribution

- 5,468Less than $10,000
- 11,164$10,000 to $19,999
- 12,817$20,000 to $29,999
- 14,919$30,000 to $39,999
- 13,837$40,000 to $49,999
- 13,483$50,000 to $59,999
- 17,946$60,000 to $74,999
- 27,163$75,000 to $99,999
- 17,987$100,000 to $124,999
- 14,360$125,000 to $149,999
- 18,235$150,000 to $199,999
- 16,472$200,000 or more
Percentage of workers working in this county: 88.6%
Number of people working at home: 30 (17.1% of all workers)
Travel time to work (commute)
- Less than 5 minutes: 0
- 5 to 9 minutes: 11
- 10 to 14 minutes: 40
- 15 to 19 minutes: 35
- 20 to 24 minutes: 36
- 25 to 29 minutes: 11
- 30 to 34 minutes: 15
- 35 to 39 minutes: 0
- 40 to 44 minutes: 3
- 45 to 59 minutes: 5
- 60 to 89 minutes: 0
- 90 or more minutes: 0
Means of transportation to work:
- Drove a car alone: 133 (82.6%)
- Carpooled: 22 (13.7%)
- Walked: 1 (0.6%)
- Worked at home: 5 (3.1%)


- Year of entry for the foreign-born population in Baltimore, Vermont
- 01995 to March 2000
- 01990 to 1994
- 31985 to 1989
- 01980 to 1984
- 01975 to 1979
- 01970 to 1974
- 01965 to 1969
- 0Before 1965

First ancestries reported:
- English: 60 (20.2%)
- French: 43 (14.5%)
- Irish: 43 (14.5%)
- Other: 36 (12.1%)
- French Canadian: 21 (7.1%)
- Scottish: 21 (7.1%)
- United States: 17 (5.7%)
- Polish: 16 (5.4%)
- German: 12 (4.0%)
- Italian: 7 (2.4%)
- Scotch-Irish: 6 (2.0%)
- Czech: 3 (1.0%)
- Norwegian: 3 (1.0%)
- West Indian: 3 (1.0%)
- Hungarian: 2 (0.7%)
- Swedish: 2 (0.7%)
- Welsh: 2 (0.7%)
Most common places of birth for foreign-born residents (%):
| Baltimore: | 100.0% (3) |
| Vermont: | 0.3% (67) |
Place of birth for U.S.-born residents:
- This state: 194
- Other state: 88
- Northeast: 73
- Midwest: 0
- South: 9
- West: 6
67% of Baltimore residents lived in the same house 5 years ago.
Out of people who lived in different houses, 77% lived in this county.
Out of people who lived in different counties, 45% lived in Vermont.
Education attainment for males 25 years and older:
- No schooling: 0
- Nursery to 4th grade: 0
- 5th and 6th grade: 0
- 7th and 8th grade: 4
- 9th grade: 4
- 10th grade: 4
- 11th grade: 5
- 12th grade, no diploma: 0
- High school graduate (or equivalency): 63
- Less than 1 year of college: 5
- Some college more than 1 year, no degree: 9
- Associate degree: 2
- Bachelor's degree: 3
- Master's degree: 0
- Professional school degree: 0
- Doctorate degree: 0

Education attainment for females 25 years and older:
- No schooling: 0
- Nursery to 4th grade: 0
- 5th and 6th grade: 0
- 7th and 8th grade: 3
- 9th grade: 3
- 10th grade: 0
- 11th grade: 2
- 12th grade, no diploma: 3
- High school graduate (or equivalency): 51
- Less than 1 year of college: 5
- Some college more than 1 year, no degree: 17
- Associate degree: 9
- Bachelor's degree: 4
- Master's degree: 6
- Professional school degree: 0
- Doctorate degree: 0


Housing units in structures:
- One, detached: 91
- Two: 10
- Mobile homes: 12
Median worth of mobile homes: $49,288

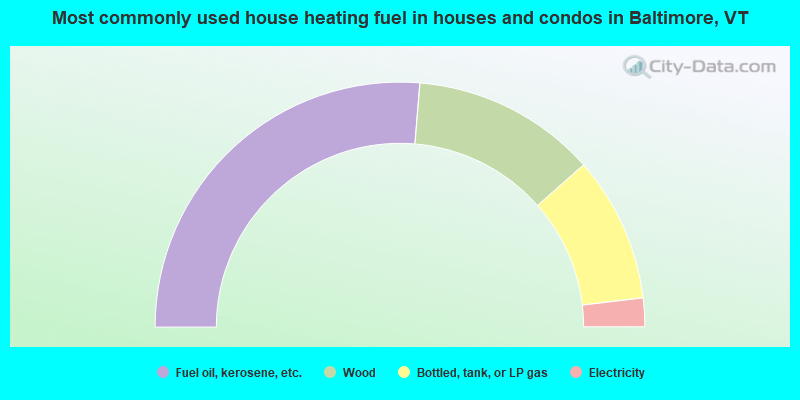
- 52.6%Fuel oil, kerosene, etc.
- 24.4%Wood
- 19.2%Bottled, tank, or LP gas
- 3.8%Electricity
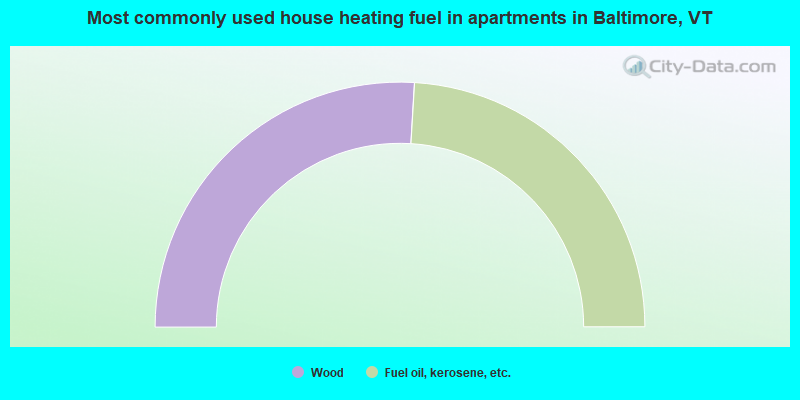
- 51.9%Wood
- 48.1%Fuel oil, kerosene, etc.
Private vs. public school enrollment:
| Here: | 5.0% |
| Vermont: | 7.2% |
| Here: | 16.7% |
| Vermont: | 10.4% |


