Baraboo, WI (Wisconsin) Houses and Residents
| Baraboo: | $218,867 |
| Wisconsin: | $252,800 |
Mean price in 2022:
Detached houses: $238,198
Here: $238,198 State: $308,468 Townhouses or other attached units: $254,355
Here: $254,355 State: $265,873 In 2-unit structures: $193,257
Here: $193,257 State: $203,667 Mobile homes: $31,573
Here: $31,573 State: $79,042
Total population: 12,085 (Urban population: 10,538 (all inside urban clusters), Rural population: 202 (all nonfarm))
Houses: 6,123 (5,811 occupied: 3,878 owner occupied, 2,057 renter occupied)
| % of renters here: | 35% |
| State: | 32% |
Housing density: 1,161 houses/condos per square mile
Median price asked for vacant for-sale houses and condos in 2022: $189,759.
Median contract rent in 2022: $800 (lower quartile is $641, upper quartile is $984)
Median rent asked for vacant for-rent units in 2022: $1,519
Median gross rent in Baraboo, WI in 2022: $952
Housing units in Baraboo with a mortgage: 2,771 (363 second mortgage, 44 home equity loan, 318 both second mortgage and home equity loan)
Houses without a mortgage: 112
Median household income for houses/condos with a mortgage: $93,447
Median household income for apartments without a mortgage: $47,269
Median monthly housing costs: $1,072
Compare current foreclosures near Baraboo, WI:
| Photo | Address | Area | Beds / Baths | Price | Details |
|---|---|---|---|---|---|

|
#1
21st St
Baraboo, WI 53913
|
3,246 sq. feet
|
3 baths 5 beds |
show details | |

|
#2
Red Pine Rd
Baraboo, WI 53913
|
- sq. feet
|
- baths - beds |
show details | |

|
#3
21st St
Baraboo, WI 53913
|
- sq. feet
|
- baths - beds |
show details | |

|
#4
Moore St Lot 33
Baraboo, WI 53913
|
- sq. feet
|
- baths - beds |
show details | |

|
#5
Draper St Apt 2
Baraboo, WI 53913
|
- sq. feet
|
- baths - beds |
show details | |

|
#6
Parkside Ave, Apt 203
Baraboo, WI 53913
|
- sq. feet
|
- baths - beds |
show details | |

|
#7
W Pine St Apt 314
Baraboo, WI 53913
|
- sq. feet
|
- baths - beds |
show details | |

|
#8
1st Ave
Baraboo, WI 53913
|
- sq. feet
|
- baths - beds |
show details | |

|
#9
Berkley Blvd
Baraboo, WI 53913
|
- sq. feet
|
- baths - beds |
show details | |

|
#10
County Road A Lot 49
Baraboo, WI 53913
|
- sq. feet
|
- baths - beds |
show details |
| Photo | Address | Area | Beds / Baths | Price | Details |
|---|---|---|---|---|---|

|
#11
Winnebago Cir Apt 3
Baraboo, WI 53913
|
- sq. feet
|
- baths - beds |
show details | |

|
#12
County Road A Lot 57
Baraboo, WI 53913
|
- sq. feet
|
- baths - beds |
show details | |

|
#13
Berry Hill Ct
Baraboo, WI 53913
|
- sq. feet
|
- baths - beds |
show details | |

|
#14
Moore St Lot 463
Baraboo, WI 53913
|
- sq. feet
|
- baths - beds |
show details | |

|
#15
7th Ave
Baraboo, WI 53913
|
- sq. feet
|
- baths - beds |
show details | |

|
#16
County Road U
Baraboo, WI 53913
|
- sq. feet
|
- baths - beds |
show details | |

|
#17
14th Ave
Baraboo, WI 53913
|
- sq. feet
|
- baths - beds |
show details | |

|
#18
9th St
Baraboo, WI 53913
|
- sq. feet
|
- baths - beds |
show details | |

|
#19
Lake St
Baraboo, WI 53913
|
- sq. feet
|
- baths - beds |
show details | |

|
#20
Whitetail Blvd
Baraboo, WI 53913
|
- sq. feet
|
- baths - beds |
show details |
| Photo | Address | Area | Beds / Baths | Price | Details |
|---|---|---|---|---|---|

|
#21
Elm St
Baraboo, WI 53913
|
- sq. feet
|
- baths - beds |
show details | |

|
#22
Lynn Ave
Baraboo, WI 53913
|
- sq. feet
|
- baths - beds |
show details | |

|
#23
Mound St
Baraboo, WI 53913
|
- sq. feet
|
- baths - beds |
show details | |

|
#24
3rd Ave
Baraboo, WI 53913
|
- sq. feet
|
- baths - beds |
show details | |

|
#25
2nd Ave
Baraboo, WI 53913
|
- sq. feet
|
- baths - beds |
show details | |

|
#26
Springbrook Dr
Baraboo, WI 53913
|
- sq. feet
|
- baths - beds |
show details | |

|
#27
Tyler Ave
Baraboo, WI 53913
|
- sq. feet
|
- baths - beds |
show details | |

|
#28
State Rd
Wisconsin Dells, WI 53965
|
2,580 sq. feet
|
1 baths 3 beds |
show details | |

|
#29
County Road Y
Mazomanie, WI 53560
|
1,080 sq. feet
|
1 baths 2 beds |
show details | |

|
#30
Us Highway 12 Lot T-6
North Freedom, WI 53951
|
- sq. feet
|
- baths - beds |
show details |
| Photo | Address | Area | Beds / Baths | Price | Details |
|---|---|---|---|---|---|

|
#31
Us Highway 12 Lot K-17
North Freedom, WI 53951
|
- sq. feet
|
- baths - beds |
show details | |

|
#32
Rezin Ct
Reedsburg, WI 53959
|
- sq. feet
|
- baths - beds |
show details | |

|
#33
Airport Rd # 9
Portage, WI 53901
|
- sq. feet
|
- baths - beds |
show details | |

|
#34
Cottontail Ln, Apt 10
Reedsburg, WI 53959
|
- sq. feet
|
- baths - beds |
show details | |

|
#35
Keenan Ct, Unit A
Reedsburg, WI 53959
|
- sq. feet
|
- baths - beds |
show details | |

|
#36
E Main St
Reedsburg, WI 53959
|
- sq. feet
|
- baths - beds |
show details | |

|
#37
Plum St Apt 3
Reedsburg, WI 53959
|
- sq. feet
|
- baths - beds |
show details | |

|
#38
Hemlock Dr
Reedsburg, WI 53959
|
- sq. feet
|
- baths - beds |
show details | |

|
#39
N Pine St
Reedsburg, WI 53959
|
- sq. feet
|
- baths - beds |
show details | |

|
#40
12th St Apt 902
Prairie Du Sac, WI 53578
|
- sq. feet
|
- baths - beds |
show details |
| Photo | Address | Area | Beds / Baths | Price | Details |
|---|---|---|---|---|---|

|
#41
Hemlock St, Lot 11
Poynette, WI 53955
|
- sq. feet
|
- baths - beds |
show details | |

|
#42
County Road V
Reedsburg, WI 53959
|
- sq. feet
|
- baths - beds |
show details | |

|
#43
Oakglen Cir
Lyndon Station, WI 53944
|
- sq. feet
|
- baths - beds |
show details | |

|
#44
Clark St
Reedsburg, WI 53959
|
- sq. feet
|
- baths - beds |
show details | |

|
#45
N Preston Ave
Reedsburg, WI 53959
|
- sq. feet
|
- baths - beds |
show details | |

|
#46
W Collins St Apt 3
Portage, WI 53901
|
- sq. feet
|
- baths - beds |
show details | |

|
#47
W Slifer St Apt 205
Portage, WI 53901
|
- sq. feet
|
- baths - beds |
show details | |

|
#48
County Rd N
Wisconsin Dells, WI 53965
|
- sq. feet
|
- baths - beds |
show details | |

|
#49
E Cook St Apt 7
Portage, WI 53901
|
- sq. feet
|
- baths - beds |
show details | |

|
Check over 1 million property listings on Foreclosure.com!
|
browse all offers | |||

Latest news about housing in Baraboo, WI collected exclusively by city-data.com from local newspapers, TV, and radio stations

 | Why Are Baraboo Houses So Affordable? (12 replies) |
| Looking at houses in Madison's exurbs (3 replies) |
| Housing rentals in Baraboo (1 reply) |
| Baraboo, WI (4 replies) |
| Relocating from Milwaukee to Baraboo? (3 replies) |
| Looking for a home to buy in SaukCo (0 replies) |

Median year apartment built: 1983
Household type by relationship:
Households: 12,562- Male householders: 2,996 (972 living alone), Female householders: 2,740 (1,065 living alone)
2,269 spouses (2,142 opposite-sex spouses), 567 unmarried partners, (567 opposite-sex unmarried partners), 2,922 children (2,655 natural, 32 adopted, 234 stepchildren), 193 grandchildren, 110 brothers or sisters, 110 parents, 0 foster children, 41 other relatives, 276 non-relatives
- In group quarters: 334
Size of family households: 1,556 2-persons, 1,128 3-persons, 394 4-persons, 270 5-persons, 30 6-persons.
Size of nonfamily households: 2,184 1-person, 415 2-persons, 19 4-persons.
1,437 married couples with children.
718 single-parent households (260 men, 458 women).
94.1% of residents of Baraboo speak English at home.
3.1% of residents speak Spanish at home (78% speak English very well, 17% speak English well, 5% speak English not well).
1.9% of residents speak other Indo-European language at home (45% speak English very well, 39% speak English well, 17% speak English not well).
0.7% of residents speak Asian or Pacific Island language at home (73% speak English very well, 27% speak English well).
Foreign born population: 371 (3.0%)
(62.3% of them are naturalized citizens)
| Here: | 6.5 |
| State: | 6.5 |
| Here: | 3.8 |
| State: | 4.1 |

- Bedrooms in owner-occupied houses and condos in Baraboo, Wisconsin
- 0no bedroom
- 341 bedroom
- 6362 bedrooms
- 2,3203 bedrooms
- 7464 bedrooms
- 1415+ bedrooms

- Bedrooms in renter-occupied apartments in Baraboo, Wisconsin
- 139no bedroom
- 6571 bedroom
- 9392 bedrooms
- 2623 bedrooms
- 174 bedrooms
- 445+ bedrooms

- Cars and other vehicles available in Baraboo in owner-occupied houses/condos
- 109no vehicle
- 1,1481 vehicle
- 1,5192 vehicles
- 7563 vehicles
- 3064 vehicles
- 405+ vehicles

- Cars and other vehicles available in Baraboo in renter-occupied apartments
- 313no vehicle
- 1,1941 vehicle
- 4242 vehicles
- 903 vehicles
- 94 vehicles
- 275+ vehicles

- Rooms in owner-occupied houses in Baraboo, Wisconsin
- 01 room
- 02 rooms
- 463 rooms
- 4824 rooms
- 5715 rooms
- 9386 rooms
- 5997 rooms
- 5998 rooms
- 6449+ rooms

- Rooms in renter-occupied apartments in Baraboo, Wisconsin
- 1101 room
- 1072 rooms
- 5653 rooms
- 5374 rooms
- 2695 rooms
- 2106 rooms
- 1237 rooms
- 508 rooms
- 869+ rooms


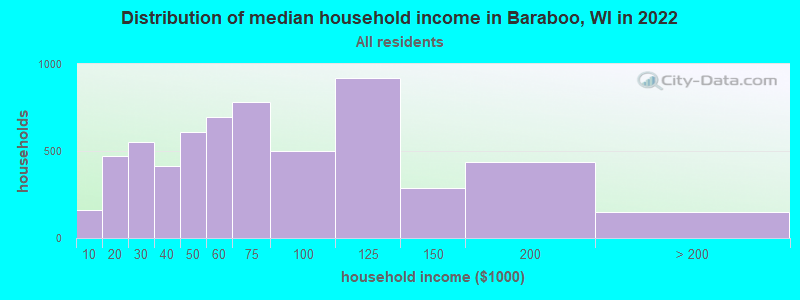
Baraboo, WI household income distribution

- 162Less than $10,000
- 473$10,000 to $19,999
- 551$20,000 to $29,999
- 412$30,000 to $39,999
- 612$40,000 to $49,999
- 695$50,000 to $59,999
- 784$60,000 to $74,999
- 501$75,000 to $99,999
- 920$100,000 to $124,999
- 286$125,000 to $149,999
- 438$150,000 to $199,999
- 148$200,000 or more
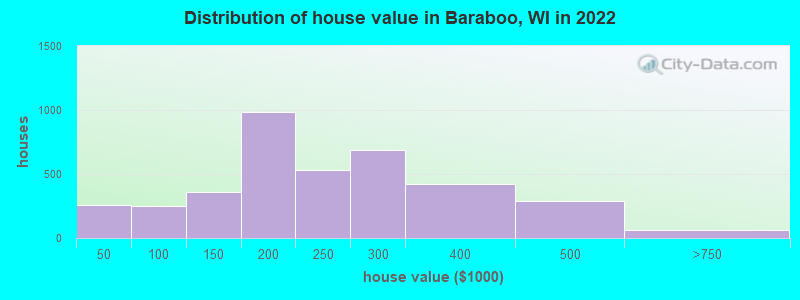
Home value of owner - occupied houses in 2022 in Baraboo, WI
-
- 19$10,000 to $14,999
- 28$15,000 to $19,999
- 42$20,000 to $24,999
- 45$25,000 to $29,999
- 80$30,000 to $34,999
- 39$40,000 to $49,999
- 44$50,000 to $59,999
- 83$60,000 to $69,999
- 5$70,000 to $79,999
- 54$80,000 to $89,999
- 25$90,000 to $99,999
- 91$100,000 to $124,999
- 264$125,000 to $149,999
- 642$150,000 to $174,999
- 343$175,000 to $199,999
- 529$200,000 to $249,999
- 683$250,000 to $299,999
- 423$300,000 to $399,999
- 287$400,000 to $499,999
- 58$500,000 to $749,999
Rent paid by renters in 2022 in Baraboo, WI
-
- 17Less than $100
- 32$150 to $199
- 113$250 to $299
- 80$300 to $349
- 15$350 to $399
- 78$400 to $449
- 58$450 to $499
- 53$550 to $599
- 122$600 to $649
- 174$650 to $699
- 202$700 to $749
- 121$750 to $799
- 326$800 to $899
- 256$900 to $999
- 322$1,000 to $1,249
- 29$1,250 to $1,499
- 6$1,500 to $1,999
- 15$2,000 to $2,499
- 1$3,000 to $3,499
- 17$3,500 or more


Percentage of workers working in this county: 74.9%
Number of people working at home: 796 (12.5% of all workers)
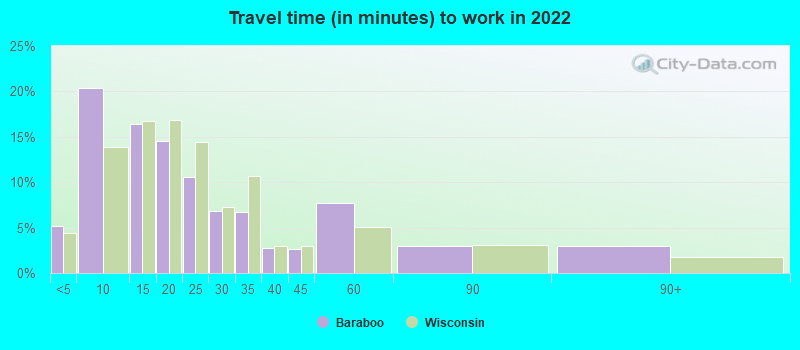
Travel time to work (commute)
- Less than 5 minutes: 289
- 5 to 9 minutes: 1,224
- 10 to 14 minutes: 612
- 15 to 19 minutes: 757
- 20 to 24 minutes: 613
- 25 to 29 minutes: 163
- 30 to 34 minutes: 462
- 35 to 39 minutes: 189
- 40 to 44 minutes: 321
- 45 to 59 minutes: 580
- 60 to 89 minutes: 293
- 90 or more minutes: 113
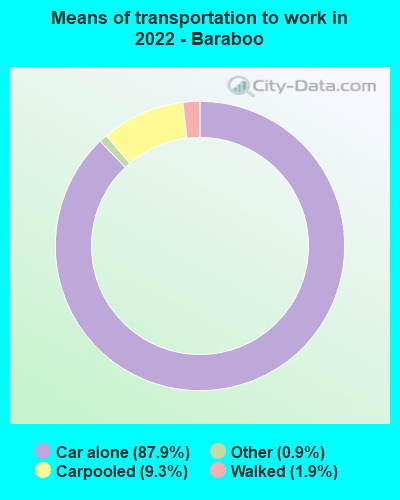
Means of transportation to work:
- Drove a car alone: 5,748 (77.3%)
- Carpooled: 682 (9.2%)
- Bus: 1 (0.0%)
- Taxi: 90 (1.2%)
- Bicycle: 5 (0.1%)
- Walked: 106 (1.4%)
- Worked at home: 796 (10.7%)

- Unemployment by race in 2022
- Unemployment rate for White non-Hispanic residents
- 4.2%Males
- 5.3%Females
- Unemployment rate for other race residents
- 31.6%Females
- Unemployment rate for two or more race residents
- 7.3%Males
- Unemployment rate for Hispanic or Latino residents
- 7.7%Males
- 10.3%Females

- Year of entry for the foreign-born population in Baraboo, Wisconsin
- 672010 or later
- 1452000 to 2009
- 501990 to 1999
- 211980 to 1989
- 101970 to 1979
- 101Before 1970

First ancestries reported:
- German: 1,518 (33.9%)
- American: 310 (6.9%)
- Norwegian: 235 (5.3%)
- English: 210 (4.7%)
- Polish: 208 (4.6%)
- European: 207 (4.6%)
- Irish: 195 (4.4%)
- Italian: 158 (3.5%)
- Dutch: 110 (2.5%)
- French: 70 (1.6%)
- Slovene: 46 (1.0%)
- Scottish: 45 (1.0%)
- Swedish: 39 (0.9%)
- Haitian: 34 (0.8%)
- Slovak: 30 (0.7%)
- Jamaican: 22 (0.5%)
- Pennsylvania German: 19 (0.4%)
- British: 17 (0.4%)
- French Canadian: 14 (0.3%)
- Ukrainian: 11 (0.2%)
- Czechoslovakian: 6 (0.1%)
- Russian: 6 (0.1%)
- Scandinavian: 3 (0.07%)
Most common places of birth for foreign-born residents (%):
| Baraboo: | 18.2% (52) |
| Wisconsin: | 0.2% (633) |
| Baraboo: | 16.4% (47) |
| Wisconsin: | 0.3% (953) |
| Baraboo: | 14.0% (40) |
| Wisconsin: | 1.5% (4,321) |
| Baraboo: | 12.2% (35) |
| Wisconsin: | 1.0% (3,036) |
| Baraboo: | 10.8% (31) |
| Wisconsin: | 29.5% (87,182) |
| Baraboo: | 6.6% (19) |
| Wisconsin: | 5.1% (15,165) |
| Baraboo: | 6.6% (19) |
| Wisconsin: | 0.5% (1,623) |
| Baraboo: | 4.2% (12) |
| Wisconsin: | 1.0% (2,903) |
| Baraboo: | 2.1% (6) |
| Wisconsin: | 1.3% (3,727) |
| Baraboo: | 1.7% (5) |
| Wisconsin: | 0.4% (1,039) |
Place of birth for U.S.-born residents:
- This state: 8,104
- Other state: 4,043
- Northeast: 301
- Midwest: 2,640
- South: 523
- West: 526
86.7% of Baraboo residents lived in the same house 1 years ago.
Out of people who lived in different houses, 34.3% lived in this county.
Out of people who lived in different counties, 72.7% lived in Wisconsin.
| Baraboo: | 86.7% |
| State average: | 87.7% |
Education attainment for males 25 years and older:
- No schooling: 45
- Nursery to 4th grade: 0
- 5th and 6th grade: 0
- 7th and 8th grade: 27
- 9th grade: 108
- 10th grade: 48
- 11th grade: 128
- 12th grade, no diploma: 91
- High school graduate (or equivalency): 1,330
- Less than 1 year of college: 180
- Some college more than 1 year, no degree: 900
- Associate degree: 618
- Bachelor's degree: 911
- Master's degree: 181
- Professional school degree: 30
- Doctorate degree: 29

Education attainment for females 25 years and older:
- No schooling: 16
- Nursery to 4th grade: 0
- 5th and 6th grade: 25
- 7th and 8th grade: 44
- 9th grade: 38
- 10th grade: 73
- 11th grade: 26
- 12th grade, no diploma: 99
- High school graduate (or equivalency): 1,127
- Less than 1 year of college: 312
- Some college more than 1 year, no degree: 784
- Associate degree: 717
- Bachelor's degree: 989
- Master's degree: 355
- Professional school degree: 52
- Doctorate degree: 0


Housing units in structures:
- One, detached: 3,464
- One, attached: 465
- Two: 361
- 3 or 4: 393
- 5 to 9: 441
- 10 to 19: 204
- 20 to 49: 301
- 50 or more: 128
- Mobile homes: 362
Median worth of mobile homes: $40,095
Housing units lacking complete kitchen facilities in 2022: 3.5%
House/condo owner moved in on average 10 years ago
Renter moved in on average 3 years ago

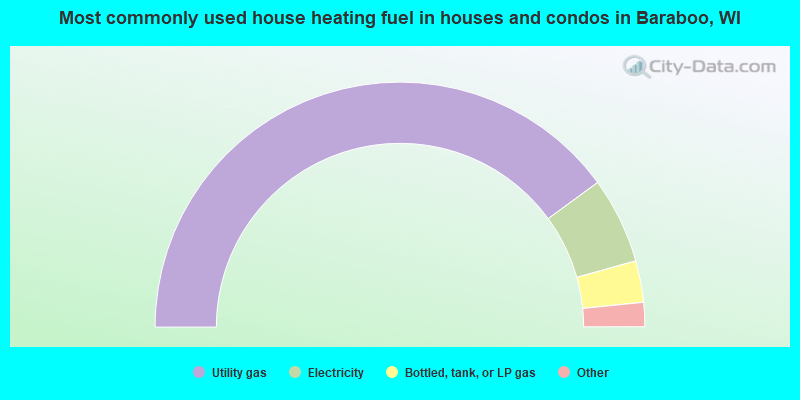
- 79.9%Utility gas
- 11.4%Electricity
- 5.5%Bottled, tank, or LP gas
- 1.7%Wood
- 1.5%Fuel oil, kerosene, etc.
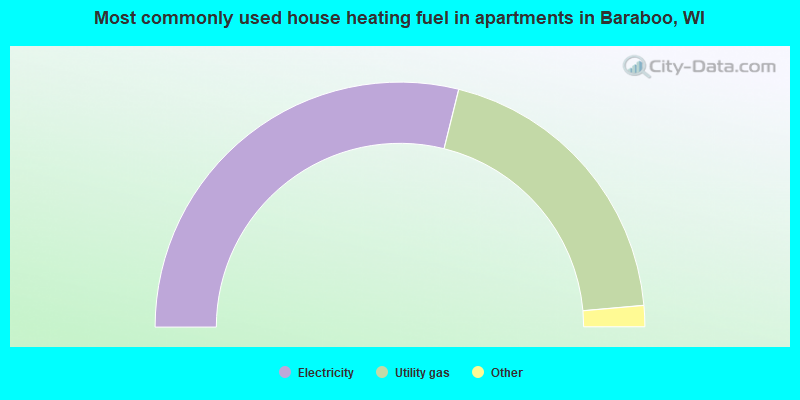
- 57.8%Electricity
- 39.5%Utility gas
- 1.0%Bottled, tank, or LP gas
- 1.0%Fuel oil, kerosene, etc.
- 0.8%Other fuel
Private vs. public school enrollment:
| Here: | 1.9% |
| Wisconsin: | 16.7% |
| Here: | 8.6% |
| Wisconsin: | 12.5% |
| Here: | 28.8% |
| Wisconsin: | 17.5% |


