Bay City, TX (Texas) Houses and Residents
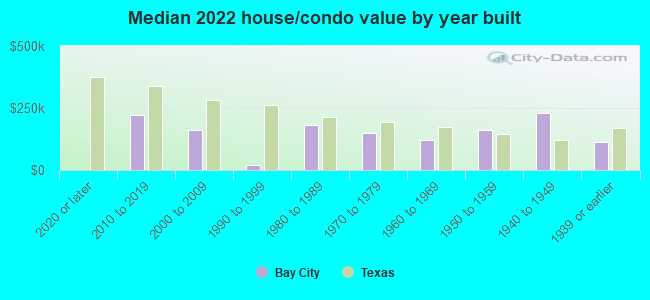
| Bay City: | $153,321 |
| Texas: | $275,400 |
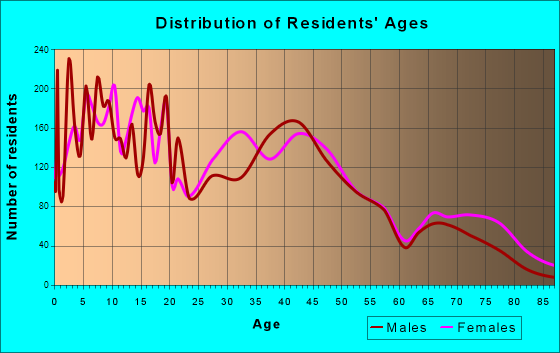
Total population: 17,368 (All urban)
Houses: 8,156 (6,949 occupied: 3,818 owner occupied, 3,235 renter occupied)
| % of renters here: | 46% |
| State: | 38% |
Housing density: 959 houses/condos per square mile
Median price asked for vacant for-sale houses and condos in 2022: $1,230,618.
Median contract rent in 2022: $823 (lower quartile is $601, upper quartile is $1,050)
Median rent asked for vacant for-rent units in 2022: $893
Median gross rent in Bay City, TX in 2022: $1,023
Housing units in Bay City with a mortgage: 1,277 (26 second mortgage, 24 home equity loan, 0 both second mortgage and home equity loan)
Houses without a mortgage: 111
Median household income for houses/condos with a mortgage: $78,881
Median household income for apartments without a mortgage: $66,155
Median monthly housing costs: $909
Compare current foreclosures near Bay City, TX:
| Photo | Address | Area | Beds / Baths | Price | Details |
|---|---|---|---|---|---|

|
#1
8th St
Bay City, TX 77414
|
1,384 sq. feet
|
2 baths 3 beds |
$239,900
|
show details |

|
#2
Leissner St
Bay City, TX 77414
|
2,378 sq. feet
|
2 baths 4 beds |
show details | |

|
#3
Avenue B
Bay City, TX 77414
|
1,388 sq. feet
|
3 baths 1 beds |
show details | |

|
#4
Walnut Dr
Bay City, TX 77414
|
1,972 sq. feet
|
2 baths 3 beds |
show details | |

|
#5
Avenue M
Bay City, TX 77414
|
- sq. feet
|
- baths - beds |
show details | |

|
#6
Nichols Ave
Bay City, TX 77414
|
- sq. feet
|
- baths - beds |
show details | |

|
#7
6th St
Bay City, TX 77414
|
1,245 sq. feet
|
- baths - beds |
show details | |

|
#8
Helen Ave
Bay City, TX 77414
|
- sq. feet
|
- baths - beds |
show details | |

|
#9
County Road 158
Bay City, TX 77414
|
- sq. feet
|
- baths - beds |
show details | |

|
#10
N Holly St
Sweeny, TX 77480
|
1,697 sq. feet
|
2 baths 4 beds |
show details |
| Photo | Address | Area | Beds / Baths | Price | Details |
|---|---|---|---|---|---|

|
#11
Texas Ave
Sweeny, TX 77480
|
3,103 sq. feet
|
3 baths - beds |
show details | |

|
#12
N Elm St
Sweeny, TX 77480
|
2,026 sq. feet
|
2 baths - beds |
show details | |

|
#13
Alice St
Sweeny, TX 77480
|
1,272 sq. feet
|
2 baths - beds |
show details | |

|
#14
County Road 3
Sweeny, TX 77480
|
1,887 sq. feet
|
2 baths - beds |
show details | |

|
#15
Sycamore St
Sweeny, TX 77480
|
- sq. feet
|
- baths - beds |
show details | |

|
#16
Fm 1301 Rd
Pledger, TX 77468
|
- sq. feet
|
- baths - beds |
show details | |

|
#17
Pecan St
Sweeny, TX 77480
|
- sq. feet
|
- baths - beds |
show details | |

|
#18
County Road 332
Sweeny, TX 77480
|
- sq. feet
|
- baths - beds |
show details | |

|
#19
Private Road 525
Sweeny, TX 77480
|
1,014 sq. feet
|
- baths - beds |
show details | |

|
Check over 1 million property listings on Foreclosure.com!
|
browse all offers | |||


 | Bay City - where to live? (9 replies) |
| Bay City and surrounding area? (13 replies) |
| Victoria Options for Retired Couple? (5 replies) |
| Curious..might there be a hungarian hangout in San Antonio (21 replies) |
| What is the Sharpstown area like? (152 replies) |
| Why is Montgomery County, Texas so conservative? (69 replies) |
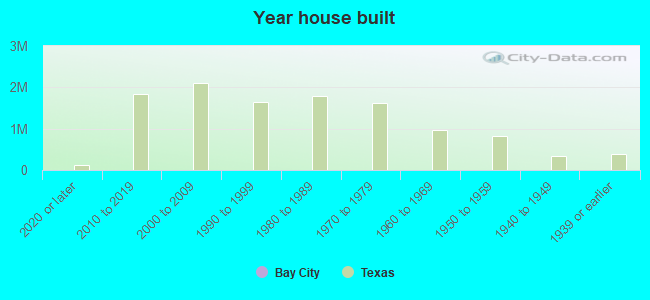
Median year apartment built: 1985
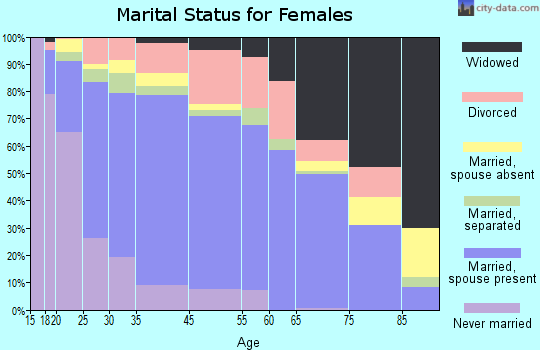
Household type by relationship:
Households: 18,349- Male householders: 3,300 (1,144 living alone), Female householders: 3,553 (1,060 living alone)
2,955 spouses (2,937 opposite-sex spouses), 246 unmarried partners, (246 opposite-sex unmarried partners), 6,327 children (5,774 natural, 402 adopted, 150 stepchildren), 700 grandchildren, 46 brothers or sisters, 180 parents, 0 foster children, 526 other relatives, 160 non-relatives
- In group quarters: 352
Size of family households: 1,933 2-persons, 1,212 3-persons, 656 4-persons, 408 5-persons, 258 6-persons, 150 7-or-more-persons.
Size of nonfamily households: 2,324 1-person, 121 2-persons.
2,680 married couples with children.
1,848 single-parent households (196 men, 1,652 women).
64.8% of residents of Bay City speak English at home.
33.2% of residents speak Spanish at home (74% speak English very well, 14% speak English well, 10% speak English not well, 2% don't speak English at all).
1.2% of residents speak other Indo-European language at home (84% speak English very well, 16% speak English well).
0.3% of residents speak Asian or Pacific Island language at home (100% speak English well).
0.2% of residents speak other language at home (100% speak English very well).
Foreign born population: 2,606 (14.2%)
(33.0% of them are naturalized citizens)
| Here: | 5.8 |
| State: | 6.3 |
| Here: | 4.2 |
| State: | 4.0 |
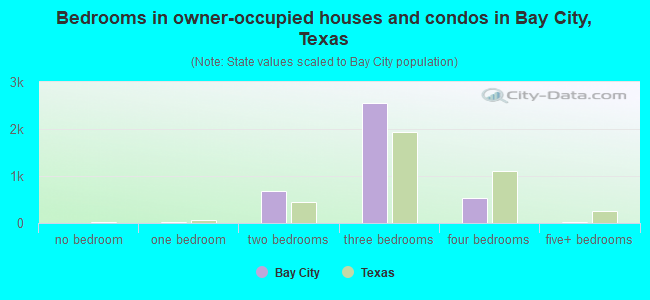
- Bedrooms in owner-occupied houses and condos in Bay City, Texas
- 0no bedroom
- 291 bedroom
- 6882 bedrooms
- 2,5443 bedrooms
- 5304 bedrooms
- 295+ bedrooms
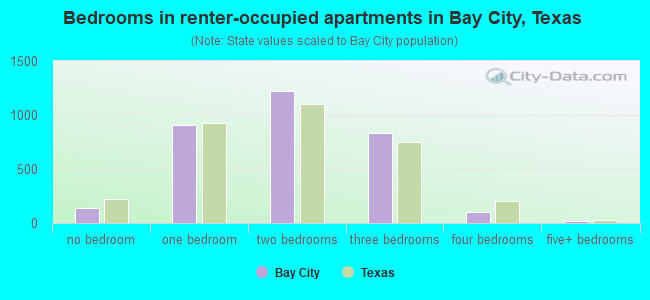
- Bedrooms in renter-occupied apartments in Bay City, Texas
- 143no bedroom
- 9071 bedroom
- 1,2242 bedrooms
- 8363 bedrooms
- 1054 bedrooms
- 215+ bedrooms
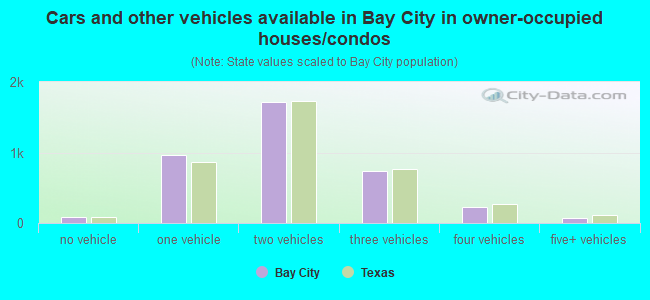
- Cars and other vehicles available in Bay City in owner-occupied houses/condos
- 91no vehicle
- 9651 vehicle
- 1,7192 vehicles
- 7403 vehicles
- 2334 vehicles
- 725+ vehicles
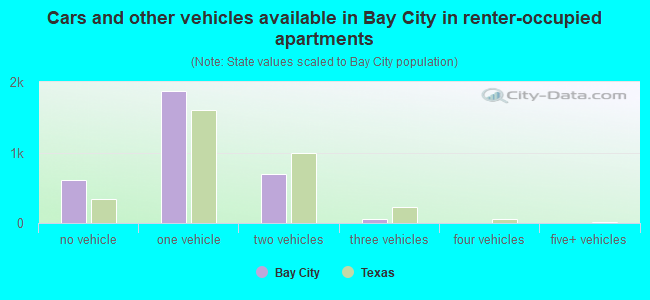
- Cars and other vehicles available in Bay City in renter-occupied apartments
- 611no vehicle
- 1,8761 vehicle
- 6932 vehicles
- 553 vehicles
- 04 vehicles
- 05+ vehicles
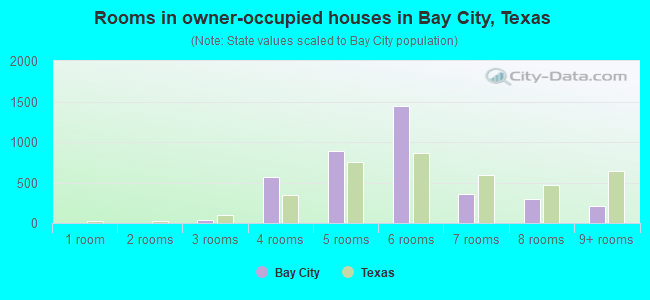
- Rooms in owner-occupied houses in Bay City, Texas
- 01 room
- 02 rooms
- 393 rooms
- 5734 rooms
- 8915 rooms
- 1,4446 rooms
- 3647 rooms
- 3008 rooms
- 2089+ rooms
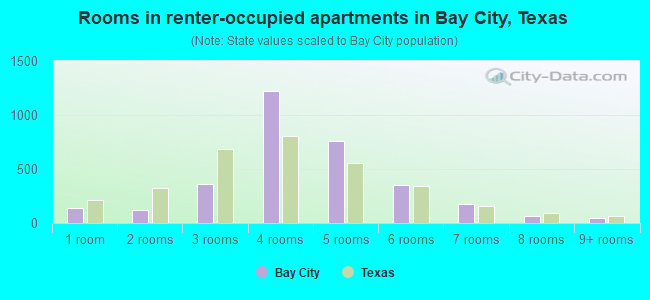
- Rooms in renter-occupied apartments in Bay City, Texas
- 1431 room
- 1162 rooms
- 3573 rooms
- 1,2184 rooms
- 7635 rooms
- 3556 rooms
- 1747 rooms
- 648 rooms
- 449+ rooms
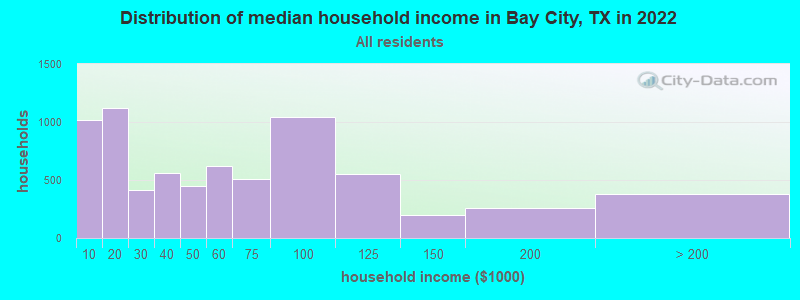
Bay City, TX household income distribution

- 1,015Less than $10,000
- 1,122$10,000 to $19,999
- 411$20,000 to $29,999
- 561$30,000 to $39,999
- 451$40,000 to $49,999
- 624$50,000 to $59,999
- 509$60,000 to $74,999
- 1,040$75,000 to $99,999
- 548$100,000 to $124,999
- 197$125,000 to $149,999
- 259$150,000 to $199,999
- 379$200,000 or more
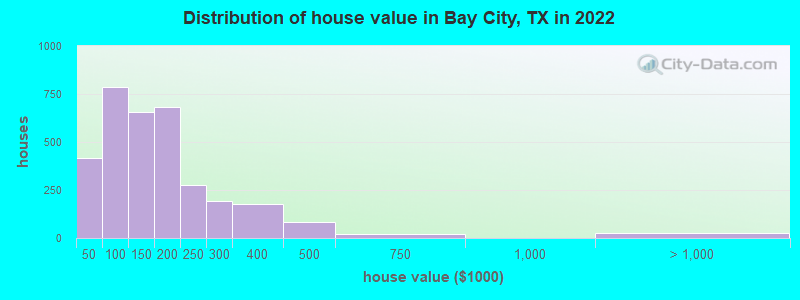
Home value of owner - occupied houses in 2022 in Bay City, TX
-
- 172Less than $10,000
- 59$10,000 to $14,999
- 100$15,000 to $19,999
- 12$20,000 to $24,999
- 23$25,000 to $29,999
- 12$35,000 to $39,999
- 36$40,000 to $49,999
- 174$50,000 to $59,999
- 137$60,000 to $69,999
- 84$70,000 to $79,999
- 210$80,000 to $89,999
- 144$90,000 to $99,999
- 321$100,000 to $124,999
- 332$125,000 to $149,999
- 402$150,000 to $174,999
- 280$175,000 to $199,999
- 274$200,000 to $249,999
- 194$250,000 to $299,999
- 177$300,000 to $399,999
- 82$400,000 to $499,999
- 18$500,000 to $749,999
- 12$1,000,000 to $1,499,999
- 13$2,000,000 or more
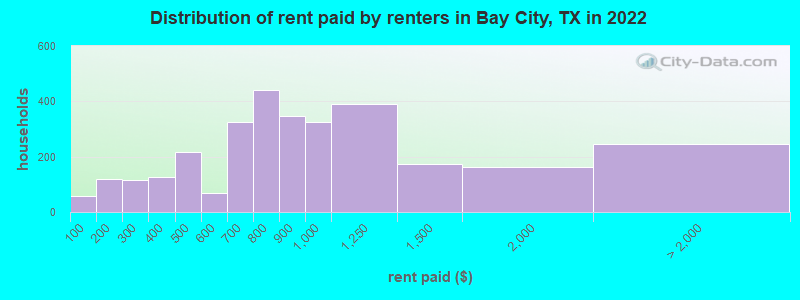
Rent paid by renters in 2022 in Bay City, TX
-
- 56Less than $100
- 97$100 to $149
- 21$150 to $199
- 44$200 to $249
- 68$250 to $299
- 56$300 to $349
- 69$350 to $399
- 141$400 to $449
- 76$450 to $499
- 44$500 to $549
- 26$550 to $599
- 8$600 to $649
- 315$650 to $699
- 160$700 to $749
- 279$750 to $799
- 347$800 to $899
- 325$900 to $999
- 389$1,000 to $1,249
- 171$1,250 to $1,499
- 162$1,500 to $1,999
- 26$2,000 to $2,499
- 6$2,500 to $2,999
- 45$3,500 or more
- 165No cash rent
Percentage of workers working in this county: 81.3%
Number of people working at home: 97 (1.4% of all workers)
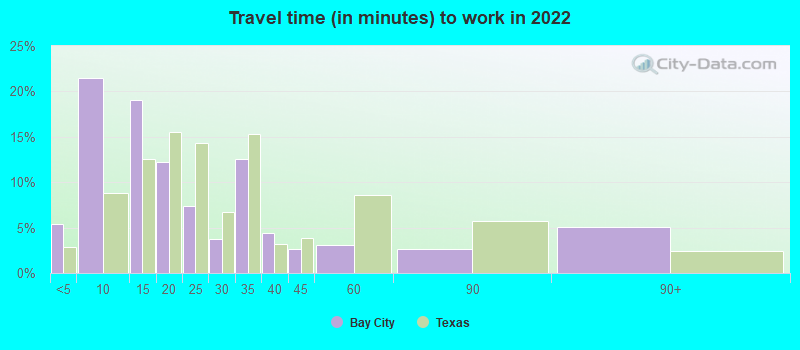
Travel time to work (commute)
- Less than 5 minutes: 231
- 5 to 9 minutes: 1,440
- 10 to 14 minutes: 1,247
- 15 to 19 minutes: 780
- 20 to 24 minutes: 1,026
- 25 to 29 minutes: 257
- 30 to 34 minutes: 485
- 35 to 39 minutes: 65
- 40 to 44 minutes: 114
- 45 to 59 minutes: 537
- 60 to 89 minutes: 191
- 90 or more minutes: 391
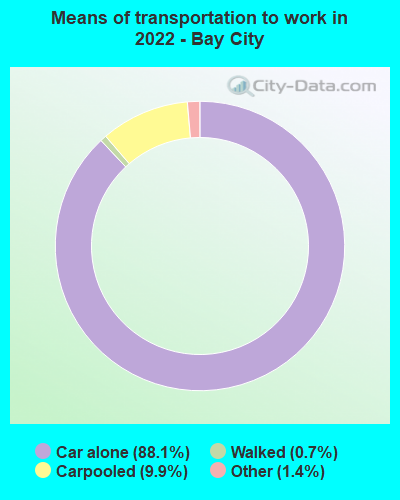
Means of transportation to work:
- Drove a car alone: 6,011 (82.7%)
- Carpooled: 732 (10.1%)
- Taxi: 116 (1.6%)
- Walked: 48 (0.7%)
- Worked at home: 97 (1.3%)
- Unemployment by race in 2022
- Unemployment rate for White non-Hispanic residents
- 2.7%Males
- 9.4%Females
- Unemployment rate for Black residents
- 28.8%Males
- 22.6%Females
- Unemployment rate for other race residents
- 3.0%Males
- 11.6%Females
- Unemployment rate for two or more race residents
- 9.4%Males
- 28.6%Females
- Unemployment rate for Hispanic or Latino residents
- 4.4%Males
- 14.2%Females
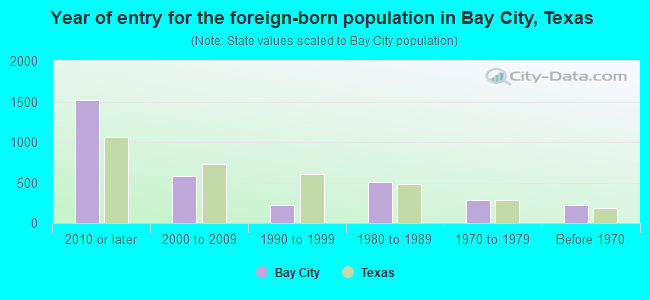
- Year of entry for the foreign-born population in Bay City, Texas
- 1,5182010 or later
- 5802000 to 2009
- 2241990 to 1999
- 5111980 to 1989
- 2861970 to 1979
- 222Before 1970
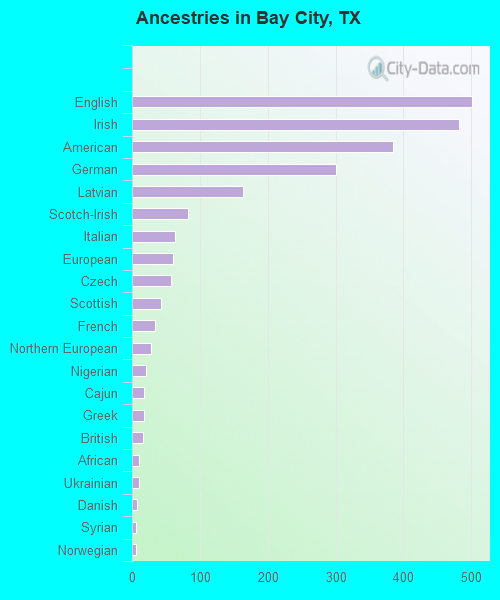
First ancestries reported:
- English: 501 (4.1%)
- Irish: 482 (3.9%)
- American: 385 (3.1%)
- German: 300 (2.4%)
- Latvian: 164 (1.3%)
- Scotch-Irish: 83 (0.7%)
- Italian: 64 (0.5%)
- European: 60 (0.5%)
- Czech: 57 (0.5%)
- Scottish: 42 (0.3%)
- French: 34 (0.3%)
- Northern European: 28 (0.2%)
- Nigerian: 20 (0.2%)
- Cajun: 18 (0.1%)
- Greek: 17 (0.1%)
- British: 16 (0.1%)
- African: 10 (0.08%)
- Ukrainian: 10 (0.08%)
- Danish: 8 (0.07%)
- Syrian: 6 (0.05%)
- Norwegian: 6 (0.05%)
- Polish: 3 (0.02%)
- Swedish: 3 (0.02%)
Most common places of birth for foreign-born residents (%):
| Bay City: | 69.3% (1,806) |
| Texas: | 48.4% (2,411,723) |
| Bay City: | 8.3% (216) |
| Texas: | 0.3% (16,984) |
| Bay City: | 4.5% (117) |
| Texas: | 0.2% (11,402) |
| Bay City: | 2.8% (73) |
| Texas: | 1.2% (62,159) |
| Bay City: | 2.1% (56) |
| Texas: | 0.6% (27,844) |
| Bay City: | 2.1% (56) |
| Texas: | 0.3% (15,833) |
| Bay City: | 1.8% (46) |
| Texas: | 0.3% (13,034) |
| Bay City: | 1.7% (45) |
| Texas: | 0.5% (26,969) |
Place of birth for U.S.-born residents:
- This state: 13,713
- Other state: 1,639
- Northeast: 205
- Midwest: 262
- South: 829
- West: 336
89.1% of Bay City residents lived in the same house 1 years ago.
Out of people who lived in different houses, 30.4% lived in this county.
Out of people who lived in different counties, 69.8% lived in Texas.
| Bay City: | 89.1% |
| State average: | 85.7% |
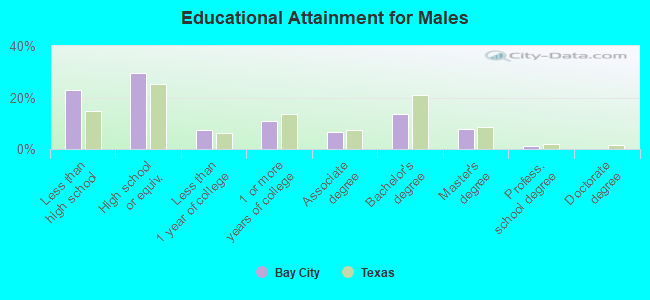
Education attainment for males 25 years and older:
- No schooling: 499
- Nursery to 4th grade: 20
- 5th and 6th grade: 180
- 7th and 8th grade: 80
- 9th grade: 108
- 10th grade: 186
- 11th grade: 108
- 12th grade, no diploma: 65
- High school graduate (or equivalency): 1,594
- Less than 1 year of college: 408
- Some college more than 1 year, no degree: 586
- Associate degree: 367
- Bachelor's degree: 733
- Master's degree: 411
- Professional school degree: 63
- Doctorate degree: 6
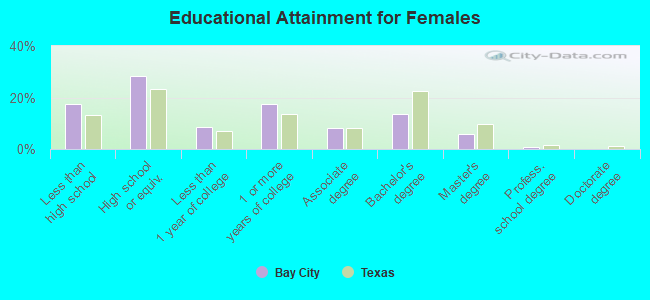
Education attainment for females 25 years and older:
- No schooling: 219
- Nursery to 4th grade: 88
- 5th and 6th grade: 169
- 7th and 8th grade: 16
- 9th grade: 149
- 10th grade: 71
- 11th grade: 153
- 12th grade, no diploma: 132
- High school graduate (or equivalency): 1,610
- Less than 1 year of college: 494
- Some college more than 1 year, no degree: 994
- Associate degree: 460
- Bachelor's degree: 773
- Master's degree: 342
- Professional school degree: 35
- Doctorate degree: 5
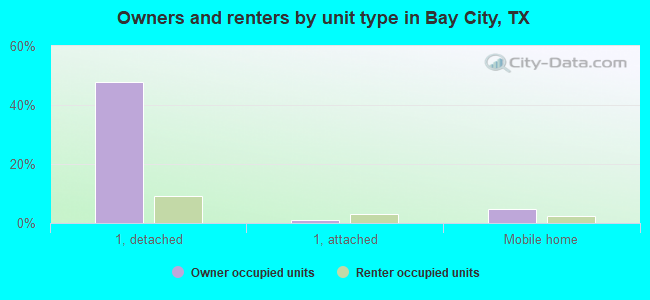
Housing units in structures:
- One, detached: 4,591
- One, attached: 279
- Two: 273
- 3 or 4: 696
- 5 to 9: 659
- 10 to 19: 617
- 20 to 49: 204
- 50 or more: 162
- Mobile homes: 672
Median worth of mobile homes: $19,249
Housing units lacking complete kitchen facilities in 2022: 4.2%
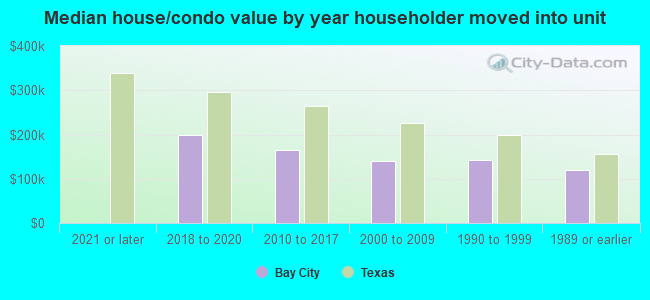
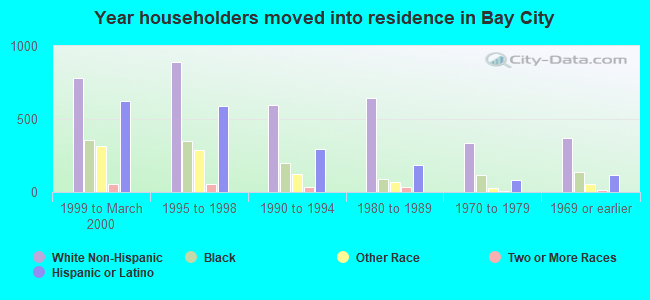
House/condo owner moved in on average 16 years ago
Renter moved in on average 4 years ago
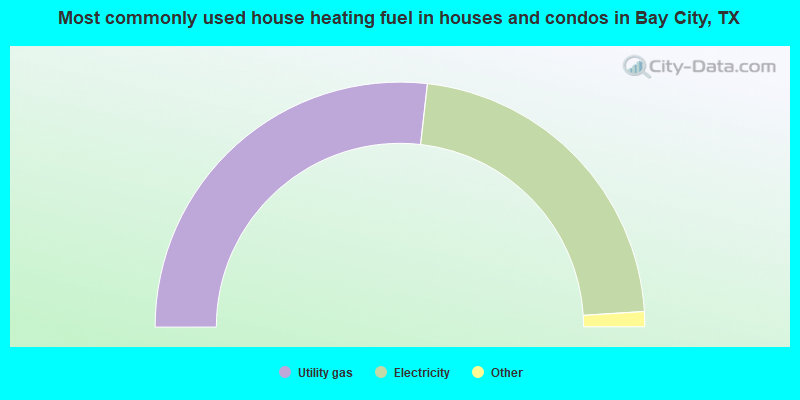
- 53.6%Utility gas
- 44.4%Electricity
- 1.4%No fuel used
- 0.6%Bottled, tank, or LP gas
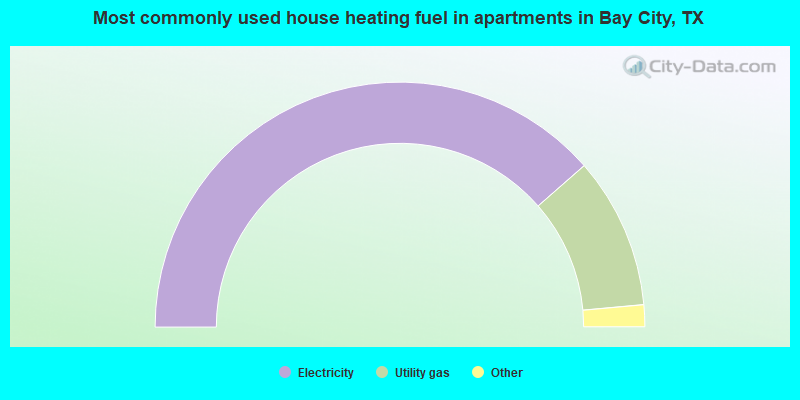
- 77.1%Electricity
- 20.0%Utility gas
- 2.0%No fuel used
- 0.8%Bottled, tank, or LP gas
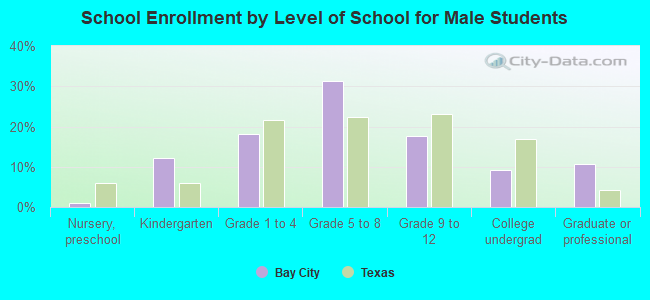
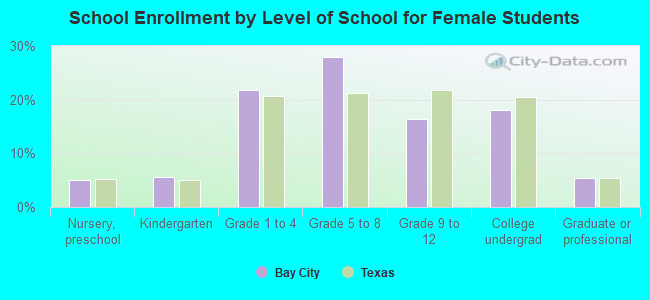
Private vs. public school enrollment:
| Here: | 4.2% |
| Texas: | 8.8% |
| Here: | 2.3% |
| Texas: | 8.0% |
| Here: | 23.1% |
| Texas: | 16.2% |