Bemidji, MN (Minnesota) Houses and Residents
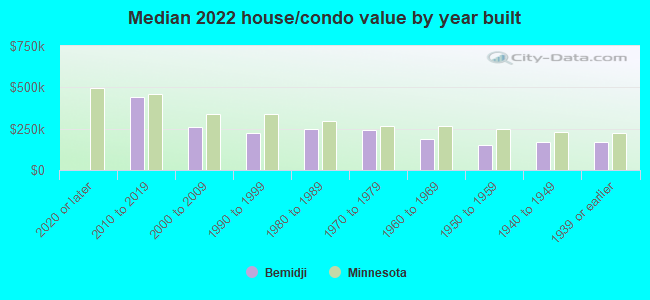
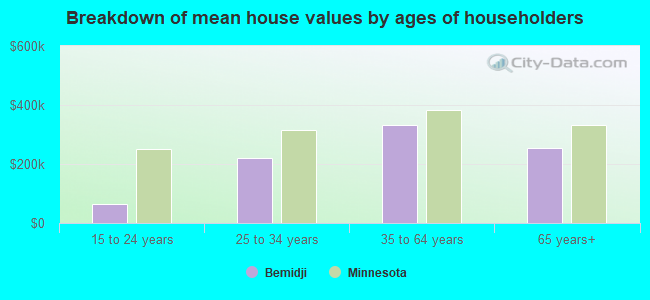
| Bemidji: | $193,608 |
| Minnesota: | $314,600 |
Total population: 14,453 (Urban population: 11,104 (all inside urban clusters), Rural population: 970 (all nonfarm))
Houses: 6,967 (6,590 occupied: 2,687 owner occupied, 3,952 renter occupied)
| % of renters here: | 60% |
| State: | 28% |
Housing density: 592 houses/condos per square mile
Median price asked for vacant for-sale houses and condos in 2022 in this county: $134,333.
Median contract rent in 2022: $890 (lower quartile is $662, upper quartile is $1,037)
Median rent asked for vacant for-rent units in 2022: $902
Median gross rent in Bemidji, MN in 2022: $972
Housing units in Bemidji with a mortgage: 1,355 (168 second mortgage, 0 home equity loan, 155 both second mortgage and home equity loan)
Houses without a mortgage: 37
Median household income for houses/condos with a mortgage: $75,413
Median household income for apartments without a mortgage: $55,610
Median monthly housing costs: $952
Compare current foreclosures near Bemidji, MN:
| Photo | Address | Area | Beds / Baths | Price | Details |
|---|---|---|---|---|---|

|
#1
Lakeview Dr SW
Bemidji, MN 56601
|
1,168 sq. feet
|
1 baths 2 beds |
show details | |

|
#2
Country Club Rd NE
Bemidji, MN 56601
|
2,960 sq. feet
|
1 baths 3 beds |
show details | |

|
#3
4th St SE
Bemidji, MN 56601
|
720 sq. feet
|
1 baths 2 beds |
show details | |

|
#4
Fireside Dr NW
Bemidji, MN 56601
|
2,046 sq. feet
|
2 baths 3 beds |
show details | |

|
#5
Rayne Ct
Bemidji, MN 56601
|
1,472 sq. feet
|
1 baths 3 beds |
show details | |

|
#6
Mountain Ash Ct NW
Bemidji, MN 56601
|
2,223 sq. feet
|
- baths - beds |
show details | |

|
#7
Peace Ln NW
Bemidji, MN 56601
|
1,064 sq. feet
|
- baths - beds |
show details | |

|
#8
26th St NW
Bemidji, MN 56601
|
1,008 sq. feet
|
- baths - beds |
show details | |

|
#9
34th St NW
Bemidji, MN 56601
|
- sq. feet
|
- baths - beds |
show details | |

|
#10
America Ave NW Apt 119
Bemidji, MN 56601
|
- sq. feet
|
- baths - beds |
show details |
| Photo | Address | Area | Beds / Baths | Price | Details |
|---|---|---|---|---|---|

|
#11
Old Willow Ct NW
Bemidji, MN 56601
|
1,456 sq. feet
|
- baths - beds |
show details | |

|
#12
Jackpine Rd NW
Bemidji, MN 56601
|
- sq. feet
|
- baths - beds |
show details | |

|
#13
30th St NW Apt 122
Bemidji, MN 56601
|
- sq. feet
|
- baths - beds |
show details | |

|
#14
Brinkman Dr NE
Bemidji, MN 56601
|
3,488 sq. feet
|
- baths - beds |
show details | |

|
#15
Gemmell Ave SW
Bemidji, MN 56601
|
384 sq. feet
|
- baths - beds |
show details | |

|
#16
Strand Lake Ln NE
Bemidji, MN 56601
|
- sq. feet
|
- baths - beds |
show details | |

|
#17
1st St E
Bemidji, MN 56601
|
770 sq. feet
|
- baths - beds |
show details | |

|
#18
Fireside Dr NW
Bemidji, MN 56601
|
- sq. feet
|
- baths - beds |
show details | |

|
#19
Sunset Dr
Solway, MN 56678
|
924 sq. feet
|
- baths 2 beds |
show details | |

|
#20
Wejack Rd
Cass Lake, MN 56633
|
1,144 sq. feet
|
- baths - beds |
show details |
| Photo | Address | Area | Beds / Baths | Price | Details |
|---|---|---|---|---|---|

|
#21
Gull Lake Loop Rd NE
Tenstrike, MN 56683
|
- sq. feet
|
- baths - beds |
show details | |

|
#22
1st St NW Apt 303
Cass Lake, MN 56633
|
- sq. feet
|
- baths - beds |
show details | |

|
#23
County 16
Laporte, MN 56461
|
- sq. feet
|
- baths - beds |
show details | |

|
#24
County 16
Laporte, MN 56461
|
- sq. feet
|
- baths - beds |
show details | |

|
Check over 1 million property listings on Foreclosure.com!
|
browse all offers | |||

Latest news about housing in Bemidji, MN collected exclusively by city-data.com from local newspapers, TV, and radio stations

 | Nice towns in Northern Minnesota? (47 replies) |
| Considering mive to Mn from Mt (6 replies) |
| Bemidji, Two harbors, Sauk Rapids (7 replies) |
| Brainerd, Bemidji, or Grand Rapids? (11 replies) |
| Thief River Falls area (3 replies) |
| Northern MN or the UP? (9 replies) |

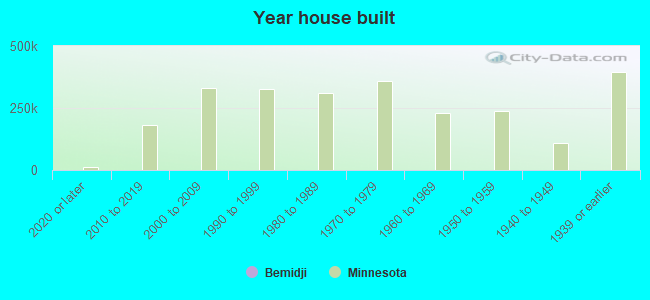
Median year apartment built: 1986
Household type by relationship:
Households: 15,500- Male householders: 2,826 (1,203 living alone), Female householders: 3,648 (1,602 living alone)
1,837 spouses (1,804 opposite-sex spouses), 657 unmarried partners, (633 opposite-sex unmarried partners), 3,199 children (3,151 natural, 17 adopted, 31 stepchildren), 311 grandchildren, 43 brothers or sisters, 12 parents, 145 foster children, 162 other relatives, 1,023 non-relatives
- In group quarters: 1,632
Size of family households: 1,184 2-persons, 730 3-persons, 529 4-persons, 218 5-persons, 83 6-persons, 105 7-or-more-persons.
Size of nonfamily households: 2,919 1-person, 593 2-persons, 151 3-persons, 80 4-persons, 27 5-persons.
1,451 married couples with children.
1,205 single-parent households (331 men, 874 women).
95.4% of residents of Bemidji speak English at home.
0.6% of residents speak Spanish at home (95% speak English very well, 5% speak English well).
0.6% of residents speak other Indo-European language at home (88% speak English very well, 12% speak English not well).
1.2% of residents speak Asian or Pacific Island language at home (45% speak English very well, 28% speak English well, 28% speak English not well).
2.0% of residents speak other language at home (71% speak English very well, 23% speak English well, 6% speak English not well).
Foreign born population: 342 (2.2%)
(39.8% of them are naturalized citizens)
| Here: | 6.8 |
| State: | 7.1 |
| Here: | 3.9 |
| State: | 3.8 |
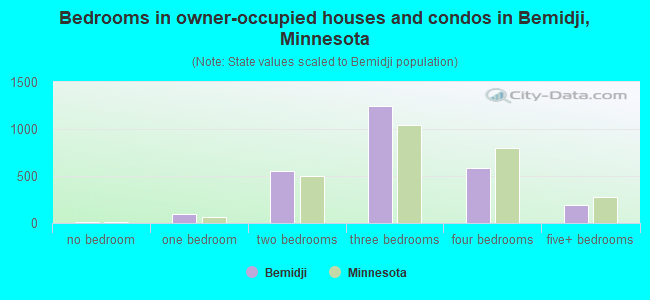
- Bedrooms in owner-occupied houses and condos in Bemidji, Minnesota
- 13no bedroom
- 1001 bedroom
- 5502 bedrooms
- 1,2403 bedrooms
- 5904 bedrooms
- 1955+ bedrooms
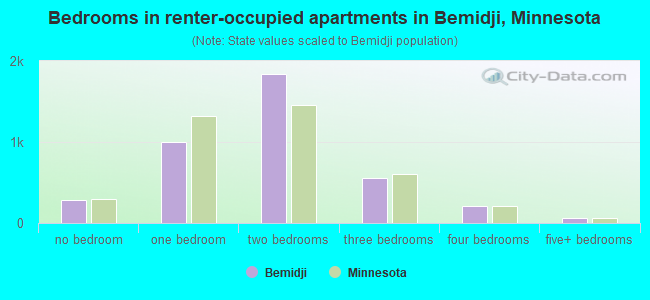
- Bedrooms in renter-occupied apartments in Bemidji, Minnesota
- 283no bedroom
- 9951 bedroom
- 1,8422 bedrooms
- 5593 bedrooms
- 2074 bedrooms
- 665+ bedrooms
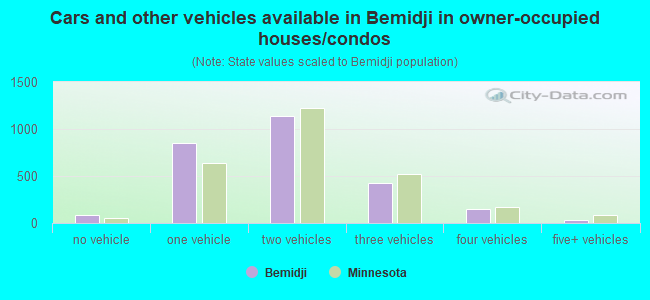
- Cars and other vehicles available in Bemidji in owner-occupied houses/condos
- 90no vehicle
- 8531 vehicle
- 1,1332 vehicles
- 4293 vehicles
- 1544 vehicles
- 285+ vehicles
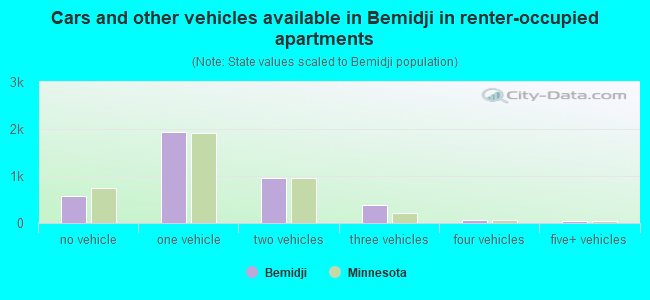
- Cars and other vehicles available in Bemidji in renter-occupied apartments
- 584no vehicle
- 1,9301 vehicle
- 9572 vehicles
- 3773 vehicles
- 714 vehicles
- 345+ vehicles
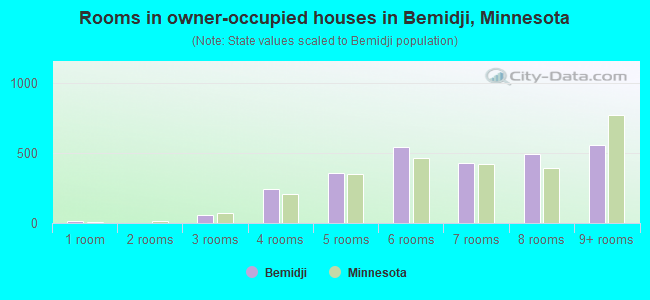
- Rooms in owner-occupied houses in Bemidji, Minnesota
- 131 room
- 02 rooms
- 563 rooms
- 2434 rooms
- 3605 rooms
- 5396 rooms
- 4257 rooms
- 4928 rooms
- 5599+ rooms
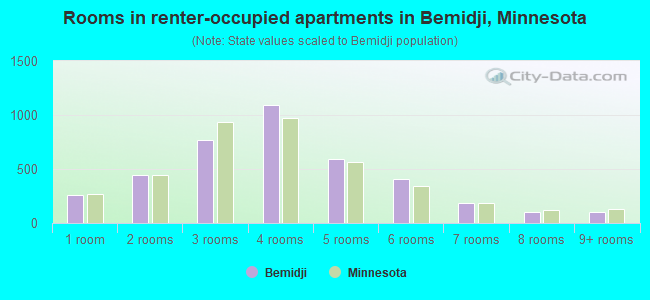
- Rooms in renter-occupied apartments in Bemidji, Minnesota
- 2591 room
- 4472 rooms
- 7643 rooms
- 1,0904 rooms
- 5915 rooms
- 4076 rooms
- 1877 rooms
- 1048 rooms
- 1049+ rooms
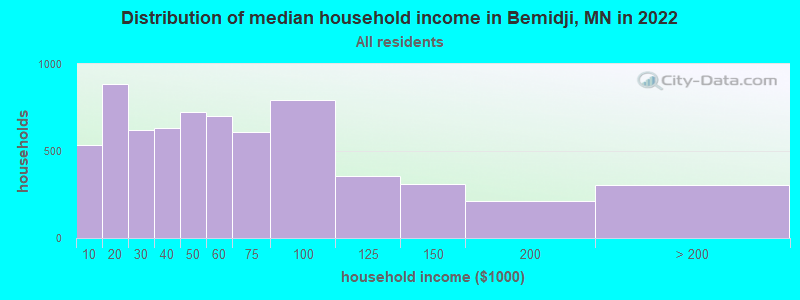
Bemidji, MN household income distribution

- 532Less than $10,000
- 886$10,000 to $19,999
- 622$20,000 to $29,999
- 633$30,000 to $39,999
- 727$40,000 to $49,999
- 704$50,000 to $59,999
- 612$60,000 to $74,999
- 794$75,000 to $99,999
- 358$100,000 to $124,999
- 310$125,000 to $149,999
- 215$150,000 to $199,999
- 302$200,000 or more
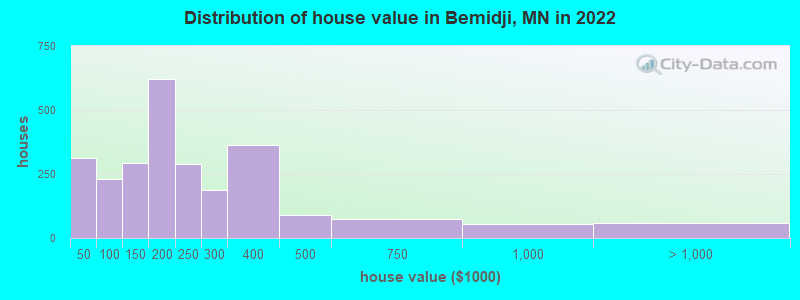
Home value of owner - occupied houses in 2022 in Bemidji, MN
-
- 96Less than $10,000
- 32$10,000 to $14,999
- 34$15,000 to $19,999
- 21$20,000 to $24,999
- 9$25,000 to $29,999
- 31$35,000 to $39,999
- 89$40,000 to $49,999
- 15$50,000 to $59,999
- 10$60,000 to $69,999
- 37$70,000 to $79,999
- 42$80,000 to $89,999
- 35$90,000 to $99,999
- 142$100,000 to $124,999
- 149$125,000 to $149,999
- 426$150,000 to $174,999
- 193$175,000 to $199,999
- 289$200,000 to $249,999
- 187$250,000 to $299,999
- 365$300,000 to $399,999
- 89$400,000 to $499,999
- 76$500,000 to $749,999
- 54$750,000 to $999,999
- 39$1,500,000 to $1,999,999
- 17$2,000,000 or more
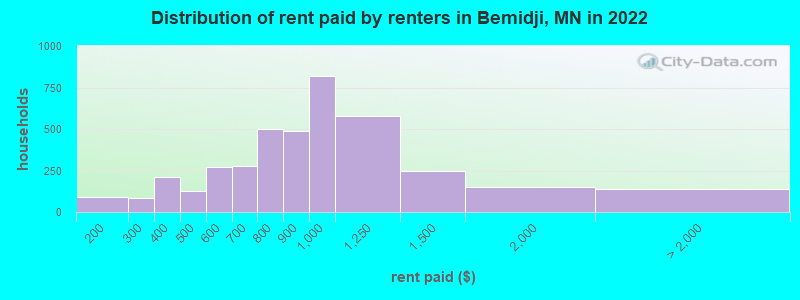
Rent paid by renters in 2022 in Bemidji, MN
-
- 88$150 to $199
- 36$200 to $249
- 45$250 to $299
- 38$300 to $349
- 170$350 to $399
- 60$400 to $449
- 65$450 to $499
- 157$500 to $549
- 112$550 to $599
- 214$600 to $649
- 65$650 to $699
- 358$700 to $749
- 143$750 to $799
- 489$800 to $899
- 817$900 to $999
- 576$1,000 to $1,249
- 244$1,250 to $1,499
- 152$1,500 to $1,999
- 10$2,000 to $2,499
- 53$3,000 to $3,499
- 76No cash rent
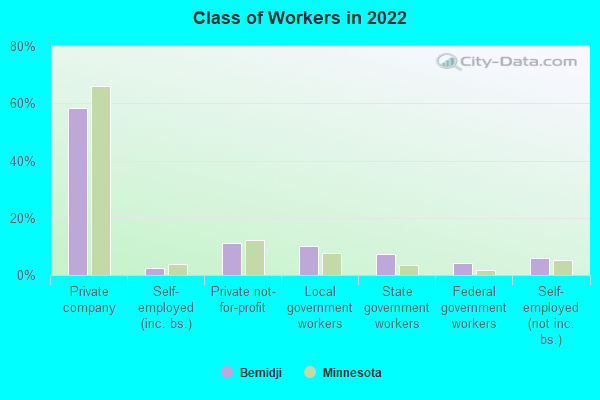
Percentage of workers working in this county: 87.0%
Number of people working at home: 692 (9.2% of all workers)
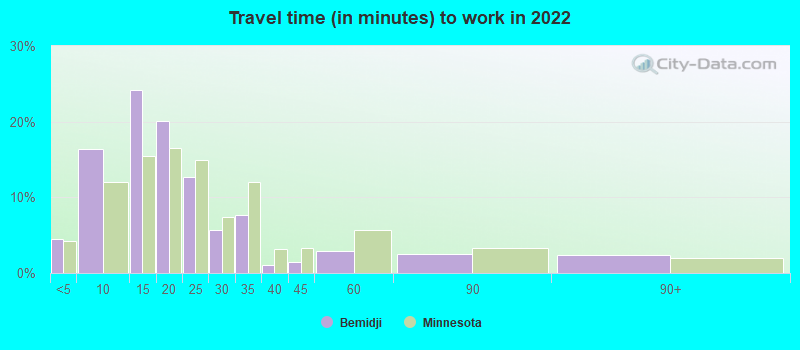
Travel time to work (commute)
- Less than 5 minutes: 494
- 5 to 9 minutes: 1,962
- 10 to 14 minutes: 2,068
- 15 to 19 minutes: 758
- 20 to 24 minutes: 459
- 25 to 29 minutes: 172
- 30 to 34 minutes: 266
- 35 to 39 minutes: 21
- 40 to 44 minutes: 47
- 45 to 59 minutes: 107
- 60 to 89 minutes: 149
- 90 or more minutes: 286
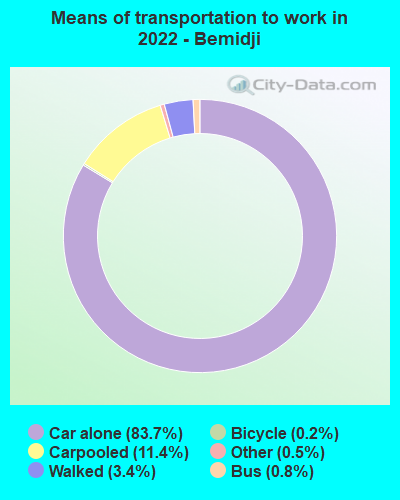
Means of transportation to work:
- Drove a car alone: 11,289 (77.5%)
- Carpooled: 1,573 (10.8%)
- Bus: 72 (0.5%)
- Taxi: 87 (0.6%)
- Bicycle: 22 (0.2%)
- Walked: 473 (3.2%)
- Worked at home: 692 (4.7%)
- Unemployment by race in 2022
- Unemployment rate for White non-Hispanic residents
- 4.7%Males
- 1.8%Females
- Unemployment rate for Black residents
- 30.3%Males
- Unemployment rate for American Indian and Alaska Native residents
- 6.2%Males
- 2.7%Females
- Unemployment rate for Asian residents
- 12.9%Females
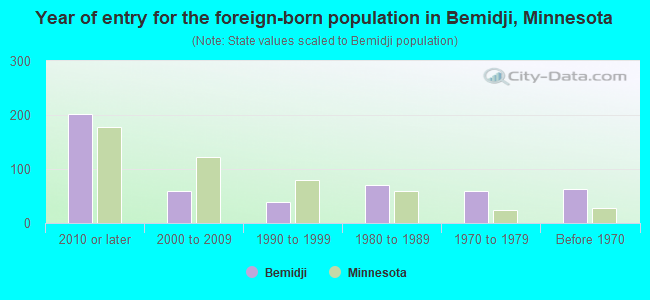
- Year of entry for the foreign-born population in Bemidji, Minnesota
- 2012010 or later
- 602000 to 2009
- 381990 to 1999
- 701980 to 1989
- 591970 to 1979
- 63Before 1970
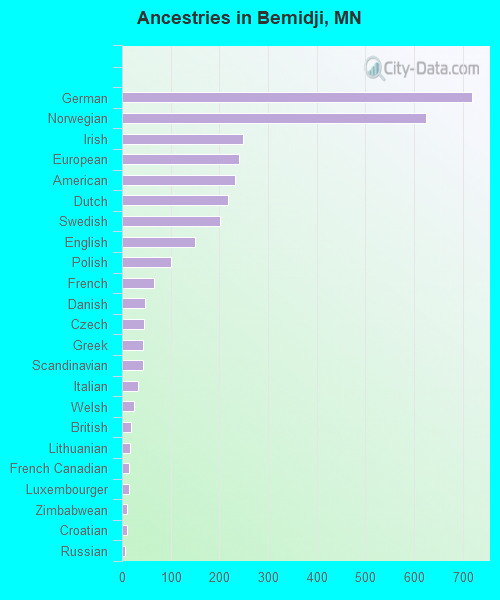
First ancestries reported:
- German: 718 (14.5%)
- Norwegian: 624 (12.6%)
- Irish: 248 (5.0%)
- European: 240 (4.9%)
- American: 233 (4.7%)
- Dutch: 217 (4.4%)
- Swedish: 201 (4.1%)
- English: 150 (3.0%)
- Polish: 101 (2.0%)
- French: 65 (1.3%)
- Danish: 48 (1.0%)
- Czech: 45 (0.9%)
- Greek: 44 (0.9%)
- Scandinavian: 44 (0.9%)
- Italian: 33 (0.7%)
- Welsh: 25 (0.5%)
- British: 19 (0.4%)
- Lithuanian: 16 (0.3%)
- French Canadian: 14 (0.3%)
- Luxembourger: 14 (0.3%)
- Zimbabwean: 11 (0.2%)
- Croatian: 10 (0.2%)
- Russian: 7 (0.1%)
- Canadian: 4 (0.08%)
- Yugoslavian: 4 (0.08%)
Most common places of birth for foreign-born residents (%):
| Bemidji: | 20.8% (71) |
| Minnesota: | 0.1% (313) |
| Bemidji: | 20.8% (71) |
| Minnesota: | 0.5% (2,291) |
| Bemidji: | 14.3% (49) |
| Minnesota: | 0.1% (531) |
| Bemidji: | 9.9% (34) |
| Minnesota: | 4.0% (19,333) |
| Bemidji: | 9.4% (32) |
| Minnesota: | 3.6% (17,119) |
| Bemidji: | 5.3% (18) |
| Minnesota: | 3.8% (18,442) |
| Bemidji: | 5.0% (17) |
| Minnesota: | 0.5% (2,345) |
| Bemidji: | 5.0% (17) |
| Minnesota: | 5.1% (24,630) |
| Bemidji: | 3.5% (12) |
| Minnesota: | 2.4% (11,675) |
| Bemidji: | 3.5% (12) |
| Minnesota: | 2.5% (11,939) |
| Bemidji: | 2.6% (9) |
| Minnesota: | 0.3% (1,665) |
| Bemidji: | 2.3% (8) |
| Minnesota: | 2.0% (9,850) |
| Bemidji: | 1.8% (6) |
| Minnesota: | 0.1% (526) |
Place of birth for U.S.-born residents:
- This state: 10,729
- Other state: 4,205
- Northeast: 185
- Midwest: 2,349
- South: 636
- West: 1,030
72.1% of Bemidji residents lived in the same house 1 years ago.
Out of people who lived in different houses, 23.6% lived in this county.
Out of people who lived in different counties, 82.4% lived in Minnesota.
| Bemidji: | 72.1% |
| State average: | 87.4% |
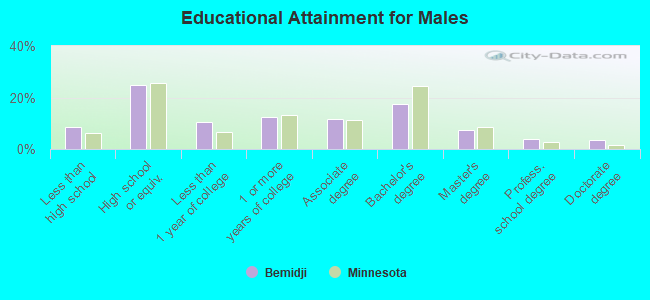
Education attainment for males 25 years and older:
- No schooling: 24
- Nursery to 4th grade: 0
- 5th and 6th grade: 0
- 7th and 8th grade: 30
- 9th grade: 0
- 10th grade: 86
- 11th grade: 74
- 12th grade, no diploma: 138
- High school graduate (or equivalency): 1,012
- Less than 1 year of college: 424
- Some college more than 1 year, no degree: 507
- Associate degree: 467
- Bachelor's degree: 709
- Master's degree: 297
- Professional school degree: 159
- Doctorate degree: 145
Education attainment for females 25 years and older:
- No schooling: 4
- Nursery to 4th grade: 16
- 5th and 6th grade: 0
- 7th and 8th grade: 16
- 9th grade: 77
- 10th grade: 36
- 11th grade: 34
- 12th grade, no diploma: 19
- High school graduate (or equivalency): 989
- Less than 1 year of college: 368
- Some college more than 1 year, no degree: 627
- Associate degree: 649
- Bachelor's degree: 999
- Master's degree: 356
- Professional school degree: 115
- Doctorate degree: 101


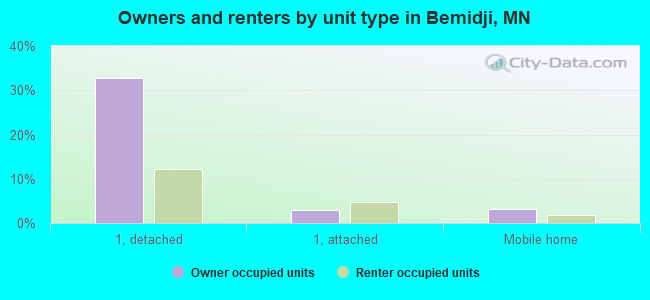
Housing units in structures:
- One, detached: 3,107
- One, attached: 572
- Two: 174
- 3 or 4: 371
- 5 to 9: 223
- 10 to 19: 695
- 20 to 49: 937
- 50 or more: 533
- Mobile homes: 350
Median worth of mobile homes: $36,782
Housing units lacking complete kitchen facilities in 2022: 1.3%
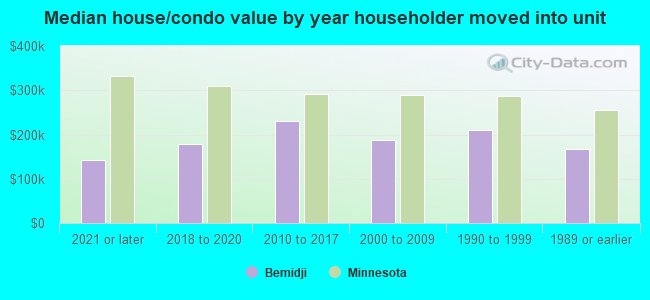
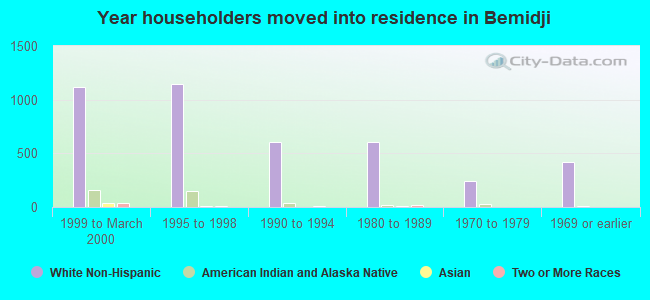
House/condo owner moved in on average 8 years ago
Renter moved in on average 1 years ago

- 75.5%Utility gas
- 12.7%Electricity
- 5.3%Fuel oil, kerosene, etc.
- 4.7%Bottled, tank, or LP gas
- 1.8%Wood
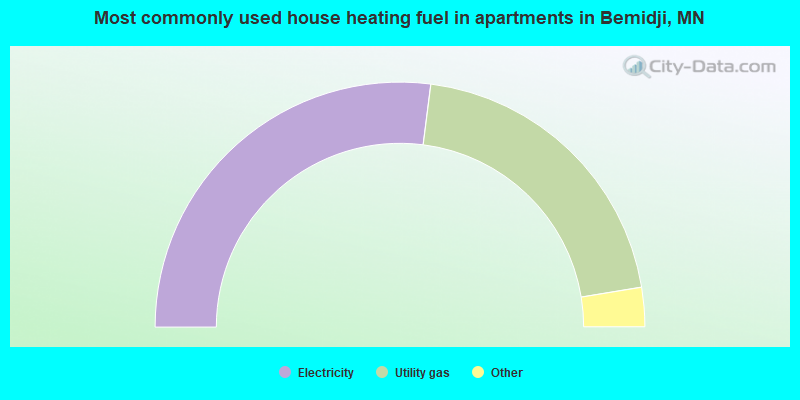
- 54.1%Electricity
- 40.8%Utility gas
- 2.1%Bottled, tank, or LP gas
- 1.8%No fuel used
- 1.1%Other fuel
- 0.1%Wood
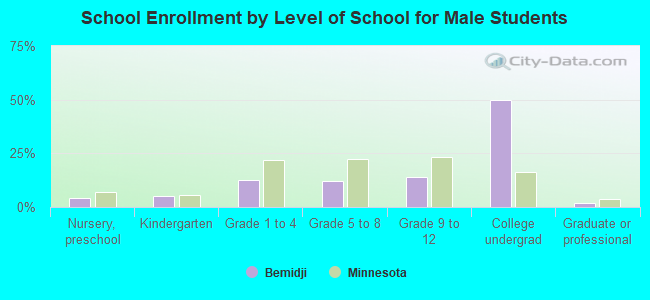
Private vs. public school enrollment:
| Here: | 22.8% |
| Minnesota: | 12.9% |
| Here: | 18.8% |
| Minnesota: | 8.6% |
| Here: | 8.5% |
| Minnesota: | 26.2% |