Biloxi, MS (Mississippi) Houses and Residents
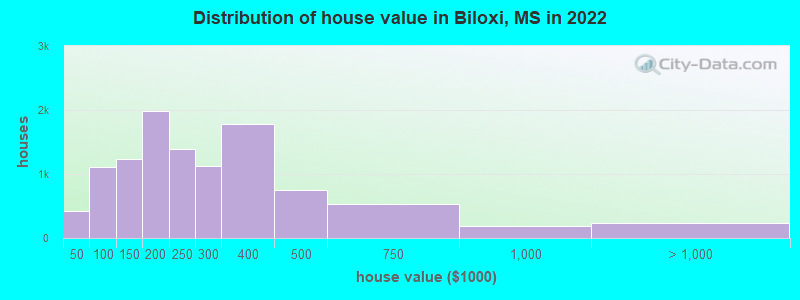
Estimated median house or condo value in 2022: $219,342 (it was $87,700 in 2000 )
Biloxi:
$219,342Mississippi:
$162,500
Lower value quartile - upper value quartile: $138,140 - $350,452Mean price in 2022: Detached houses: $294,116 Here:
$294,116State:
$226,494
Townhouses or other attached units: $404,725 Here:
$404,725State:
$254,198
In 5-or-more-unit structures: $121,277 Here:
$121,277State:
$359,860
Mobile homes: $52,663 Here:
$52,663State:
$73,695
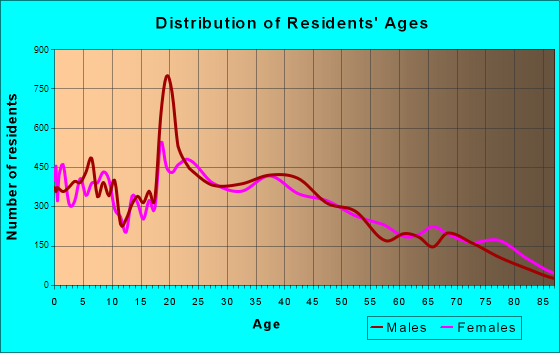
Total population: 44,984 (All urban)
Houses: 23,885 (20,148 occupied: 10,079 owner occupied, 10,449 renter occupied )
% of renters here:
51%State:
30%
Housing density: 628 houses/condos per square mile
Median price asked for vacant for-sale houses and condos in 2022: $349,266.
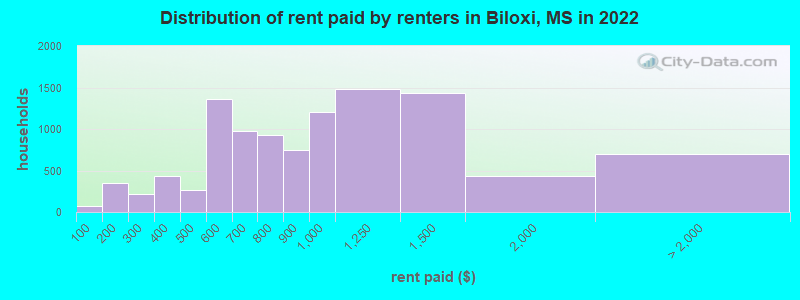
Median contract rent in 2022: $853 (lower quartile is $593, upper quartile is $1,155)
Median rent asked for vacant for-rent units in 2022: $1,051
Median gross rent in Biloxi, MS in 2022: $1,003
Housing units in Biloxi with a mortgage: 6,165 (540 second mortgage, 3 home equity loan, 354 both second mortgage and home equity loan )Houses without a mortgage: 91
Median household income for houses/condos with a mortgage: $106,283
Median household income for apartments without a mortgage: $52,264
Median monthly housing costs: $1,001
Data:
Median house or condo value ($)
Median house or condo value ($ change since 2000)
Median house or condo value ($) - White
Median house or condo value ($) - Black or African American
Median house or condo value ($) - Asian
Median house or condo value ($) - Hispanic or Latino
Median house or condo value ($) - American Indian and Alaska Native
Median house or condo value ($) - Multirace
Median house or condo value ($) - Other Race
Median price asked for mobile homes ($)
Household density (households per square mile)
Mean house or condo value by units in structure - 1, detached ($)
Mean house or condo value by units in structure - 1, attached ($)
Mean house or condo value by units in structure - 2 ($)
Mean house or condo value by units in structure by units in structure - 3 or 4 ($)
Mean house or condo value by units in structure - 5 or more ($)
Mean house or condo value by units in structure - Boat, RV, van, etc. ($)
Mean house or condo value by units in structure - Mobile home ($)
Median contract rent ($)
Median contract rent - Lower quartile ($)
Median contract rent - Upper quartile ($)
Median gross rent ($)
Urban houses (%)
Rural houses (%)
Houses occupied (%)
Houses occupied (% change since 2000)
Houses owner occupied (%)
Houses owner occupied (% change since 2000)
Houses renter occupied (%)
Houses renter occupied (% change since 2000)
Vacant housing units - For rent (%)
Vacant housing units - For rent (% change since 2000)
Vacant housing units - For sale only (%)
Vacant housing units - For sale only (% change since 2000)
Vacant housing units - Rented or sold, not occupied (%)
Vacant housing units - Rented or sold, not occupied (% change since 2000)
Vacant housing units - For seasonal, recreational, or occasional use (%)
Vacant housing units - For seasonal, recreational, or occasional use (% change since 2000)
Vacant housing units - For migrant workers (%)
Vacant housing units - For migrant workers (% change since 2000)
Vacant housing units - Other vacant (%)
Vacant housing units - Other vacant (% change since 2000)
Median monthly housing costs ($)
Median household income for houses/condos with a mortgage ($)
Median household income for houses/condos without a mortgage ($)
Median household income ($)
Median household income ($) - White
Median household income ($) - Black or African American
Median household income ($) - Asian
Median household income ($) - Hispanic or Latino
Median household income ($) - American Indian and Alaska Native
Median household income ($) - Multirace
Median household income ($) - Other Race
Mortgage status - with mortgage (%)
Mortgage status - with second mortgage (%)
Mortgage status - with home equity loan (%)
Mortgage status - with both second mortgage and home equity loan (%)
Mortgage status - without a mortgage (%)
Median year house/condo built
Median year apartment built
Household type by relationship - Male householder living alone (%)
Household type by relationship - Male householder not living alone (%)
Household type by relationship - Female householder living alone (%)
Household type by relationship - Female householder not living alone (%)
Household type by relationship - Opposite-Sex spouse (%)
Household type by relationship - Same-Sex spouse (%)
Household type by relationship - Opposite-Sex unmarried partner (%)
Household type by relationship - Same-Sex unmarried partner (%)
Household type by relationship - In group quarters (%)
Size of family households - 2-person household (%)
Size of family households - 3-person household (%)
Size of family households - 4-person household (%)
Size of family households - 5-person household (%)
Size of family households - 6-person household (%)
Size of family households - 7-or-more-person household (%)
Size of nonfamily households - 1-person household (%)
Size of nonfamily households - 2-person household (%)
Size of nonfamily households - 3-person household (%)
Size of nonfamily households - 4-person household (%)
Size of nonfamily households - 5-person household (%)
Size of nonfamily households - 6-person household (%)
Size of nonfamily households - 7-or-moreperson household (%)
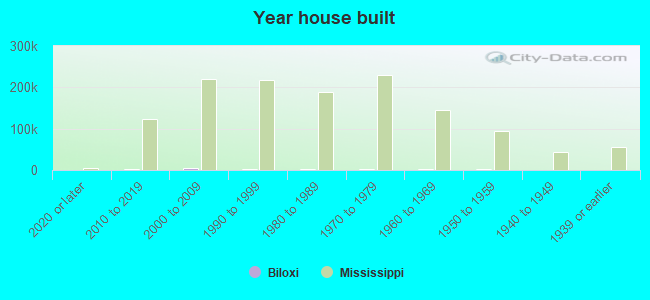
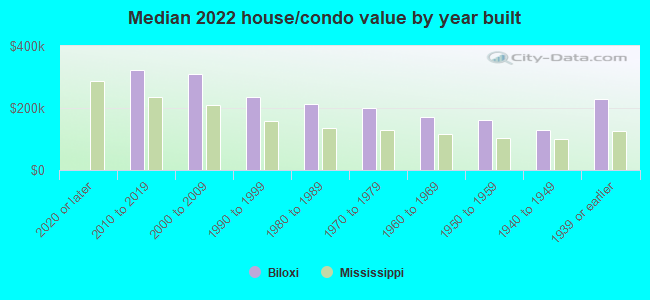
Year house built - Built 2010 or later (%)
Year house built - Built 2000 to 2009 (%)
Year house built - Built 1990 to 1999 (%)
Year house built - Built 1980 to 1989 (%)
Year house built - Built 1970 to 1979 (%)
Year house built - Built 1960 to 1969 (%)
Year house built - Built 1950 to 1959 (%)
Year house built - Built 1940 to 1949 (%)
Year house built - Built 1939 or earlier (%)
Median number of rooms in houses and condos
Median number of rooms in apartments
Median number of bedrooms in owner occupied houses
Mean number of bedrooms in owner occupied houses
Median number of bedrooms in renter occupied houses
Mean number of bedrooms in renter occupied houses
Median number of vehichles in owner occupied houses
Mean number of vehichles in owner occupied houses
Median number of vehichles in renter occupied houses
Mean number of vehichles in renter occupied houses
Rooms in owner-occupied houses - 1 room (%)
Rooms in owner-occupied houses - 2 rooms (%)
Rooms in owner-occupied houses - 3 rooms (%)
Rooms in owner-occupied houses - 4 rooms (%)
Rooms in owner-occupied houses - 5 rooms (%)
Rooms in owner-occupied houses - 6 rooms (%)
Rooms in owner-occupied houses - 7 rooms (%)
Rooms in owner-occupied houses - 8 rooms (%)
Rooms in owner-occupied houses - 9+ rooms (%)
Rooms in renter-occupied houses - 1 room (%)
Rooms in renter-occupied houses - 2 rooms (%)
Rooms in renter-occupied houses - 3 rooms (%)
Rooms in renter-occupied houses - 4 rooms (%)
Rooms in renter-occupied houses - 5 rooms (%)
Rooms in renter-occupied houses - 6 rooms (%)
Rooms in renter-occupied houses - 7 rooms (%)
Rooms in renter-occupied houses - 8 rooms (%)
Rooms in renter-occupied houses - 9+ rooms (%)
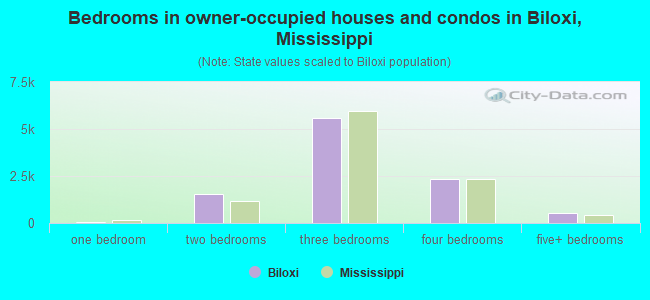
Bedrooms in owner-occupied houses - no bedrooms (%)
Bedrooms in owner-occupied houses - 1 bedroom (%)
Bedrooms in owner-occupied houses - 2 bedrooms (%)
Bedrooms in owner-occupied houses - 3 bedrooms (%)
Bedrooms in owner-occupied houses - 4 bedrooms (%)
Bedrooms in owner-occupied houses - 5+ bedrooms (%)
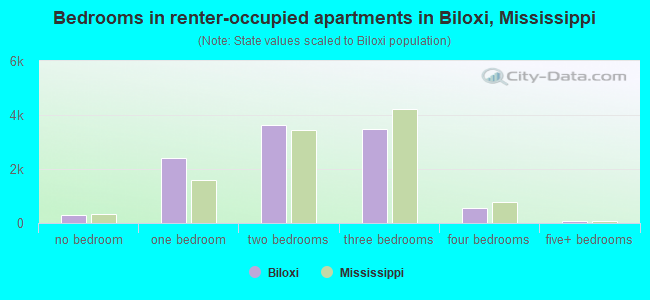
Bedrooms in renter-occupied houses - no bedrooms (%)
Bedrooms in renter-occupied houses - 1 bedroom (%)
Bedrooms in renter-occupied houses - 2 bedrooms (%)
Bedrooms in renter-occupied houses - 3 bedrooms (%)
Bedrooms in renter-occupied houses - 4 bedrooms (%)
Bedrooms in renter-occupied houses - 5+ bedrooms (%)
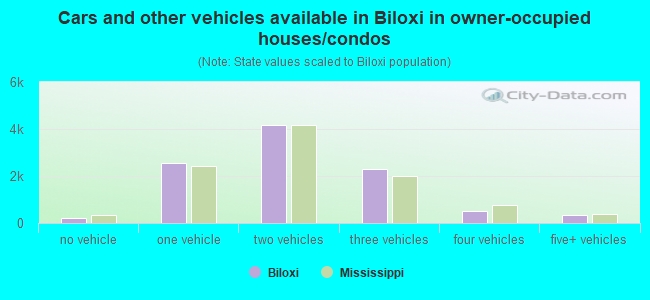
Vehicles available in owner-occupied houses - no vehicle available (%)
Vehicles available in owner-occupied houses - 1 vehicle available(%)
Vehicles available in owner-occupied houses - 2 Vehicles available (%)
Vehicles available in owner-occupied houses - 3 Vehicles available (%)
Vehicles available in owner-occupied houses - 4 Vehicles available (%)
Vehicles available in owner-occupied houses - 5+ Vehicles available (%)
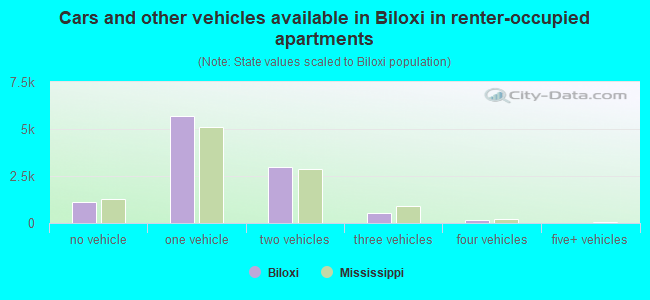
Vehicles available in renter-occupied houses - no vehicle available (%)
Vehicles available in renter-occupied houses - 1 vehicle available (%)
Vehicles available in renter-occupied houses - 2 Vehicles available (%)
Vehicles available in renter-occupied houses - 3 Vehicles available (%)
Vehicles available in renter-occupied houses - 4 Vehicles available (%)
Vehicles available in renter-occupied houses - 5+ Vehicles available (%)
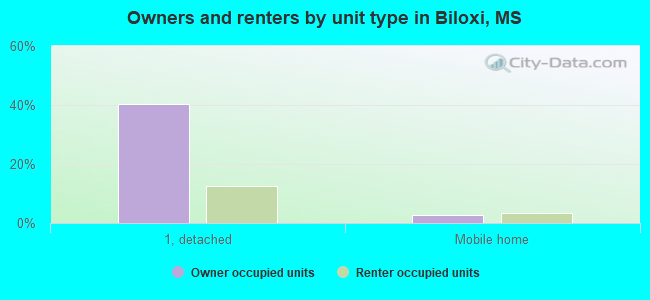
Housing units in structures - 1, detached (%)
Housing units in structures - 1, attached (%)
Housing units in structures - 2 (%)
Housing units in structures - 3 or 4 (%)
Housing units in structures - 5 to 9 (%)
Housing units in structures - 10 to 19 (%)
Housing units in structures - 20 to 49 (%)
Housing units in structures - 50 or more (%)
Housing units in structures - Mobile home (%)
Housing units in structures - Boat, RV, van, etc. (%)
Housing units in structures - Owners - 1, detached (%)
Housing units in structures - Owners - 1, attached (%)
Housing units in structures - Owners - 2 (%)
Housing units in structures - Owners - 3 or 4 (%)
Housing units in structures - Owners - 5 to 9 (%)
Housing units in structures - Owners - 10 to 19 (%)
Housing units in structures - Owners - 20 to 49 (%)
Housing units in structures - Owners - 50 or more (%)
Housing units in structures - Owners - Mobile home (%)
Housing units in structures - Owners - Boat, RV, van, etc. (%)
Housing units in structures - Renters - 1, detached (%)
Housing units in structures - Renters - 1, attached (%)
Housing units in structures - Renters - 2 (%)
Housing units in structures - Renters - 3 or 4 (%)
Housing units in structures - Renters - 5 to 9 (%)
Housing units in structures - Renters - 10 to 19 (%)
Housing units in structures - Renters - 20 to 49 (%)
Housing units in structures - Renters - 50 or more (%)
Housing units in structures - Renters - Mobile home (%)
Housing units in structures - Renters - Boat, RV, van, etc. (%)
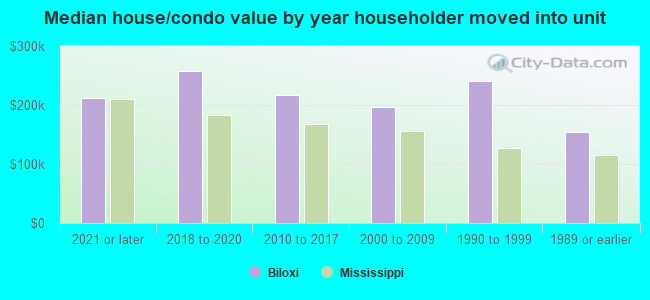
House/condo owner moved in on average (years ago)
Renter moved in on average (years ago)
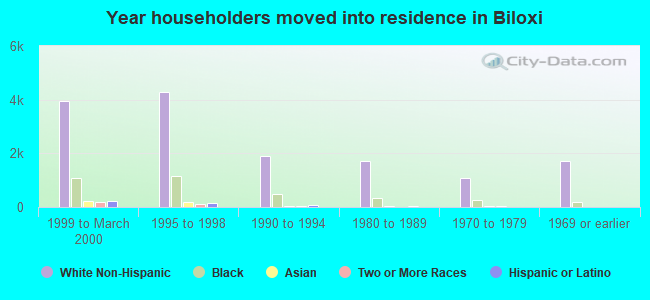
Year householder moved into unit - Moved in 1999 to March 2000 (%)
Year householder moved into unit - Moved in 1999 to March 2000 (%) - White
Year householder moved into unit - Moved in 1999 to March 2000 (%) - Black or African American
Year householder moved into unit - Moved in 1999 to March 2000 (%) - Asian
Year householder moved into unit - Moved in 1999 to March 2000 (%) - Hispanic or Latino
Year householder moved into unit - Moved in 1999 to March 2000 (%) - American Indian and Alaska Native
Year householder moved into unit - Moved in 1999 to March 2000 (%) - Multirace
Year householder moved into unit - Moved in 1999 to March 2000 (%) - Other Race
Year householder moved into unit - Moved in 1995 to 1998 (%)
Year householder moved into unit - Moved in 1995 to 1998 (%) - White
Year householder moved into unit - Moved in 1995 to 1998 (%) - Black or African American
Year householder moved into unit - Moved in 1995 to 1998 (%) - Asian
Year householder moved into unit - Moved in 1995 to 1998 (%) - Hispanic or Latino
Year householder moved into unit - Moved in 1995 to 1998 (%) - American Indian and Alaska Native
Year householder moved into unit - Moved in 1995 to 1998 (%) - Multirace
Year householder moved into unit - Moved in 1995 to 1998 (%) - Other Race
Year householder moved into unit - Moved in 1990 to 1994 (%)
Year householder moved into unit - Moved in 1990 to 1994 (%) - White
Year householder moved into unit - Moved in 1990 to 1994 (%) - Black or African American
Year householder moved into unit - Moved in 1990 to 1994 (%) - Asian
Year householder moved into unit - Moved in 1990 to 1994 (%) - Hispanic or Latino
Year householder moved into unit - Moved in 1990 to 1994 (%) - American Indian and Alaska Native
Year householder moved into unit - Moved in 1990 to 1994 (%) - Multirace
Year householder moved into unit - Moved in 1990 to 1994 (%) - Other Race
Year householder moved into unit - Moved in 1980 to 1989 (%)
Year householder moved into unit - Moved in 1980 to 1989 (%) - White
Year householder moved into unit - Moved in 1980 to 1989 (%) - Black or African American
Year householder moved into unit - Moved in 1980 to 1989 (%) - Asian
Year householder moved into unit - Moved in 1980 to 1989 (%) - Hispanic or Latino
Year householder moved into unit - Moved in 1980 to 1989 (%) - American Indian and Alaska Native
Year householder moved into unit - Moved in 1980 to 1989 (%) - Multirace
Year householder moved into unit - Moved in 1980 to 1989 (%) - Other Race
Year householder moved into unit - Moved in 1970 to 1979 (%)
Year householder moved into unit - Moved in 1970 to 1979 (%) - White
Year householder moved into unit - Moved in 1970 to 1979 (%) - Black or African American
Year householder moved into unit - Moved in 1970 to 1979 (%) - Asian
Year householder moved into unit - Moved in 1970 to 1979 (%) - Hispanic or Latino
Year householder moved into unit - Moved in 1970 to 1979 (%) - American Indian and Alaska Native
Year householder moved into unit - Moved in 1970 to 1979 (%) - Multirace
Year householder moved into unit - Moved in 1970 to 1979 (%) - Other Race
Year householder moved into unit - Moved in 1969 or earlier (%)
Year householder moved into unit - Moved in 1969 or earlier (%) - White
Year householder moved into unit - Moved in 1969 or earlier (%) - Black or African American
Year householder moved into unit - Moved in 1969 or earlier (%) - Asian
Year householder moved into unit - Moved in 1969 or earlier (%) - Hispanic or Latino
Year householder moved into unit - Moved in 1969 or earlier (%) - American Indian and Alaska Native
Year householder moved into unit - Moved in 1969 or earlier (%) - Multirace
Year householder moved into unit - Moved in 1969 or earlier (%) - Other Race
Housing units lacking complete plumbing facilities (%)
Housing units lacking complete kitchen facilities (%)
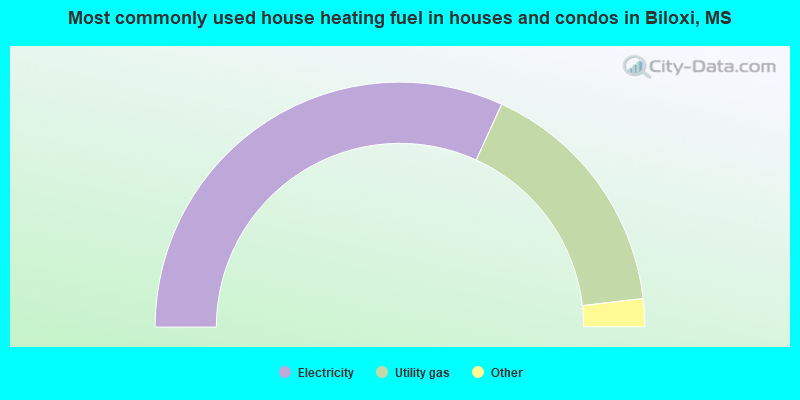
House heating fuel used in houses and condos - Utility gas (%)
House heating fuel used in houses and condos - Bottled, tank, or LP gas (%)
House heating fuel used in houses and condos - Electricity (%)
House heating fuel used in houses and condos - Fuel oil, kerosene, etc. (%)
House heating fuel used in houses and condos - Coal or coke (%)
House heating fuel used in houses and condos - Wood (%)
House heating fuel used in houses and condos - Solar energy (%)
House heating fuel used in houses and condos - Other fuel (%)
House heating fuel used in houses and condos - No fuel used (%)
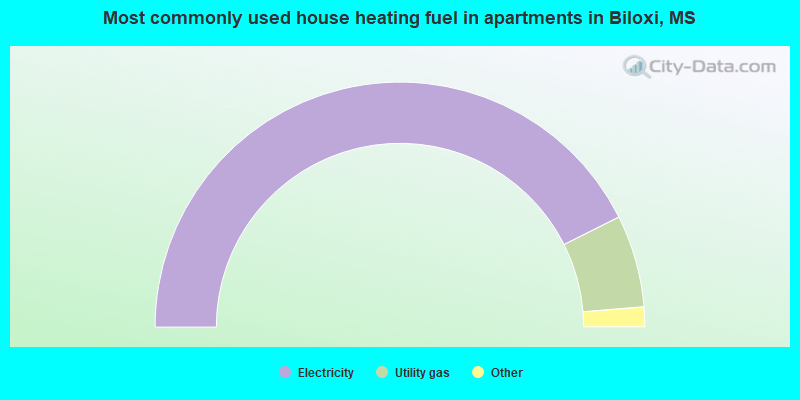
House heating fuel used in apartments - Utility gas (%)
House heating fuel used in apartments - Bottled, tank, or LP gas (%)
House heating fuel used in apartments - Electricity (%)
House heating fuel used in apartments - Fuel oil, kerosene, etc. (%)
House heating fuel used in apartments - Coal or coke (%)
House heating fuel used in apartments - Wood (%)
House heating fuel used in apartments - Solar energy (%)
House heating fuel used in apartments - Other fuel (%)
House heating fuel used in apartments - No fuel used (%)
Latest news about housing in Biloxi, MS collected exclusively by city-data.com from local newspapers, TV, and radio stations
Median year house/condo built: 1990Median year apartment built: 1993Household type by relationship:
Households: 49,681
Male householders: 9,433 (3,416 living alone ), Female householders: 10,448 (3,123 living alone )8,862 spouses (8,847 opposite-sex spouses ), 1,272 unmarried partners , (1,199 opposite-sex unmarried partners ), 13,911 children (12,721 natural , 330 adopted , 859 stepchildren ), 1,025 grandchildren , 356 brothers or sisters , 624 parents , 75 foster children , 591 other relatives , 769 non-relatives In group quarters: 2,309
Size of family households: 6,255 2-persons , 2,925 3-persons , 1,984 4-persons , 865 5-persons , 133 6-persons , 162 7-or-more-persons .
Size of nonfamily households: 7,314 1-person , 891 2-persons , 80 3-persons , 19 4-persons , 11 7-or-more-persons .
7,160 married couples with children. single-parent households (462 men , 2,462 women ).
91.0% of residents of Biloxi speak English at home. of residents speak Spanish at home (52% speak English very well , 19% speak English well , 13% speak English not well , 15% don't speak English at all ).of residents speak other Indo-European language at home (70% speak English very well , 24% speak English well , 7% speak English not well ).of residents speak Asian or Pacific Island language at home (37% speak English very well , 26% speak English well , 21% speak English not well , 16% don't speak English at all ).of residents speak other language at home (57% speak English very well , 7% speak English well , 8% speak English not well , 28% don't speak English at all ).
Foreign born population: 2,199 (4.4%)of them are naturalized citizens )
Median number of rooms in houses and condos:
Median number of rooms in apartments
Owner-occupied Renter-occupied
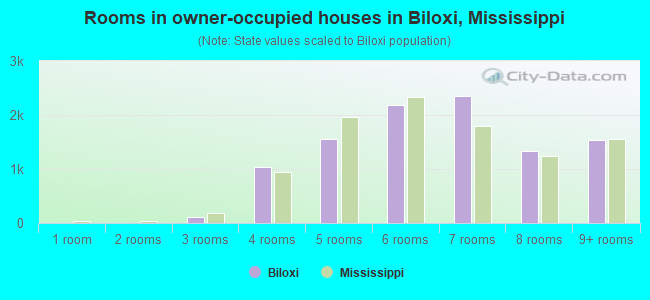
Rooms in owner-occupied houses in Biloxi, Mississippi
7 1 room 0 2 rooms 111 3 rooms 1,040 4 rooms 1,547 5 rooms 2,177 6 rooms 2,343 7 rooms 1,326 8 rooms 1,530 9+ rooms
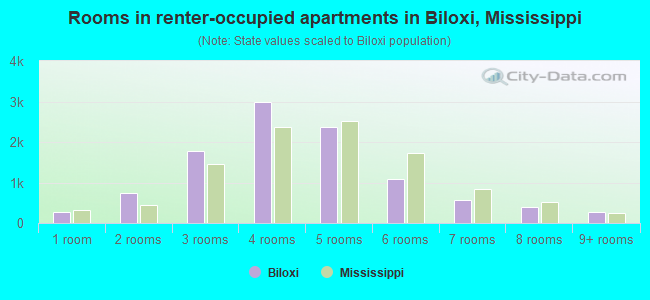
Rooms in renter-occupied apartments in Biloxi, Mississippi
262 1 room 733 2 rooms 1,790 3 rooms 2,989 4 rooms 2,362 5 rooms 1,086 6 rooms 558 7 rooms 396 8 rooms 274 9+ rooms
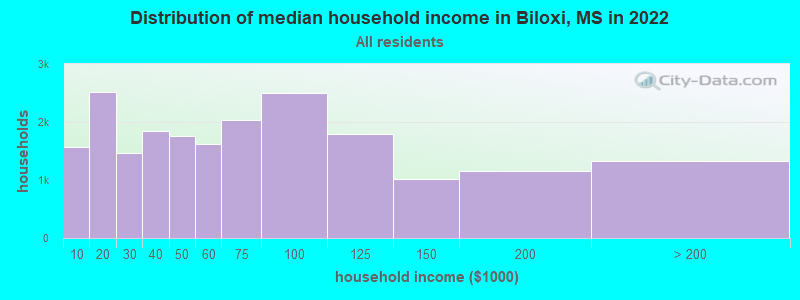
Biloxi, MS household income distribution 1,570 Less than $10,0002,521 $10,000 to $19,9991,462 $20,000 to $29,9991,853 $30,000 to $39,9991,767 $40,000 to $49,9991,619 $50,000 to $59,9992,035 $60,000 to $74,9992,496 $75,000 to $99,9991,794 $100,000 to $124,9991,018 $125,000 to $149,9991,148 $150,000 to $199,9991,322 $200,000 or more
Home value of owner - occupied houses in 2022 in Biloxi, MS 144 Less than $10,00066 $10,000 to $14,99954 $15,000 to $19,99949 $20,000 to $24,99934 $25,000 to $29,99940 $35,000 to $39,99932 $40,000 to $49,999106 $50,000 to $59,999328 $60,000 to $69,999129 $70,000 to $79,999176 $80,000 to $89,999334 $90,000 to $99,999772 $100,000 to $124,999460 $125,000 to $149,9991,033 $150,000 to $174,999947 $175,000 to $199,9991,383 $200,000 to $249,9991,124 $250,000 to $299,9991,781 $300,000 to $399,999754 $400,000 to $499,999533 $500,000 to $749,999184 $750,000 to $999,999144 $1,000,000 to $1,499,99993 $2,000,000 or moreRent paid by renters in 2022 in Biloxi, MS 71 Less than $100190 $100 to $149162 $150 to $19918 $200 to $249196 $250 to $29995 $300 to $349334 $350 to $399138 $400 to $449123 $450 to $499989 $500 to $549375 $550 to $599634 $600 to $649338 $650 to $699448 $700 to $749479 $750 to $799746 $800 to $8991,202 $900 to $9991,480 $1,000 to $1,2491,434 $1,250 to $1,499436 $1,500 to $1,99965 $2,000 to $2,49912 $2,500 to $2,99937 $3,000 to $3,49988 $3,500 or more496 No cash rent
Percentage of workers working in this county: 86.5%Number of people working at home: 1,479 (6.4% of all workers )
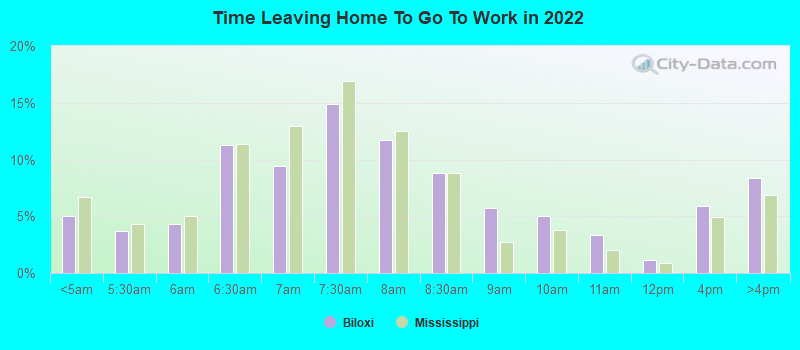
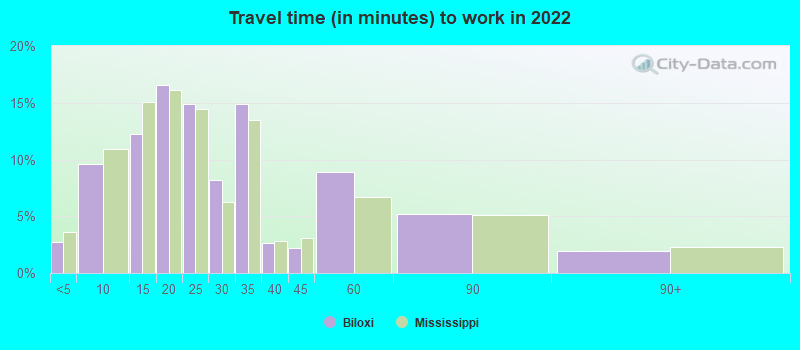
Travel time to work (commute)
Less than 5 minutes: 1,0385 to 9 minutes: 2,65310 to 14 minutes: 3,39415 to 19 minutes: 4,25620 to 24 minutes: 3,99725 to 29 minutes: 1,31830 to 34 minutes: 2,45735 to 39 minutes: 38440 to 44 minutes: 59345 to 59 minutes: 50260 to 89 minutes: 55590 or more minutes: 358
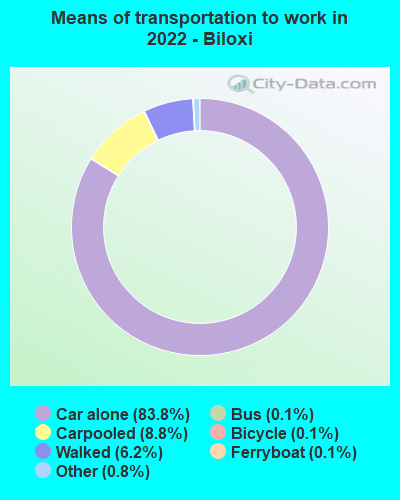
Means of transportation to work:
Drove a car alone: 30,696 (80.1%)Carpooled: 3,392 (8.8%)Bus : 86 (0.2%)Long-distance train or commuter rail : 4 (0.0%)Ferryboat: 50 (0.1%)Taxi: 167 (0.4%)Bicycle: 49 (0.1%)Walked: 2,522 (6.6%)Worked at home: 1,479 (3.9%)
Unemployment by race in 2022
Unemployment rate for White non-Hispanic residents 6.1% Males6.4% FemalesUnemployment rate for Black residents 16.8% Males6.7% FemalesUnemployment rate for American Indian and Alaska Native residents 47.6% FemalesUnemployment rate for Asian residents 0.1% MalesUnemployment rate for other race residents 0.3% FemalesUnemployment rate for two or more race residents 13.1% Males1.0% FemalesUnemployment rate for Hispanic or Latino residents 1.9% Males8.5% Females
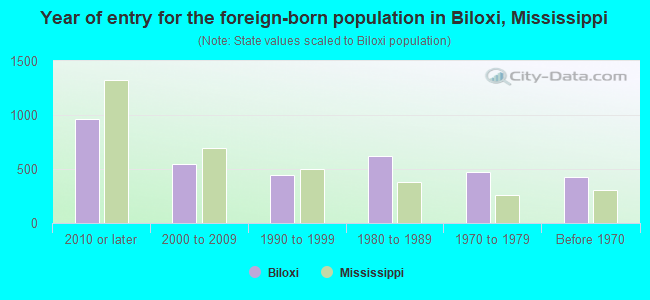
Year of entry for the foreign-born population in Biloxi, Mississippi
967 2010 or later 546 2000 to 2009 441 1990 to 1999 621 1980 to 1989 471 1970 to 1979 426 Before 1970
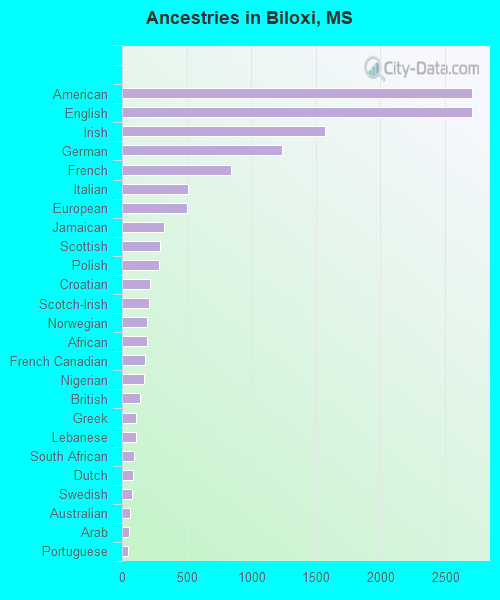
First ancestries reported:
American: 2,705 (10.7%)
English: 2,705 (10.7%)
Irish: 1,574 (6.2%)
German: 1,235 (4.9%)
French: 844 (3.3%)
Italian: 510 (2.0%)
European: 502 (2.0%)
Jamaican: 327 (1.3%)
Scottish: 297 (1.2%)
Polish: 284 (1.1%)
Croatian: 215 (0.9%)
Scotch-Irish: 206 (0.8%)
Norwegian: 193 (0.8%)
African: 192 (0.8%)
French Canadian: 177 (0.7%)
Nigerian: 172 (0.7%)
British: 138 (0.5%)
Greek: 107 (0.4%)
Lebanese: 106 (0.4%)
South African: 89 (0.4%)
Dutch: 88 (0.3%)
Swedish: 74 (0.3%)
Australian: 60 (0.2%)
Arab: 53 (0.2%)
Portuguese: 43 (0.2%)
Eastern European: 34 (0.1%)
Scandinavian: 31 (0.1%)
Barbadian: 31 (0.1%)
Cajun: 27 (0.1%)
Danish: 26 (0.1%)
West Indian: 25 (0.10%)
Haitian: 21 (0.08%)
Austrian: 20 (0.08%)
Lithuanian: 20 (0.08%)
Welsh: 18 (0.07%)
Yugoslavian: 17 (0.07%)
Slavic: 16 (0.06%)
Czechoslovakian: 14 (0.06%)
Hungarian: 11 (0.04%)
Slovak: 9 (0.04%)
Russian: 7 (0.03%)
Zimbabwean: 7 (0.03%)
Armenian: 6 (0.02%)
Palestinian: 5 (0.02%)
Guyanese: 4 (0.02%)
Belizean: 4 (0.02%)
Most common places of birth for foreign-born residents (%): Vietnam Biloxi:
16.6% (474)Mississippi:
5.8% (3,948)
Mexico Biloxi:
12.7% (363)Mississippi:
25.4% (17,354)
Honduras Biloxi:
12.1% (346)Mississippi:
5.1% (3,475)
Jamaica Biloxi:
8.9% (254)Mississippi:
1.3% (899)
Philippines Biloxi:
6.8% (194)Mississippi:
4.7% (3,211)
Guatemala Biloxi:
5.4% (155)Mississippi:
5.5% (3,723)
Peru Biloxi:
4.2% (120)Mississippi:
1.3% (870)
Saudi Arabia Biloxi:
4.1% (116)Mississippi:
0.3% (215)
Germany Biloxi:
3.9% (111)Mississippi:
3.1% (2,126)
Korea Biloxi:
3.1% (89)Mississippi:
1.5% (1,043)
England Biloxi:
2.4% (68)Mississippi:
1.5% (1,053)
Ethiopia Biloxi:
2.4% (68)Mississippi:
0.5% (314)
China, excluding Hong Kong and Taiwan Biloxi:
2.1% (60)Mississippi:
4.3% (2,948)
Place of birth for U.S.-born residents:
This state: 21,760Other state: 24,643Northeast: 2,101Midwest: 5,130South: 12,625West: 5,086 81.7% of Biloxi residents lived in the same house 1 years ago.
Out of people who lived in different houses, 26.7% lived in this county.
Out of people who lived in different counties, 18.5% lived in Mississippi.
Biloxi:
81.7%State average:
88.9%
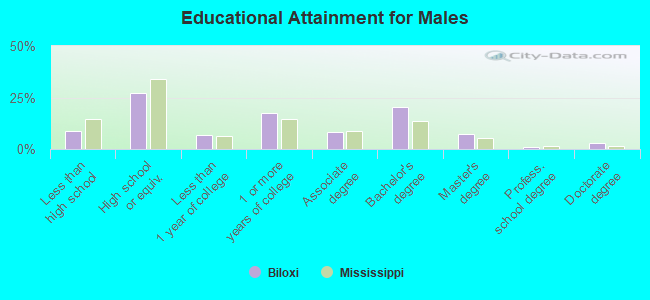
Education attainment for males 25 years and older:
No schooling: 268Nursery to 4th grade: 85th and 6th grade: 1157th and 8th grade: 2049th grade: 29910th grade: 16411th grade: 23512th grade, no diploma: 158High school graduate (or equivalency): 4,405Less than 1 year of college: 1,077Some college more than 1 year, no degree: 2,845Associate degree: 1,322Bachelor's degree: 3,285Master's degree: 1,185Professional school degree: 172Doctorate degree: 433
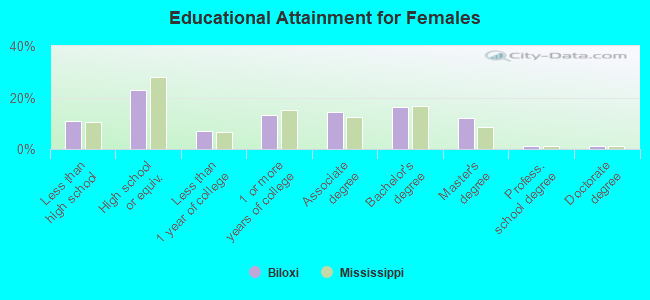
Education attainment for females 25 years and older:
No schooling: 409Nursery to 4th grade: 445th and 6th grade: 877th and 8th grade: 1679th grade: 35210th grade: 30811th grade: 29912th grade, no diploma: 207High school graduate (or equivalency): 3,905Less than 1 year of college: 1,197Some college more than 1 year, no degree: 2,241Associate degree: 2,437Bachelor's degree: 2,792Master's degree: 2,070Professional school degree: 226Doctorate degree: 189
Housing units in structures:
One, detached: 12,712One, attached: 1,117Two: 6653 or 4: 8295 to 9: 2,30410 to 19: 1,72020 to 49: 87350 or more: 2,288Mobile homes: 1,372Median worth of mobile homes: $48,703
Housing units lacking complete plumbing facilities in 2022: 2.1%Housing units lacking complete kitchen facilities in 2022: 2.3%House/condo owner moved in on average 11 years ago
Renter moved in on average 4 years ago
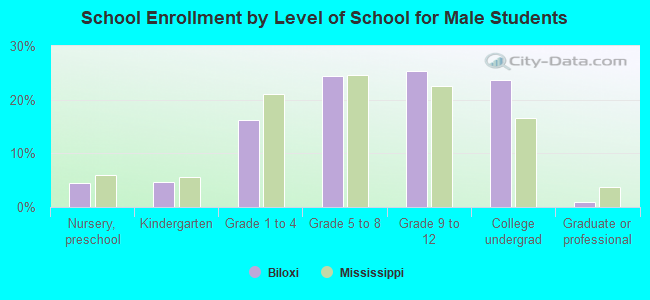
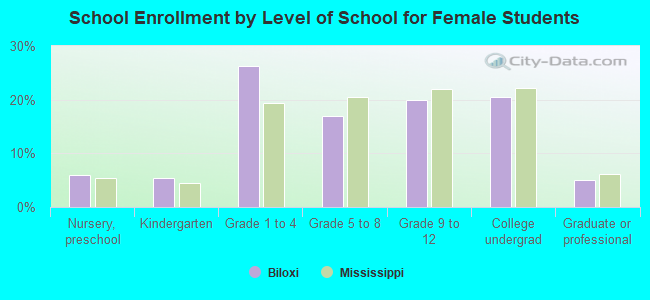
Private vs. public school enrollment:
Students in private schools in grades 1 to 8 (elementary and middle school): 904 Here:
19.8%Mississippi:
16.1%
Students in private schools in grades 9 to 12 (high school): 204 Here:
8.4%Mississippi:
14.6%
Students in private undergraduate colleges: 419 Here:
17.5%Mississippi:
12.8%