Boiling Springs, SC (South Carolina) Houses and Residents
| Boiling Springs: | $234,962 |
| South Carolina: | $254,600 |
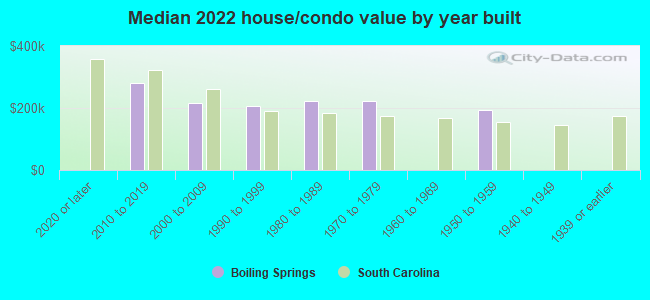
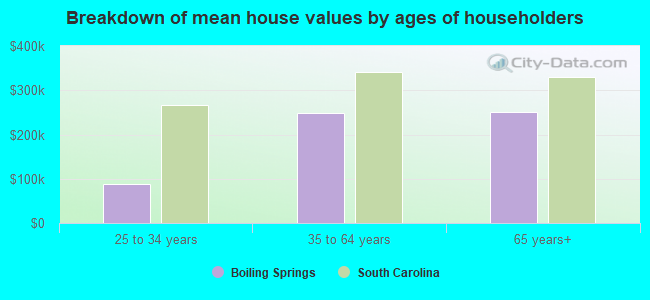
Mean price in 2022:
Detached houses: $332,521
Here: $332,521 State: $368,255 Townhouses or other attached units: $160,552
Here: $160,552 State: $292,023 Mobile homes: $85,794
Here: $85,794 State: $102,531
Total population: 8,219 (Urban population: 4,339, Rural population: 130 (all nonfarm))
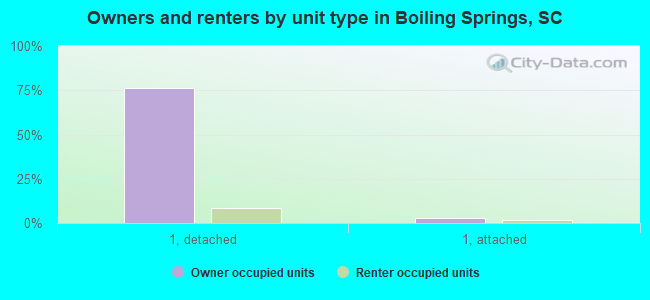
Houses: 4,614 (4,589 occupied: 3,824 owner occupied, 819 renter occupied)
| % of renters here: | 18% |
| State: | 28% |
Housing density: 677 houses/condos per square mile
Median price asked for vacant for-sale houses and condos in 2022 in this county: $161,822.
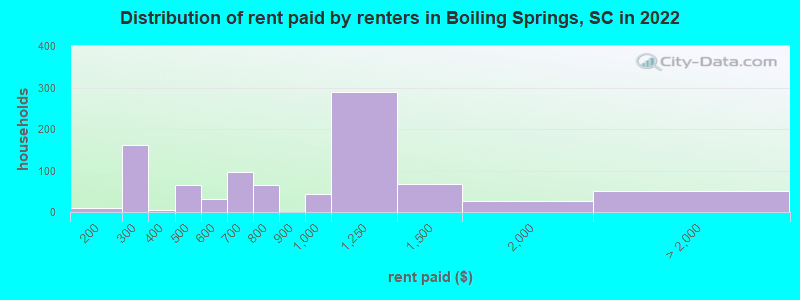
Median contract rent in 2022: $809 (lower quartile is $454, upper quartile is $1,229)
Median rent asked for vacant for-rent units in 2022: $1,095
Median gross rent in Boiling Springs, SC in 2022: $934
Housing units in Boiling Springs with a mortgage: 2,450 (113 second mortgage, 0 home equity loan, 109 both second mortgage and home equity loan)
Houses without a mortgage: 12
Median household income for houses/condos with a mortgage: $80,671
Median household income for apartments without a mortgage: $47,094
Median monthly housing costs: $992
Compare current foreclosures near Boiling Springs, SC:
| Photo | Address | Area | Beds / Baths | Price | Details |
|---|---|---|---|---|---|

|
#1
Valley Creek Dr
Boiling Springs, SC 29316
|
1,630 sq. feet
|
2 baths 3 beds |
show details | |

|
#2
Sandy Dr
Boiling Springs, SC 29316
|
1,667 sq. feet
|
2 baths 3 beds |
show details | |

|
#3
Chateau St
Boiling Springs, SC 29316
|
1,220 sq. feet
|
2 baths 4 beds |
show details | |

|
#4
Landstone Ter
Boiling Springs, SC 29316
|
1,360 sq. feet
|
2 baths 4 beds |
show details | |

|
#5
Moss Ln
Boiling Springs, SC 29316
|
1,500 sq. feet
|
2 baths 3 beds |
show details | |

|
#6
Parris Bridge Rd
Boiling Springs, SC 29316
|
1,204 sq. feet
|
2 baths 3 beds |
show details | |

|
#7
Slate Dr
Boiling Springs, SC 29316
|
2,332 sq. feet
|
2 baths 3 beds |
show details | |

|
#8
Marble Ln
Boiling Springs, SC 29316
|
2,121 sq. feet
|
2 baths 3 beds |
show details | |

|
#9
Cotton Branch Dr
Boiling Springs, SC 29316
|
1,350 sq. feet
|
2 baths 3 beds |
show details | |

|
#10
Eventine Way
Boiling Springs, SC 29316
|
- sq. feet
|
- baths - beds |
show details |
| Photo | Address | Area | Beds / Baths | Price | Details |
|---|---|---|---|---|---|

|
#11
Wesley Ct Apt 29
Boiling Springs, SC 29316
|
- sq. feet
|
- baths - beds |
show details | |

|
#12
Dornoch Dr Apt 26
Boiling Springs, SC 29316
|
- sq. feet
|
- baths - beds |
show details | |

|
#13
Creekside Ln
Boiling Springs, SC 29316
|
- sq. feet
|
- baths - beds |
show details | |

|
#14
Troon Cir Apt 32
Boiling Springs, SC 29316
|
- sq. feet
|
- baths - beds |
show details | |

|
#15
Deepwood Ct
Boiling Springs, SC 29316
|
- sq. feet
|
- baths - beds |
show details | |

|
#16
Newton Dr
Boiling Springs, SC 29316
|
- sq. feet
|
- baths - beds |
show details | |

|
#17
Oak Cir
Boiling Springs, SC 29316
|
- sq. feet
|
- baths - beds |
show details | |

|
#18
Maidstone Dr # 18
Boiling Springs, SC 29316
|
- sq. feet
|
- baths - beds |
show details | |

|
#19
Parris Bridge Rd
Boiling Springs, SC 29316
|
- sq. feet
|
- baths - beds |
show details | |

|
#20
Colebrook Ct
Boiling Springs, SC 29316
|
- sq. feet
|
- baths - beds |
show details |
| Photo | Address | Area | Beds / Baths | Price | Details |
|---|---|---|---|---|---|

|
#21
Little Neon Dr
Boiling Springs, SC 29316
|
- sq. feet
|
- baths - beds |
show details | |

|
#22
E Clubhouse Ln
Boiling Springs, SC 29316
|
- sq. feet
|
- baths - beds |
show details | |

|
#23
Pratt Dr
Boiling Springs, SC 29316
|
- sq. feet
|
- baths - beds |
show details | |

|
#24
Jannison Rd
Boiling Springs, SC 29316
|
- sq. feet
|
- baths - beds |
show details | |

|
#25
Castleton Cir
Boiling Springs, SC 29316
|
- sq. feet
|
- baths - beds |
show details | |

|
#26
Dogwood Ave
Spartanburg, SC 29302
|
2,069 sq. feet
|
2 baths 4 beds |
show details | |

|
#27
Eastberrys Creek Rd
Duncan, SC 29334
|
2,851 sq. feet
|
3 baths 3 beds |
show details | |

|
#28
Cinnamon Ridge Dr
Inman, SC 29349
|
1,556 sq. feet
|
2 baths 3 beds |
show details | |

|
#29
Holly Cir
Lyman, SC 29365
|
1,497 sq. feet
|
2 baths 3 beds |
show details | |

|
#30
Sapphire Ct
Inman, SC 29349
|
2,052 sq. feet
|
2 baths 5 beds |
show details |
| Photo | Address | Area | Beds / Baths | Price | Details |
|---|---|---|---|---|---|

|
#31
E Fremont Ave
Spartanburg, SC 29303
|
1,537 sq. feet
|
2 baths 3 beds |
show details | |

|
#32
Gardner Rd
Gaffney, SC 29341
|
- sq. feet
|
2 baths 3 beds |
show details | |

|
#33
Berry Shoals Rd
Duncan, SC 29334
|
1,643 sq. feet
|
2 baths 3 beds |
show details | |

|
#34
W Rustling Leaves Ln
Roebuck, SC 29376
|
1,760 sq. feet
|
2 baths 4 beds |
show details | |

|
#35
Marconi Dr
Spartanburg, SC 29303
|
2,413 sq. feet
|
2 baths 5 beds |
show details | |

|
#36
Farmstead Trl
Inman, SC 29349
|
1,983 sq. feet
|
2 baths 4 beds |
show details | |

|
#37
Hibiscus Ct
Lyman, SC 29365
|
1,542 sq. feet
|
2 baths 3 beds |
show details | |

|
#38
Jewell Rd
Spartanburg, SC 29302
|
1,560 sq. feet
|
1 baths 3 beds |
show details | |

|
#39
Shiloh Church Rd
Wellford, SC 29385
|
1,728 sq. feet
|
2 baths 3 beds |
show details | |

|
#40
Ridings Rd
Campobello, SC 29322
|
2,518 sq. feet
|
2 baths 3 beds |
show details |
| Photo | Address | Area | Beds / Baths | Price | Details |
|---|---|---|---|---|---|

|
#41
Hillcrest Blvd
Spartanburg, SC 29307
|
1,156 sq. feet
|
1 baths 3 beds |
show details | |

|
#42
Suzanna Dr
Inman, SC 29349
|
1,634 sq. feet
|
2 baths 3 beds |
show details | |

|
#43
Campton Cir
Inman, SC 29349
|
1,372 sq. feet
|
1 baths 3 beds |
show details | |

|
#44
Arbor Creek Dr
Inman, SC 29349
|
2,280 sq. feet
|
2 baths 3 beds |
show details | |

|
#45
Goucher School Rd
Gaffney, SC 29340
|
- sq. feet
|
- baths - beds |
$25,000
|
show details |

|
#46
Jay Cir
Moore, SC 29369
|
1,918 sq. feet
|
2 baths 3 beds |
show details | |

|
#47
Washington Rd
Spartanburg, SC 29302
|
1,632 sq. feet
|
1 baths 3 beds |
show details | |

|
#48
W Croft Cir
Spartanburg, SC 29302
|
1,832 sq. feet
|
1 baths 5 beds |
show details | |

|
#49
Hidden Hill Rd
Spartanburg, SC 29301
|
1,998 sq. feet
|
2 baths 4 beds |
show details | |

|
Check over 1 million property listings on Foreclosure.com!
|
browse all offers | |||


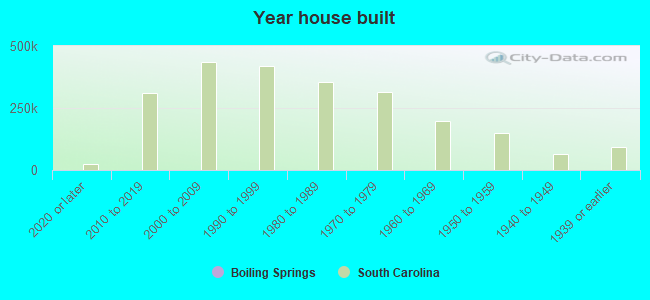
Median year apartment built: 2006
Household type by relationship:
Households: 11,723- Male householders: 2,033 (557 living alone), Female householders: 2,552 (652 living alone)
2,672 spouses (2,672 opposite-sex spouses), 45 unmarried partners, (45 opposite-sex unmarried partners), 4,018 children (3,602 natural, 239 adopted, 175 stepchildren), 36 grandchildren, 67 brothers or sisters, 175 parents, 0 foster children, 31 other relatives, 24 non-relatives
- In group quarters: 65
Size of family households: 1,290 2-persons, 625 3-persons, 824 4-persons, 290 5-persons, 251 6-persons, 3 7-or-more-persons.
Size of nonfamily households: 1,295 1-person, 48 2-persons.
2,699 married couples with children.
193 single-parent households (7 men, 186 women).
86.3% of residents of Boiling Springs speak English at home.
8.0% of residents speak Spanish at home (51% speak English very well, 36% speak English well, 13% speak English not well).
4.8% of residents speak other Indo-European language at home (58% speak English very well, 15% speak English well, 12% speak English not well, 15% don't speak English at all).
1.3% of residents speak Asian or Pacific Island language at home (55% speak English very well, 38% speak English well, 7% speak English not well).
Foreign born population: 1,059 (9.0%)
(50.7% of them are naturalized citizens)
| Here: | 6.2 |
| State: | 6.4 |
| Here: | 3.7 |
| State: | 4.5 |
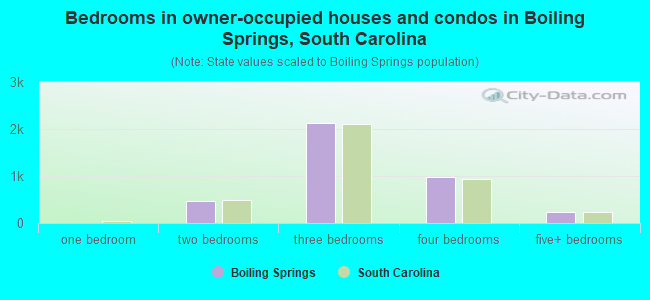
- Bedrooms in owner-occupied houses and condos in Boiling Springs, South Carolina
- 0no bedroom
- 01 bedroom
- 4772 bedrooms
- 2,1333 bedrooms
- 9854 bedrooms
- 2285+ bedrooms
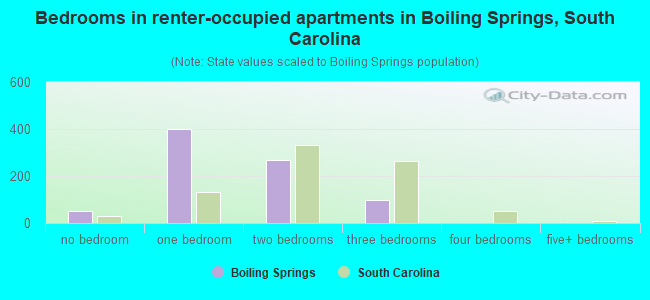
- Bedrooms in renter-occupied apartments in Boiling Springs, South Carolina
- 50no bedroom
- 4021 bedroom
- 2682 bedrooms
- 1003 bedrooms
- 04 bedrooms
- 05+ bedrooms
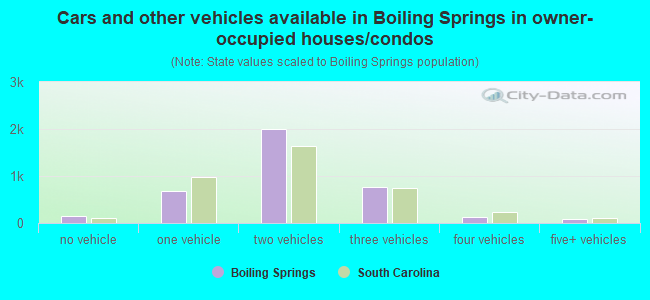
- Cars and other vehicles available in Boiling Springs in owner-occupied houses/condos
- 147no vehicle
- 6911 vehicle
- 2,0092 vehicles
- 7623 vehicles
- 1214 vehicles
- 945+ vehicles
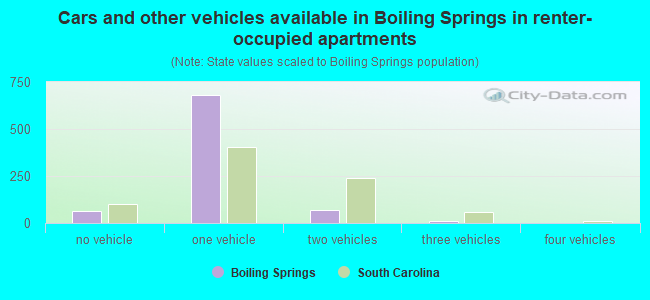
- Cars and other vehicles available in Boiling Springs in renter-occupied apartments
- 63no vehicle
- 6791 vehicle
- 692 vehicles
- 103 vehicles
- 04 vehicles
- 05+ vehicles
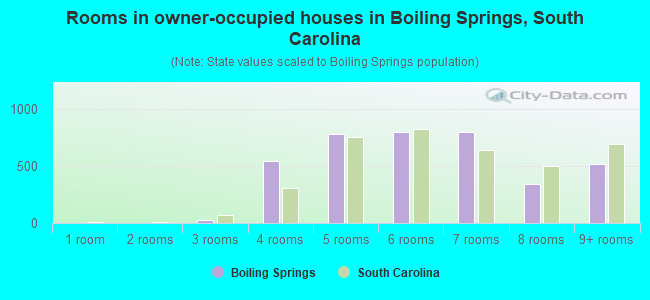
- Rooms in owner-occupied houses in Boiling Springs, South Carolina
- 01 room
- 02 rooms
- 253 rooms
- 5414 rooms
- 7865 rooms
- 8006 rooms
- 8037 rooms
- 3478 rooms
- 5229+ rooms
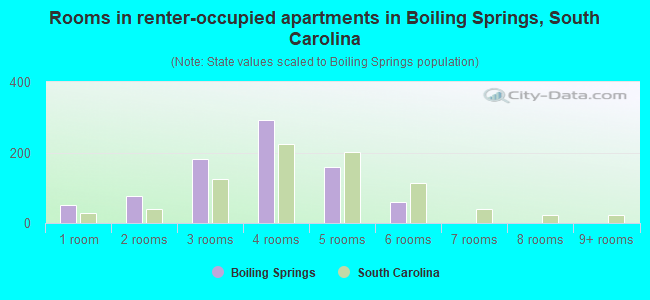
- Rooms in renter-occupied apartments in Boiling Springs, South Carolina
- 501 room
- 762 rooms
- 1813 rooms
- 2934 rooms
- 1605 rooms
- 596 rooms
- 07 rooms
- 08 rooms
- 09+ rooms
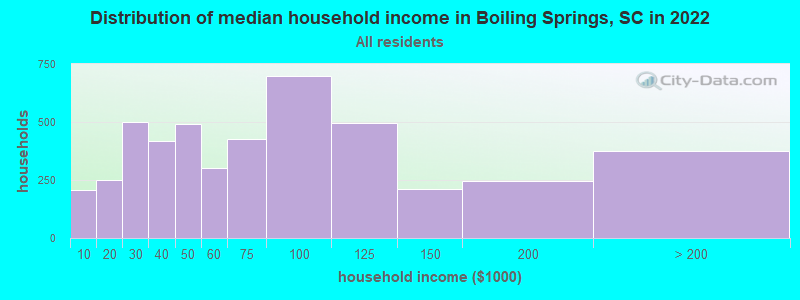
Boiling Springs, SC household income distribution

- 205Less than $10,000
- 252$10,000 to $19,999
- 500$20,000 to $29,999
- 419$30,000 to $39,999
- 491$40,000 to $49,999
- 301$50,000 to $59,999
- 426$60,000 to $74,999
- 699$75,000 to $99,999
- 495$100,000 to $124,999
- 211$125,000 to $149,999
- 247$150,000 to $199,999
- 374$200,000 or more
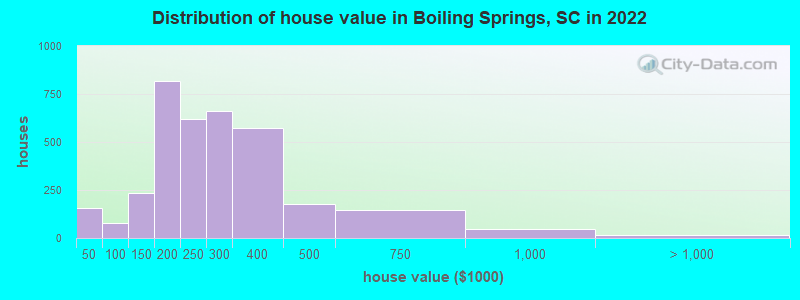
Home value of owner - occupied houses in 2022 in Boiling Springs, SC
-
- 100Less than $10,000
- 13$10,000 to $14,999
- 26$20,000 to $24,999
- 12$25,000 to $29,999
- 25$70,000 to $79,999
- 19$80,000 to $89,999
- 30$90,000 to $99,999
- 56$100,000 to $124,999
- 179$125,000 to $149,999
- 266$150,000 to $174,999
- 550$175,000 to $199,999
- 620$200,000 to $249,999
- 662$250,000 to $299,999
- 574$300,000 to $399,999
- 176$400,000 to $499,999
- 148$500,000 to $749,999
- 49$750,000 to $999,999
- 16$1,000,000 to $1,499,999
Rent paid by renters in 2022 in Boiling Springs, SC
-
- 9$150 to $199
- 161$250 to $299
- 5$300 to $349
- 64$400 to $449
- 30$500 to $549
- 49$600 to $649
- 46$650 to $699
- 33$700 to $749
- 29$750 to $799
- 43$900 to $999
- 290$1,000 to $1,249
- 67$1,250 to $1,499
- 26$1,500 to $1,999
- 49No cash rent
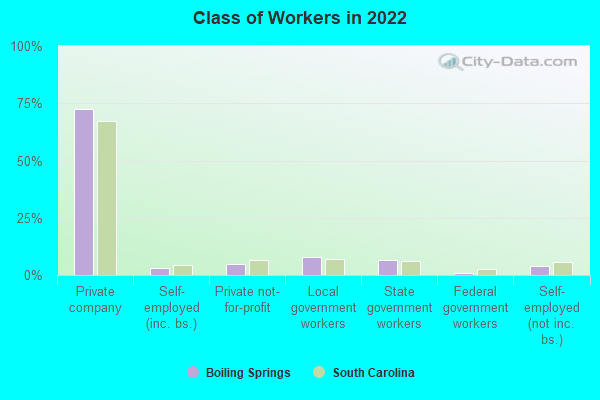
Percentage of workers working in this county: 84.2%
Number of people working at home: 761 (13.8% of all workers)
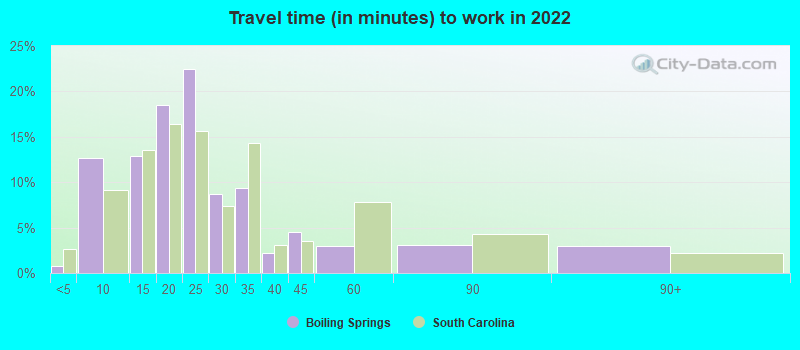
Travel time to work (commute)
- Less than 5 minutes: 15
- 5 to 9 minutes: 278
- 10 to 14 minutes: 262
- 15 to 19 minutes: 1,362
- 20 to 24 minutes: 993
- 25 to 29 minutes: 331
- 30 to 34 minutes: 746
- 35 to 39 minutes: 71
- 40 to 44 minutes: 156
- 45 to 59 minutes: 216
- 60 to 89 minutes: 225
- 90 or more minutes: 271
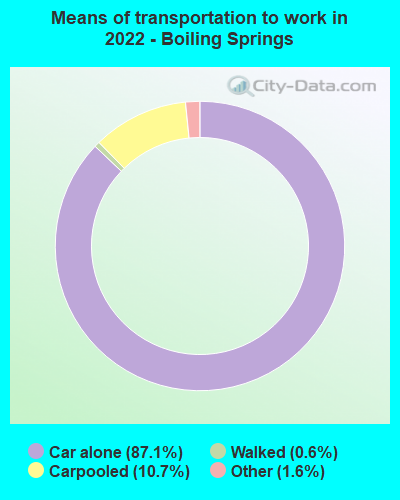
Means of transportation to work:
- Drove a car alone: 2,437 (71.1%)
- Carpooled: 300 (8.7%)
- Taxi: 29 (0.8%)
- Walked: 7 (0.2%)
- Worked at home: 761 (22.2%)
- Unemployment by race in 2022
- Unemployment rate for White non-Hispanic residents
- 0.8%Males
- 6.4%Females
- Unemployment rate for two or more race residents
- 6.7%Females
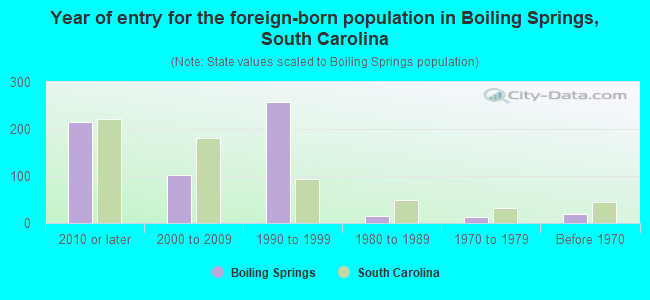
- Year of entry for the foreign-born population in Boiling Springs, South Carolina
- 2142010 or later
- 1022000 to 2009
- 2571990 to 1999
- 151980 to 1989
- 131970 to 1979
- 19Before 1970
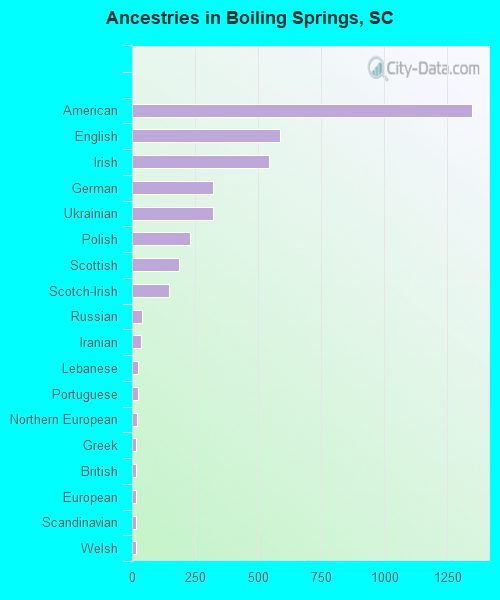
First ancestries reported:
- American: 1,348 (22.8%)
- English: 586 (9.9%)
- Irish: 542 (9.2%)
- German: 322 (5.4%)
- Ukrainian: 321 (5.4%)
- Polish: 228 (3.9%)
- Scottish: 186 (3.1%)
- Scotch-Irish: 147 (2.5%)
- Russian: 40 (0.7%)
- Iranian: 36 (0.6%)
- Lebanese: 23 (0.4%)
- Portuguese: 22 (0.4%)
- Northern European: 18 (0.3%)
- Greek: 17 (0.3%)
- British: 16 (0.3%)
- European: 16 (0.3%)
- Scandinavian: 16 (0.3%)
- Welsh: 14 (0.2%)
- Slovene: 12 (0.2%)
- Swedish: 12 (0.2%)
- Austrian: 10 (0.2%)
- French: 5 (0.08%)
- Italian: 4 (0.07%)
- Swiss: 3 (0.05%)
Most common places of birth for foreign-born residents (%):
| Boiling Springs: | 30.9% (278) |
| South Carolina: | 22.5% (60,774) |
| Boiling Springs: | 22.4% (201) |
| South Carolina: | 1.4% (3,877) |
| Boiling Springs: | 8.5% (76) |
| South Carolina: | 1.5% (3,987) |
| Boiling Springs: | 7.8% (70) |
| South Carolina: | 6.8% (18,307) |
| Boiling Springs: | 5.1% (46) |
| South Carolina: | 0.1% (147) |
| Boiling Springs: | 4.4% (40) |
| South Carolina: | 1.2% (3,296) |
| Boiling Springs: | 3.6% (32) |
| South Carolina: | 0.5% (1,270) |
| Boiling Springs: | 3.2% (29) |
| South Carolina: | 0.7% (1,840) |
| Boiling Springs: | 2.7% (24) |
| South Carolina: | 4.8% (12,834) |
| Boiling Springs: | 2.6% (23) |
| South Carolina: | 3.7% (9,982) |
| Boiling Springs: | 2.3% (21) |
| South Carolina: | 3.2% (8,721) |
| Boiling Springs: | 2.2% (20) |
| South Carolina: | 0.2% (579) |
| Boiling Springs: | 1.8% (16) |
| South Carolina: | 1.3% (3,522) |
Place of birth for U.S.-born residents:
- This state: 6,715
- Other state: 3,849
- Northeast: 563
- Midwest: 470
- South: 2,316
- West: 575
91.0% of Boiling Springs residents lived in the same house 1 years ago.
Out of people who lived in different houses, 27.6% lived in this county.
Out of people who lived in different counties, 3.0% lived in South Carolina.
| Boiling Springs: | 91.0% |
| State average: | 86.5% |
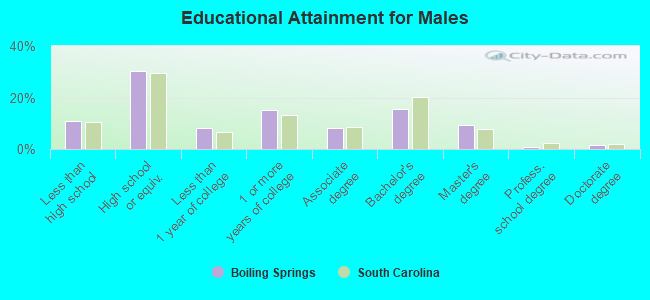
Education attainment for males 25 years and older:
- No schooling: 0
- Nursery to 4th grade: 0
- 5th and 6th grade: 180
- 7th and 8th grade: 0
- 9th grade: 21
- 10th grade: 35
- 11th grade: 98
- 12th grade, no diploma: 47
- High school graduate (or equivalency): 1,069
- Less than 1 year of college: 285
- Some college more than 1 year, no degree: 541
- Associate degree: 289
- Bachelor's degree: 548
- Master's degree: 333
- Professional school degree: 33
- Doctorate degree: 50
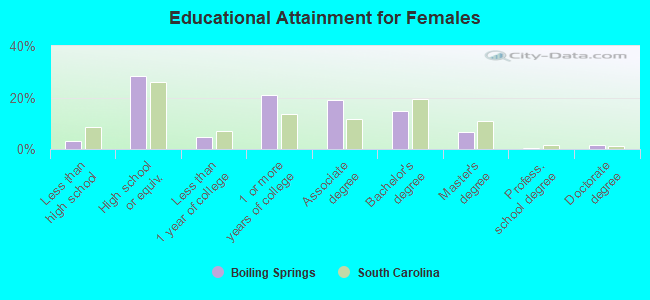
Education attainment for females 25 years and older:
- No schooling: 18
- Nursery to 4th grade: 0
- 5th and 6th grade: 0
- 7th and 8th grade: 0
- 9th grade: 14
- 10th grade: 55
- 11th grade: 31
- 12th grade, no diploma: 21
- High school graduate (or equivalency): 1,210
- Less than 1 year of college: 206
- Some college more than 1 year, no degree: 900
- Associate degree: 811
- Bachelor's degree: 631
- Master's degree: 278
- Professional school degree: 15
- Doctorate degree: 64


Housing units in structures:
- One, detached: 3,730
- One, attached: 99
- Two: 5
- 3 or 4: 61
- 5 to 9: 137
- 10 to 19: 154
- 20 to 49: 235
- 50 or more: 8
- Mobile homes: 182
Median worth of mobile homes: $11,740
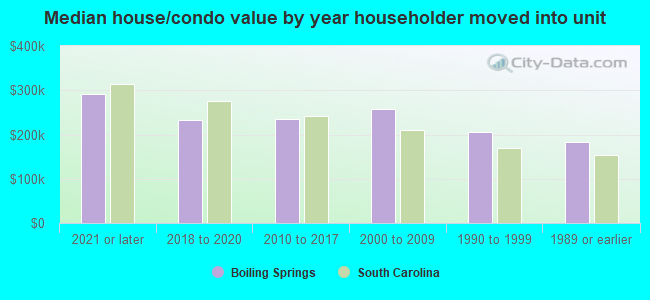
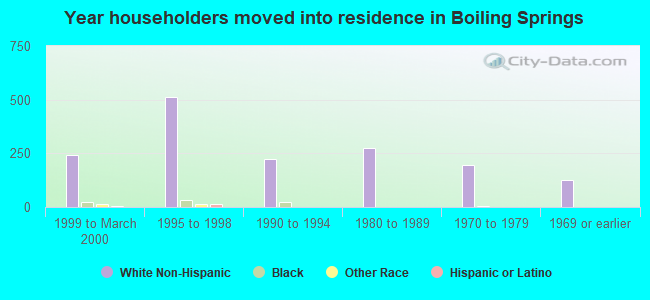
House/condo owner moved in on average 7 years ago
Renter moved in on average 1 years ago
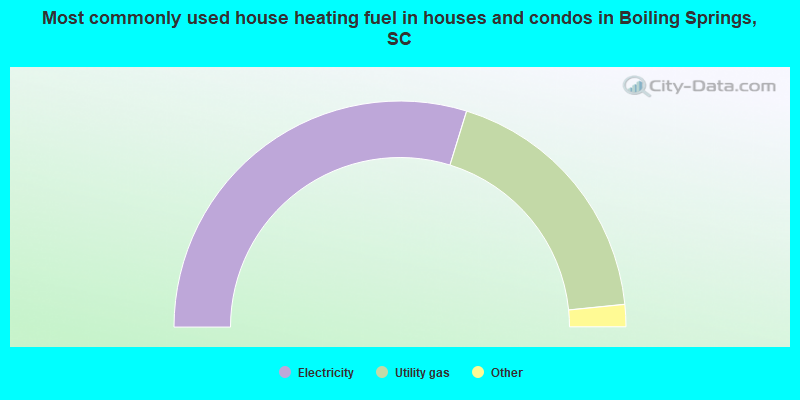
- 59.6%Electricity
- 37.3%Utility gas
- 1.8%Bottled, tank, or LP gas
- 0.9%Other fuel
- 0.3%Solar energy
- 0.2%No fuel used
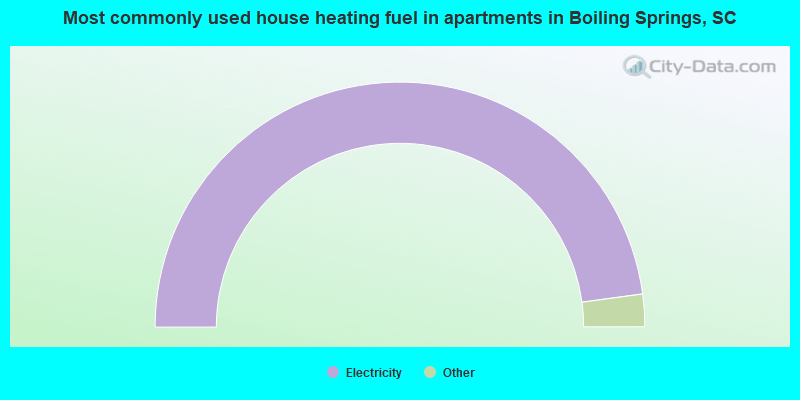
- 95.7%Electricity
- 2.7%Other fuel
- 1.6%Utility gas
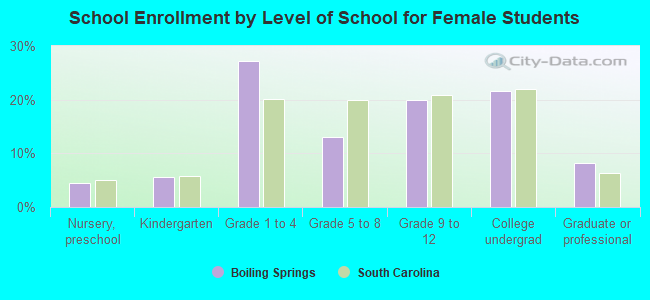
Private vs. public school enrollment:
| Here: | 13.4% |
| South Carolina: | 14.4% |
| Here: | 18.7% |
| South Carolina: | 11.1% |
| Here: | 33.3% |
| South Carolina: | 21.9% |