Median price asked for vacant for-sale houses and condos in 2022 in this county: $275,138.
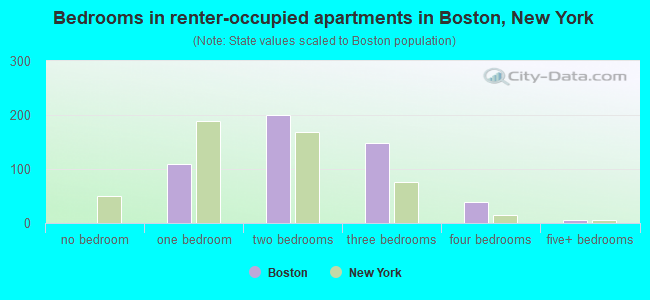
Median contract rent in 2022: $948 (lower quartile is $727, upper quartile is $1,196)
Median rent asked for vacant for-rent units in 2022: $1,113
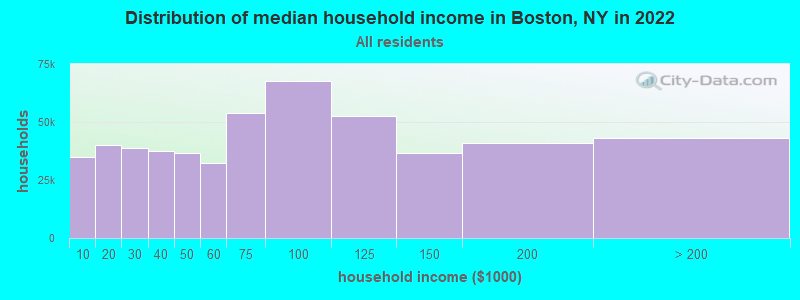
Median gross rent in Boston, NY in 2022: $1,080
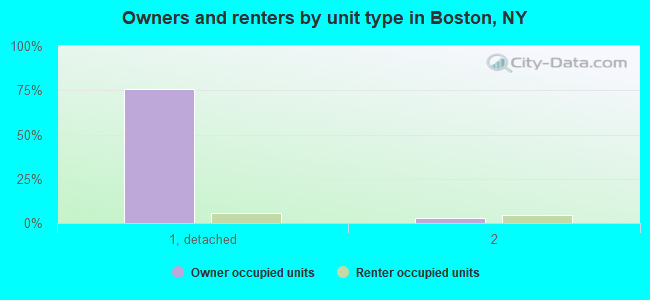
Housing units in Boston with a mortgage: 1,369 (66 second mortgage, 282 home equity loan, 7 both second mortgage and home equity loan) Houses without a mortgage: 587
In family households: 703,665 (150,587 male householders, 79,422 female householders)
161,163 spouses, 259,954 children (245,472 natural, 6,125 adopted, 8,357 stepchildren), 13,651 grandchildren, 7,172 brothers or sisters, 6,060 parents, foster children, 6,352 other relatives, 16,208 non-relatives
In nonfamily households: 186,988 (69,279 male householders (54,381 living alone)), 83,876 female householders (72,187 living alone)), 33,833 nonrelatives
In group quarters: 28,387 (12,145 institutionalized population)
148,778 married couples with children.
64,240 single-parent households (9,850 men, 54,390 women).
96.0% of residents of Boston speak English at home.
1.2% of residents speak Spanish at home (40% speak English very well, 27% speak English well, 33% speak English not well).
2.2% of residents speak other Indo-European language at home (86% speak English very well, 9% speak English well, 4% speak English not well).
0.1% of residents speak Asian or Pacific Island language at home (100% speak English very well).
0.5% of residents speak other language at home (100% speak English very well).
Foreign born population: 390 (4.9%)
(55.6% of them are naturalized citizens)
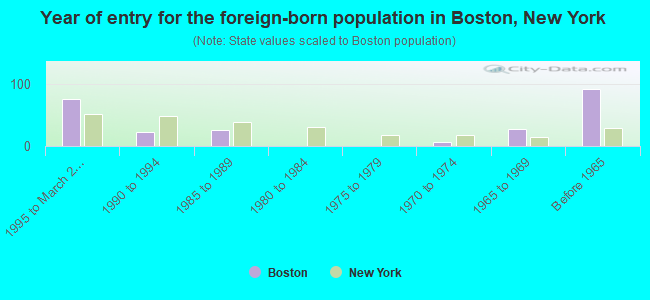
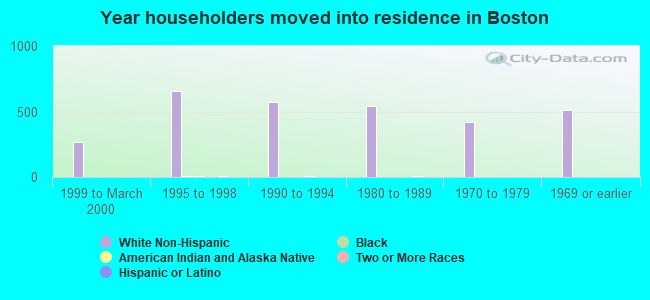
Year of entry for the foreign-born population in Boston, New York
761995 to March 2000
221990 to 1994
261985 to 1989
01980 to 1984
01975 to 1979
71970 to 1974
271965 to 1969
91Before 1965
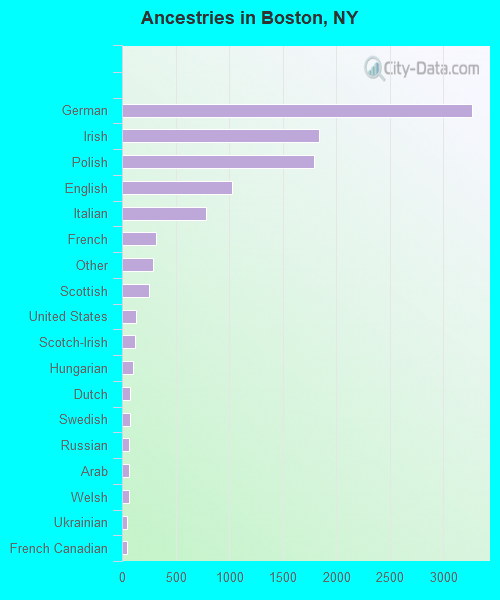
First ancestries reported:
German: 3,262 (31.2%)
Irish: 1,841 (17.6%)
Polish: 1,789 (17.1%)
English: 1,028 (9.8%)
Italian: 785 (7.5%)
French: 316 (3.0%)
Other: 292 (2.8%)
Scottish: 250 (2.4%)
United States: 133 (1.3%)
Scotch-Irish: 120 (1.1%)
Hungarian: 104 (1.0%)
Dutch: 74 (0.7%)
Swedish: 71 (0.7%)
Russian: 65 (0.6%)
Arab: 64 (0.6%)
Welsh: 64 (0.6%)
Ukrainian: 48 (0.5%)
French Canadian: 44 (0.4%)
Lithuanian: 22 (0.2%)
Portuguese: 22 (0.2%)
Slovak: 19 (0.2%)
Czech: 18 (0.2%)
Swiss: 18 (0.2%)
Norwegian: 9 (0.09%)
Most common places of birth for foreign-born residents (%):
Canada
Boston:
20.9% (52)
New York:
1.4% (54,876)
Germany
Boston:
11.6% (29)
New York:
1.8% (69,327)
Other Western Asia
Boston:
10.4% (26)
New York:
0.5% (20,012)
Portugal
Boston:
6.8% (17)
New York:
0.3% (13,508)
United Kingdom
Boston:
6.0% (15)
New York:
1.6% (62,237)
Russia
Boston:
6.0% (15)
New York:
2.4% (94,595)
Romania
Boston:
5.2% (13)
New York:
0.6% (25,059)
South Africa
Boston:
4.8% (12)
New York:
0.1% (4,273)
Yugoslavia
Boston:
4.0% (10)
New York:
0.7% (25,688)
Korea
Boston:
3.6% (9)
New York:
2.5% (97,933)
France
Boston:
3.2% (8)
New York:
0.5% (20,310)
Other Eastern Europe
Boston:
2.8% (7)
New York:
1.4% (53,825)
Cambodia
Boston:
2.8% (7)
New York:
0.1% (3,269)
Italy
Boston:
2.4% (6)
New York:
3.8% (147,729)
Hungary
Boston:
2.4% (6)
New York:
0.4% (17,401)
Poland
Boston:
2.4% (6)
New York:
2.4% (93,187)
Colombia
Boston:
2.4% (6)
New York:
2.9% (111,727)
Austria
Boston:
2.0% (5)
New York:
0.3% (11,299)
Place of birth for U.S.-born residents:
This state: 6,998
Other state: 602
Northeast: 300
Midwest: 117
South: 133
West: 52
73% of Boston residents lived in the same house 5 years ago. Out of people who lived in different houses, 91% lived in this county. Out of people who lived in different counties, 55% lived in New York.
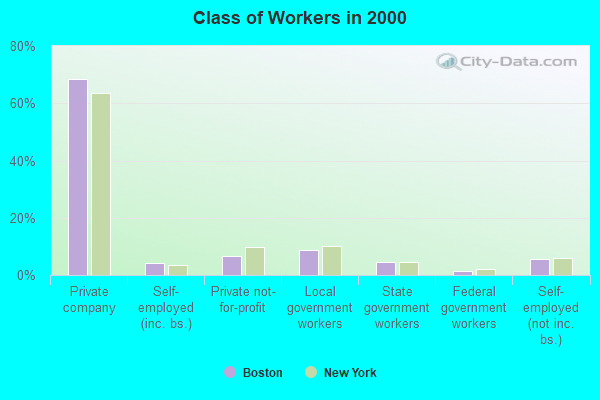
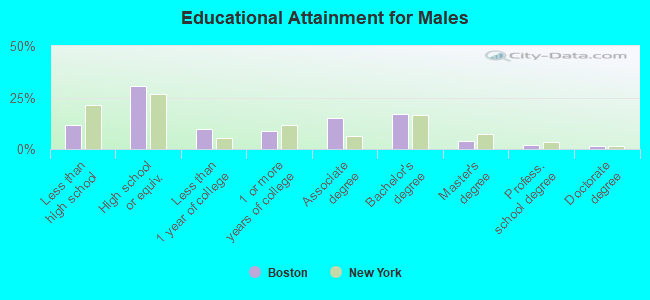
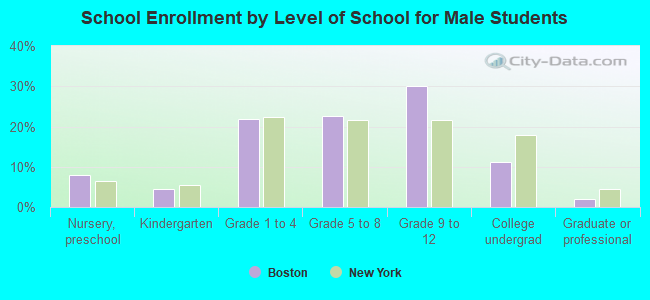
Education attainment for males 25 years and older:
No schooling: 13
Nursery to 4th grade: 0
5th and 6th grade: 21
7th and 8th grade: 85
9th grade: 33
10th grade: 66
11th grade: 46
12th grade, no diploma: 39
High school graduate (or equivalency): 792
Less than 1 year of college: 252
Some college more than 1 year, no degree: 225
Associate degree: 387
Bachelor's degree: 437
Master's degree: 98
Professional school degree: 48
Doctorate degree: 36
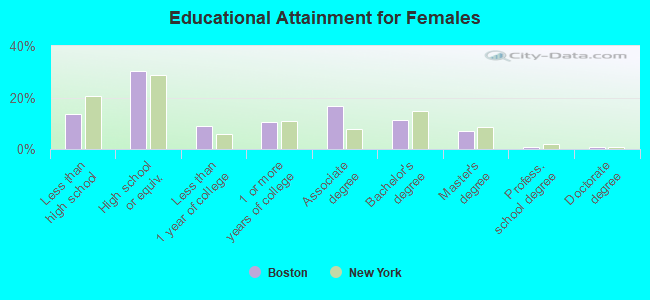
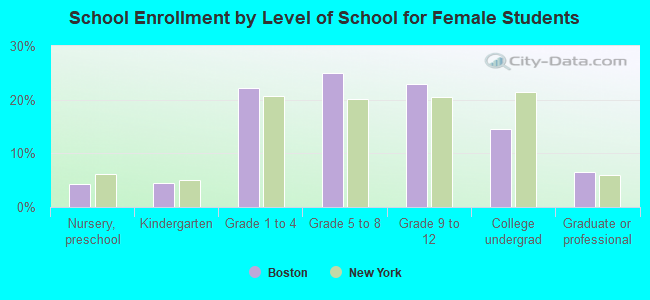
Education attainment for females 25 years and older: