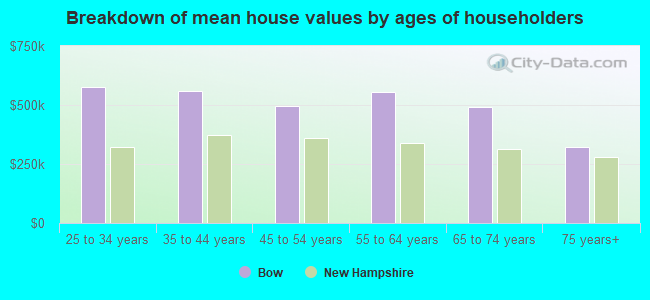
Bow, NH (New Hampshire) Houses and Residents
| Bow: | $537,327 |
| New Hampshire: | $384,700 |
Total population: 7,519 (Urban population: 2,818 (all inside urban clusters), Rural population: 4,320 (20 farm, 4,300 nonfarm))
Houses: 2,330 (2,304 occupied: 2,194 owner occupied, 110 renter occupied)
| % of renters here: | 5% |
| State: | 28% |
Housing density: 83 houses/condos per square mile
Median price asked for vacant for-sale houses and condos in 2022 in this county: $157,149.
Median contract rent in 2022: $1,134 (lower quartile is $924, upper quartile is $1,419)
Median gross rent in Bow, NH in 2022: $1,537
Housing units in Bow with a mortgage: 1,633 (136 second mortgage, 274 home equity loan, 10 both second mortgage and home equity loan)
Houses without a mortgage: 420
Compare current foreclosures near Bow, NH:
| Photo | Address | Area | Beds / Baths | Price | Details |
|---|---|---|---|---|---|

|
#1
Van Ger Dr
Bow, NH 03304
|
2,498 sq. feet
|
2 baths 3 beds |
show details | |

|
#2
Juniper Ln
Bow, NH 03304
|
- sq. feet
|
- baths - beds |
show details | |

|
#3
Dicandra Dr
Bow, NH 03304
|
- sq. feet
|
- baths - beds |
show details | |

|
#4
Fairview Dr
Pittsfield, NH 03263
|
2,070 sq. feet
|
2 baths 3 beds |
show details | |

|
#5
Blucher St
Manchester, NH 03102
|
2,448 sq. feet
|
2 baths 3 beds |
show details | |

|
#6
Donati Dr
Hooksett, NH 03106
|
2,269 sq. feet
|
3 baths 5 beds |
show details | |

|
#7
Elm St
Manchester, NH 03104
|
4,352 sq. feet
|
3 baths 3 beds |
show details | |

|
#8
N State St
Concord, NH 03301
|
1,920 sq. feet
|
1 baths 3 beds |
show details | |

|
#9
Wallace Rd
Goffstown, NH 03045
|
1,848 sq. feet
|
1 baths 2 beds |
show details | |

|
#10
Embassy Ave
Hooksett, NH 03106
|
816 sq. feet
|
1 baths 2 beds |
show details |
| Photo | Address | Area | Beds / Baths | Price | Details |
|---|---|---|---|---|---|

|
#11
Normand St
Manchester, NH 03109
|
1,502 sq. feet
|
2 baths 3 beds |
show details | |

|
#12
Westland Ave
Manchester, NH 03103
|
1,752 sq. feet
|
1 baths 3 beds |
show details | |

|
#13
Clay St # 2
Manchester, NH 03103
|
2,240 sq. feet
|
2 baths 4 beds |
show details | |

|
#14
Pinard St
Manchester, NH 03102
|
2,028 sq. feet
|
2 baths 5 beds |
show details | |

|
#15
Whitehall Rd
Hooksett, NH 03106
|
2,740 sq. feet
|
2 baths 5 beds |
show details | |

|
#16
Richmond Dr
Concord, NH 03303
|
1,776 sq. feet
|
2 baths 3 beds |
show details | |

|
#17
Holbrook Rd
Bedford, NH 03110
|
3,376 sq. feet
|
2 baths 4 beds |
show details | |

|
#18
Abbott Rd
Concord, NH 03303
|
1,386 sq. feet
|
1 baths 2 beds |
show details | |

|
#19
Diamond Ln
Goffstown, NH 03045
|
2,464 sq. feet
|
1 baths 4 beds |
show details | |

|
#20
Silver St Apt 105
Manchester, NH 03103
|
924 sq. feet
|
1 baths 2 beds |
show details |
| Photo | Address | Area | Beds / Baths | Price | Details |
|---|---|---|---|---|---|

|
#21
Skyline Ave
Hooksett, NH 03106
|
928 sq. feet
|
2 baths 2 beds |
show details | |

|
#22
Lowell St # 1
Manchester, NH 03104
|
2,184 sq. feet
|
2 baths 6 beds |
show details | |

|
#23
Parker Ave
Manchester, NH 03102
|
1,352 sq. feet
|
1 baths 3 beds |
show details | |

|
#24
Auburn Rd
Hooksett, NH 03106
|
1,800 sq. feet
|
2 baths 3 beds |
show details | |

|
#25
Delaware Ave # 1
Manchester, NH 03104
|
2,946 sq. feet
|
3 baths 8 beds |
show details | |

|
#26
Liberty St # 2
Manchester, NH 03104
|
1,987 sq. feet
|
2 baths 5 beds |
show details | |

|
#27
Hidden Ranch Dr
Hooksett, NH 03106
|
903 sq. feet
|
1 baths 1 beds |
show details | |

|
#28
Wells St
Manchester, NH 03104
|
2,800 sq. feet
|
1 baths 3 beds |
show details | |

|
#29
Cedar St
Manchester, NH 03103
|
2,614 sq. feet
|
2 baths 6 beds |
show details | |

|
#30
Channel Ln
Goffstown, NH 03045
|
812 sq. feet
|
1 baths 2 beds |
show details |
| Photo | Address | Area | Beds / Baths | Price | Details |
|---|---|---|---|---|---|

|
#31
Moose Club Park Rd
Goffstown, NH 03045
|
1,864 sq. feet
|
2 baths 4 beds |
show details | |

|
#32
Longbrook Rd
Goffstown, NH 03045
|
1,960 sq. feet
|
2 baths 3 beds |
show details | |

|
#33
Rockland Ave
Manchester, NH 03102
|
1,870 sq. feet
|
1 baths 3 beds |
show details | |

|
#34
Merrimack St # 2
Manchester, NH 03103
|
2,436 sq. feet
|
2 baths 6 beds |
show details | |

|
#35
Arnold St
Manchester, NH 03102
|
1,792 sq. feet
|
1 baths 4 beds |
show details | |

|
#36
Coral Ave
Manchester, NH 03104
|
2,464 sq. feet
|
2 baths 3 beds |
show details | |

|
#37
W Elmwood Ave
Manchester, NH 03103
|
2,304 sq. feet
|
2 baths 4 beds |
show details | |

|
#38
Pinnacle St
Hooksett, NH 03106
|
2,238 sq. feet
|
2 baths 3 beds |
show details | |

|
#39
Dunnington Way
Bedford, NH 03110
|
1,522 sq. feet
|
2 baths 4 beds |
show details | |

|
#40
Dunnington Way F/k/a 86 Gault Road
Bedford, NH Array
|
1,522 sq. feet
|
2 baths 4 beds |
show details |
| Photo | Address | Area | Beds / Baths | Price | Details |
|---|---|---|---|---|---|

|
#41
Westwood Dr
Manchester, NH 03103
|
2,086 sq. feet
|
1 baths 3 beds |
show details | |

|
#42
Fairview Road Aka 42 Fairview Drive
Pittsfield, NH Array
|
2,078 sq. feet
|
2 baths 3 beds |
show details | |

|
#43
Denmark Dr
Northwood, NH 03261
|
1,809 sq. feet
|
2 baths 3 beds |
show details | |

|
#44
Public St
Manchester, NH 03103
|
1,396 sq. feet
|
1 baths 3 beds |
show details | |

|
#45
S Fruit St
Concord, NH 03301
|
1,768 sq. feet
|
2 baths 4 beds |
show details | |

|
#46
Beech Hill Ave
Manchester, NH 03103
|
1,596 sq. feet
|
1 baths 2 beds |
show details | |

|
#47
Megan Dr
Manchester, NH 03109
|
2,244 sq. feet
|
1 baths 3 beds |
show details | |

|
#48
Glen Rd
Bedford, NH 03110
|
3,094 sq. feet
|
2 baths 4 beds |
show details | |

|
#49
Cross Country Rd
Suncook, NH 03275
|
- sq. feet
|
1 baths 3 beds |
show details | |

|
Check over 1 million property listings on Foreclosure.com!
|
browse all offers | |||

Household type by relationship:
Households: 140,110- In family households: 115,678 (26,768 male householders, 11,336 female householders)
29,923 spouses, 38,562 children (35,656 natural, 1,027 adopted, 1,879 stepchildren), 2,012 grandchildren, 719 brothers or sisters, 975 parents, foster children, 854 other relatives, 3,672 non-relatives
- In nonfamily households: 24,432 (8,542 male householders (6,084 living alone)), 10,423 female householders (8,405 living alone)), 5,467 nonrelatives
- In group quarters: 6,335 (3,155 institutionalized population)
24,231 married couples with children.
7,348 single-parent households (1,859 men, 5,489 women).
95.5% of residents of Bow speak English at home.
1.2% of residents speak Spanish at home (70% speak English very well, 20% speak English well, 10% speak English not well).
3.0% of residents speak other Indo-European language at home (79% speak English very well, 12% speak English well, 9% speak English not well).
0.3% of residents speak Asian or Pacific Island language at home (100% speak English very well).
Foreign born population: 208 (2.5%)
(97.1% of them are naturalized citizens)
| Here: | 7.6 |
| State: | 6.4 |
| Here: | 5.8 |
| State: | 4.0 |
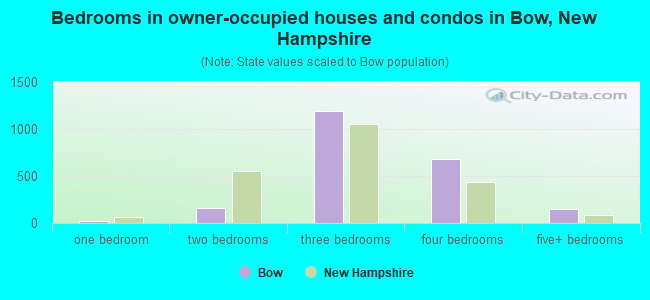
- Bedrooms in owner-occupied houses and condos in Bow, New Hampshire
- 0no bedroom
- 161 bedroom
- 1612 bedrooms
- 1,1893 bedrooms
- 6844 bedrooms
- 1445+ bedrooms
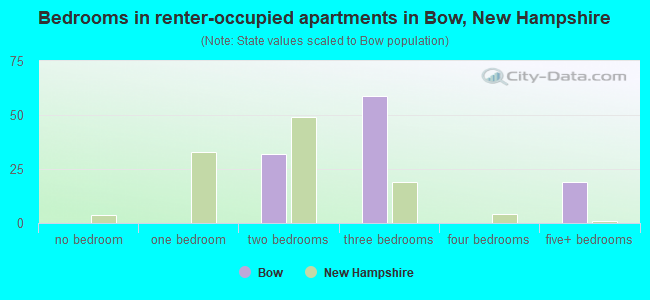
- Bedrooms in renter-occupied apartments in Bow, New Hampshire
- 0no bedroom
- 01 bedroom
- 322 bedrooms
- 593 bedrooms
- 04 bedrooms
- 195+ bedrooms
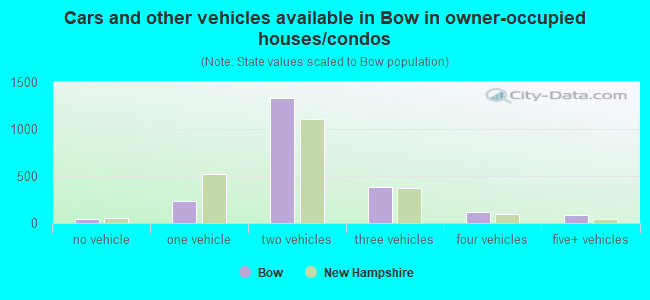
- Cars and other vehicles available in Bow in owner-occupied houses/condos
- 47no vehicle
- 2301 vehicle
- 1,3262 vehicles
- 3873 vehicles
- 1204 vehicles
- 845+ vehicles
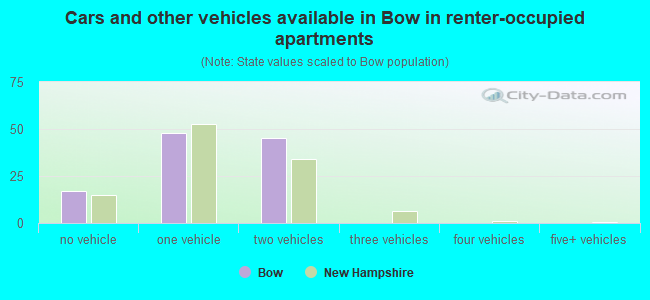
- Cars and other vehicles available in Bow in renter-occupied apartments
- 17no vehicle
- 481 vehicle
- 452 vehicles
- 03 vehicles
- 04 vehicles
- 05+ vehicles
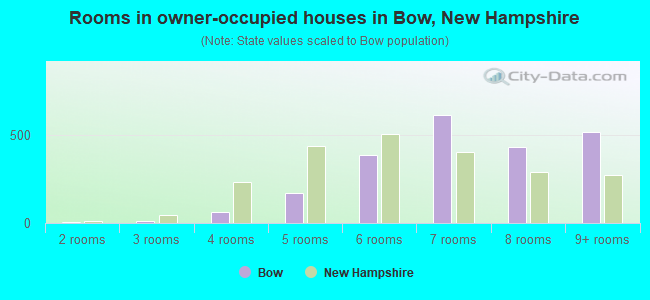
- Rooms in owner-occupied houses in Bow, New Hampshire
- 01 room
- 62 rooms
- 103 rooms
- 624 rooms
- 1725 rooms
- 3856 rooms
- 6127 rooms
- 4318 rooms
- 5169+ rooms
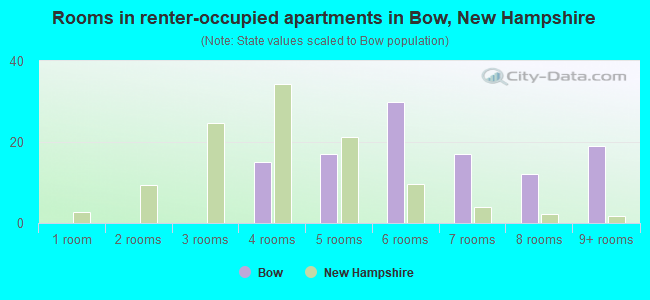
- Rooms in renter-occupied apartments in Bow, New Hampshire
- 01 room
- 02 rooms
- 03 rooms
- 154 rooms
- 175 rooms
- 306 rooms
- 177 rooms
- 128 rooms
- 199+ rooms
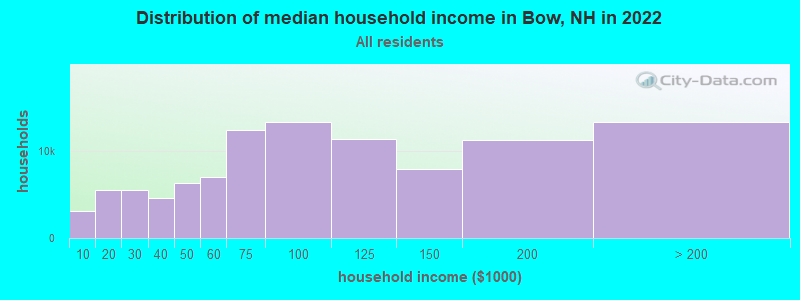
Bow, NH household income distribution

- 3,075Less than $10,000
- 5,541$10,000 to $19,999
- 5,475$20,000 to $29,999
- 4,539$30,000 to $39,999
- 6,267$40,000 to $49,999
- 7,030$50,000 to $59,999
- 12,443$60,000 to $74,999
- 13,277$75,000 to $99,999
- 11,353$100,000 to $124,999
- 7,870$125,000 to $149,999
- 11,211$150,000 to $199,999
- 13,323$200,000 or more
Percentage of workers working in this county: 69.0%
Number of people working at home: 734 (17.3% of all workers)
Travel time to work (commute)
- Less than 5 minutes: 21
- 5 to 9 minutes: 237
- 10 to 14 minutes: 652
- 15 to 19 minutes: 733
- 20 to 24 minutes: 621
- 25 to 29 minutes: 210
- 30 to 34 minutes: 349
- 35 to 39 minutes: 67
- 40 to 44 minutes: 75
- 45 to 59 minutes: 212
- 60 to 89 minutes: 173
- 90 or more minutes: 88
Means of transportation to work:
- Drove a car alone: 3,221 (88.1%)
- Carpooled: 210 (5.7%)
- Other means: 7 (0.2%)
- Worked at home: 216 (5.9%)
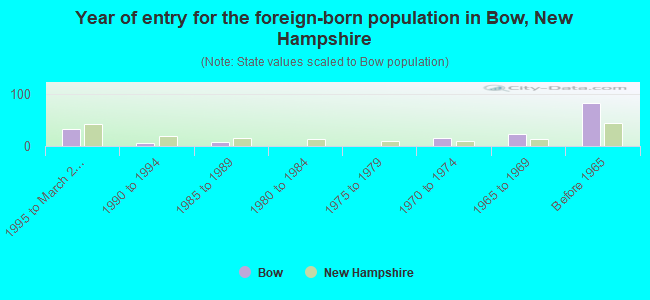
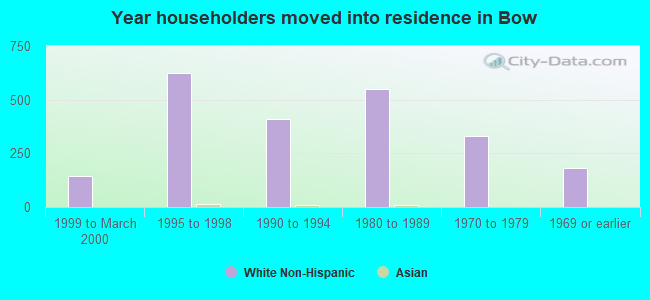
- Year of entry for the foreign-born population in Bow, New Hampshire
- 331995 to March 2000
- 61990 to 1994
- 71985 to 1989
- 01980 to 1984
- 01975 to 1979
- 161970 to 1974
- 231965 to 1969
- 82Before 1965
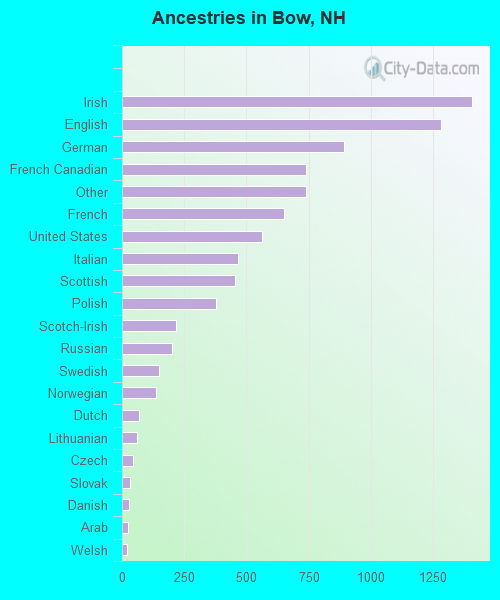
First ancestries reported:
- Irish: 1,405 (16.3%)
- English: 1,283 (14.9%)
- German: 891 (10.4%)
- French Canadian: 740 (8.6%)
- Other: 738 (8.6%)
- French: 651 (7.6%)
- United States: 561 (6.5%)
- Italian: 467 (5.4%)
- Scottish: 455 (5.3%)
- Polish: 378 (4.4%)
- Scotch-Irish: 218 (2.5%)
- Russian: 201 (2.3%)
- Swedish: 149 (1.7%)
- Norwegian: 138 (1.6%)
- Dutch: 67 (0.8%)
- Lithuanian: 61 (0.7%)
- Czech: 44 (0.5%)
- Slovak: 31 (0.4%)
- Danish: 29 (0.3%)
- Arab: 25 (0.3%)
- Welsh: 21 (0.2%)
- Ukrainian: 10 (0.1%)
- Hungarian: 9 (0.1%)
- Portuguese: 9 (0.1%)
- West Indian: 7 (0.08%)
- Greek: 6 (0.07%)
Most common places of birth for foreign-born residents (%):
| Bow: | 17.4% (29) |
| New Hampshire: | 22.9% (12,397) |
| Bow: | 14.4% (24) |
| New Hampshire: | 8.1% (4,396) |
| Bow: | 10.2% (17) |
| New Hampshire: | 4.9% (2,670) |
| Bow: | 7.8% (13) |
| New Hampshire: | 0.9% (508) |
| Bow: | 7.8% (13) |
| New Hampshire: | 4.7% (2,530) |
| Bow: | 7.2% (12) |
| New Hampshire: | 1.7% (931) |
| Bow: | 6.0% (10) |
| New Hampshire: | 1.3% (689) |
| Bow: | 6.0% (10) |
| New Hampshire: | 0.2% (116) |
| Bow: | 5.4% (9) |
| New Hampshire: | 2.7% (1,440) |
| Bow: | 4.8% (8) |
| New Hampshire: | 3.4% (1,828) |
| Bow: | 4.8% (8) |
| New Hampshire: | 0.5% (252) |
| Bow: | 4.2% (7) |
| New Hampshire: | 1.9% (1,031) |
| Bow: | 4.2% (7) |
| New Hampshire: | 0.2% (125) |
Place of birth for U.S.-born residents:
- This state: 3,630
- Other state: 3,274
- Northeast: 2,363
- Midwest: 292
- South: 365
- West: 254
66% of Bow residents lived in the same house 5 years ago.
Out of people who lived in different houses, 53% lived in this county.
Out of people who lived in different counties, 41% lived in New Hampshire.
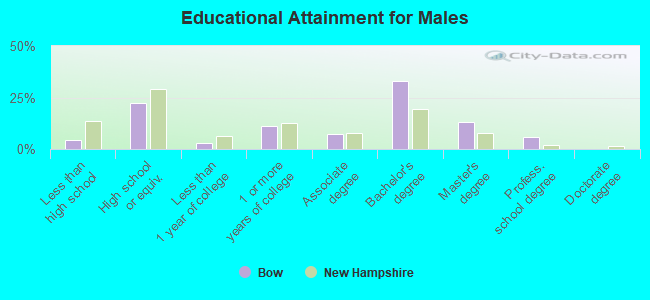
Education attainment for males 25 years and older:
- No schooling: 0
- Nursery to 4th grade: 6
- 5th and 6th grade: 7
- 7th and 8th grade: 18
- 9th grade: 22
- 10th grade: 16
- 11th grade: 15
- 12th grade, no diploma: 10
- High school graduate (or equivalency): 504
- Less than 1 year of college: 66
- Some college more than 1 year, no degree: 250
- Associate degree: 158
- Bachelor's degree: 740
- Master's degree: 291
- Professional school degree: 129
- Doctorate degree: 4
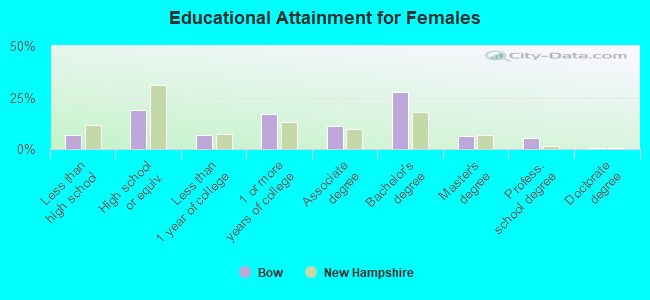
Education attainment for females 25 years and older:
- No schooling: 0
- Nursery to 4th grade: 0
- 5th and 6th grade: 15
- 7th and 8th grade: 8
- 9th grade: 22
- 10th grade: 44
- 11th grade: 30
- 12th grade, no diploma: 35
- High school graduate (or equivalency): 441
- Less than 1 year of college: 159
- Some college more than 1 year, no degree: 398
- Associate degree: 262
- Bachelor's degree: 638
- Master's degree: 141
- Professional school degree: 120
- Doctorate degree: 7


Housing units in structures:
- One, detached: 2,301
- One, attached: 11
- 3 or 4: 12
- Mobile homes: 6
Median worth of mobile homes: $93,250
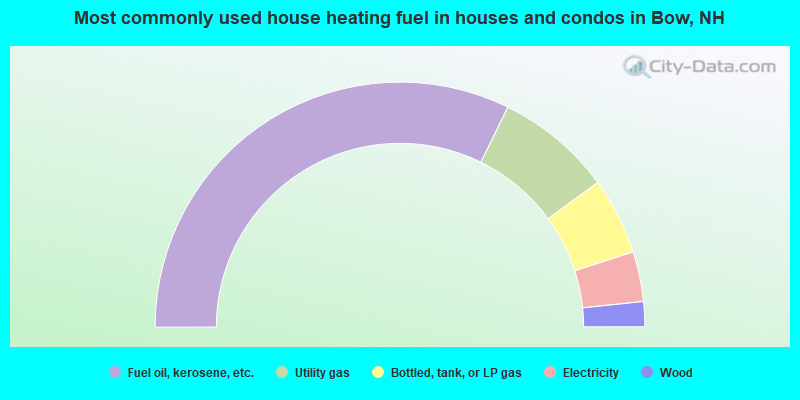
- 64.6%Fuel oil, kerosene, etc.
- 15.4%Utility gas
- 10.2%Bottled, tank, or LP gas
- 6.6%Electricity
- 3.3%Wood
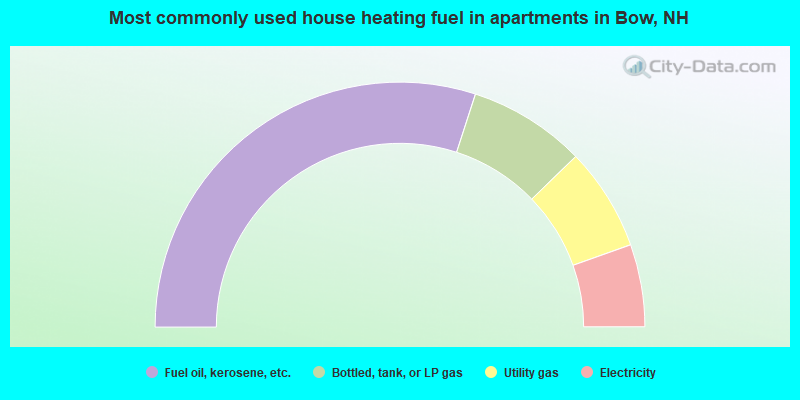
- 60.0%Fuel oil, kerosene, etc.
- 15.5%Bottled, tank, or LP gas
- 13.6%Utility gas
- 10.9%Electricity
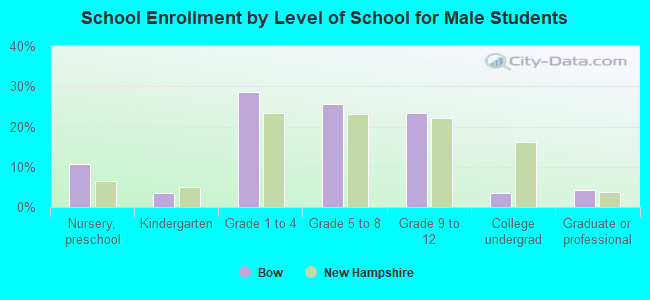
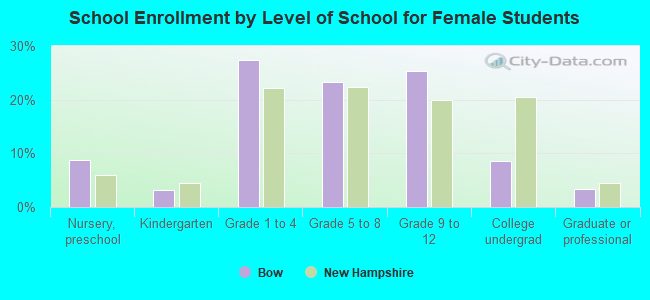
Private vs. public school enrollment:
| Here: | 3.8% |
| New Hampshire: | 8.9% |
| Here: | 4.9% |
| New Hampshire: | 10.7% |
| Here: | 21.1% |
| New Hampshire: | 36.4% |