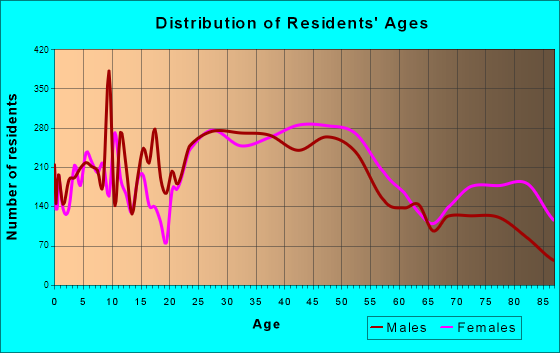
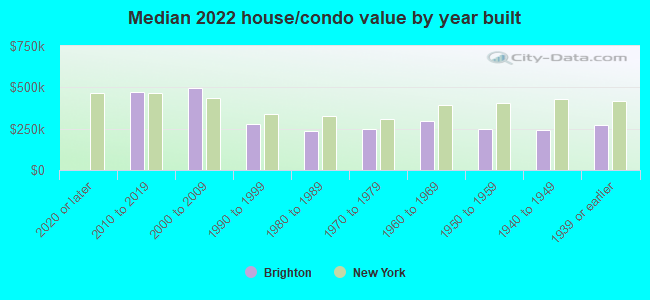
Brighton, NY (New York) Houses and Residents
| Brighton: | $259,024 |
| New York: | $400,400 |
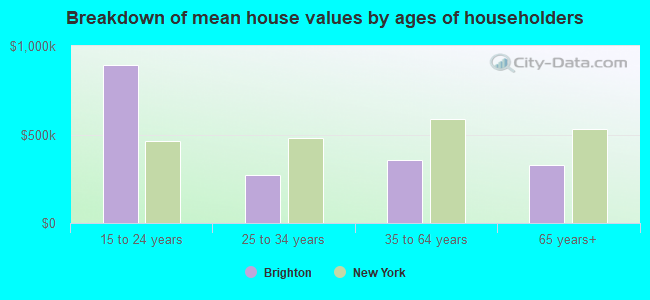
Mean price in 2022:
Detached houses: $297,764
Here: $297,764 State: $476,719 Townhouses or other attached units: $223,797
Here: $223,797 State: $699,270 In 2-unit structures: $388,469
Here: $388,469 State: $713,077 In 3-to-4-unit structures: $384,385
Here: $384,385 State: $764,568 In 5-or-more-unit structures: $294,303
Here: $294,303 State: $912,009 Mobile homes: $7,337
Here: $7,337 State: $88,925
Total population: 36,609 (Urban population: 35,588, Rural population: 0)
Houses: 17,189 (16,052 occupied: 8,984 owner occupied, 7,177 renter occupied)
| % of renters here: | 44% |
| State: | 46% |
Housing density: 1,113 houses/condos per square mile
Median price asked for vacant for-sale houses and condos in 2022: $140,652.
Median contract rent in 2022: $1,165 (lower quartile is $1,014, upper quartile is $1,419)
Median rent asked for vacant for-rent units in 2022: $1,805
Median gross rent in Brighton, NY in 2022: $1,213
Housing units in Brighton with a mortgage: 4,961 (593 second mortgage, 10 home equity loan, 556 both second mortgage and home equity loan)
Houses without a mortgage: 572
Median household income for houses/condos with a mortgage: $128,588
Median household income for apartments without a mortgage: $96,828
Median monthly housing costs: $1,250
Compare current foreclosures near Brighton, NY:
| Photo | Address | Area | Beds / Baths | Price | Details |
|---|---|---|---|---|---|

|
#1
Garson Ave
Rochester, NY 14609
|
1,736 sq. feet
|
1 baths 4 beds |
$149,900
|
show details |

|
#2
Rand St
Rochester, NY 14615
|
1,080 sq. feet
|
1 baths 3 beds |
show details | |

|
#3
Pullman Ave
Rochester, NY 14615
|
1,620 sq. feet
|
1 baths 5 beds |
show details | |

|
#4
-585 Flower City Par
Rochester, NY 14615
|
- sq. feet
|
2 baths 6 beds |
show details | |

|
#5
Five Mile Line Rd
Webster, NY 14580
|
821 sq. feet
|
2 baths 3 beds |
show details | |

|
#6
Latta Rd
Rochester, NY 14612
|
2,422 sq. feet
|
2 baths 3 beds |
show details | |

|
#7
Gene Dr
Rochester, NY 14624
|
1,478 sq. feet
|
2 baths 3 beds |
show details | |

|
#8
Lyell Rd
Rochester, NY 14606
|
1,841 sq. feet
|
2 baths 3 beds |
show details | |

|
#9
Winbourne Rd
Rochester, NY 14611
|
1,398 sq. feet
|
1 baths 4 beds |
show details | |

|
#10
Birr St
Rochester, NY 14613
|
1,472 sq. feet
|
2 baths 3 beds |
show details |
| Photo | Address | Area | Beds / Baths | Price | Details |
|---|---|---|---|---|---|

|
#11
Cheese Factory Rd
Honeoye Falls, NY 14472
|
1,200 sq. feet
|
2 baths 4 beds |
show details | |

|
#12
Fairview Ct
Rochester, NY 14612
|
1,350 sq. feet
|
1 baths 3 beds |
show details | |

|
#13
Swansea Park
Rochester, NY 14616
|
1,080 sq. feet
|
1 baths 2 beds |
show details | |

|
#14
Gorton Ave
Hilton, NY 14468
|
1,496 sq. feet
|
1 baths 4 beds |
show details | |

|
#15
Leonard Rd
Rochester, NY 14616
|
1,260 sq. feet
|
1 baths 3 beds |
show details | |

|
#16
Stal Mar Cir
Rochester, NY 14624
|
1,989 sq. feet
|
2 baths 4 beds |
show details | |

|
#17
River St
Rochester, NY 14612
|
1,109 sq. feet
|
1 baths 3 beds |
show details | |

|
#18
Pontiac St
Webster, NY 14580
|
875 sq. feet
|
1 baths 3 beds |
show details | |

|
#19
Mickens Bnd
West Henrietta, NY 14586
|
1,040 sq. feet
|
1 baths 2 beds |
show details | |

|
#20
Woodhill Dr
Rochester, NY 14616
|
936 sq. feet
|
2 baths 3 beds |
show details |
| Photo | Address | Area | Beds / Baths | Price | Details |
|---|---|---|---|---|---|

|
#21
River St
Rochester, NY 14612
|
1,260 sq. feet
|
1 baths 3 beds |
show details | |

|
#22
Mercury Dr
Rochester, NY 14624
|
1,400 sq. feet
|
1 baths 3 beds |
show details | |

|
#23
Buffalo Rd
Rochester, NY 14624
|
1,578 sq. feet
|
1 baths 3 beds |
show details | |

|
#24
Cabot Rd
Rochester, NY 14626
|
990 sq. feet
|
1 baths 3 beds |
show details | |

|
#25
Haddon Rd
Rochester, NY 14626
|
1,135 sq. feet
|
1 baths 2 beds |
show details | |

|
#26
Allegany Dr
Rochester, NY 14626
|
1,302 sq. feet
|
1 baths 3 beds |
show details | |

|
#27
Pinnacle Rd
Rush, NY 14543
|
2,798 sq. feet
|
3 baths 4 beds |
show details | |

|
#28
Barlow Dr
Rochester, NY 14626
|
1,823 sq. feet
|
1 baths 5 beds |
show details | |

|
#29
Durkar Ln
Rochester, NY 14616
|
974 sq. feet
|
1 baths 3 beds |
show details | |

|
#30
Wildwood Dr
Rochester, NY 14616
|
1,488 sq. feet
|
1 baths 3 beds |
show details |
| Photo | Address | Area | Beds / Baths | Price | Details |
|---|---|---|---|---|---|

|
#31
Straub Rd
Rochester, NY 14626
|
1,023 sq. feet
|
1 baths 3 beds |
show details | |

|
#32
Fielding Rd
Rochester, NY 14626
|
1,604 sq. feet
|
1 baths 4 beds |
show details | |

|
#33
Sweet Birch Ln
Rochester, NY 14615
|
1,776 sq. feet
|
2 baths 4 beds |
show details | |

|
#34
Lambert Dr
Rochester, NY 14616
|
1,060 sq. feet
|
2 baths 2 beds |
show details | |

|
#35
Armstrong Rd
Rochester, NY 14616
|
1,542 sq. feet
|
1 baths 3 beds |
show details | |

|
#36
Leonard Rd
Rochester, NY 14616
|
1,299 sq. feet
|
2 baths 2 beds |
show details | |

|
#37
Dearfield Ct
Fairport, NY 14450
|
1,347 sq. feet
|
2 baths 2 beds |
show details | |

|
#38
Medallion Cir
Rochester, NY 14626
|
1,364 sq. feet
|
1 baths 3 beds |
show details | |

|
#39
Berkshire Dr
Rochester, NY 14626
|
1,784 sq. feet
|
1 baths 3 beds |
show details | |

|
#40
Virginia Manor Rd
Rochester, NY 14606
|
1,568 sq. feet
|
1 baths 3 beds |
show details |
| Photo | Address | Area | Beds / Baths | Price | Details |
|---|---|---|---|---|---|

|
#41
Sierra Dr
Rochester, NY 14616
|
1,681 sq. feet
|
1 baths 4 beds |
show details | |

|
#42
Eileen Cir
Rochester, NY 14616
|
1,842 sq. feet
|
1 baths 4 beds |
show details | |

|
#43
Atlee Dr
Rochester, NY 14626
|
1,956 sq. feet
|
2 baths 3 beds |
show details | |

|
#44
Round Pond Ln
Rochester, NY 14626
|
2,016 sq. feet
|
2 baths 4 beds |
show details | |

|
#45
Ridgewood Rd
Rochester, NY 14626
|
1,984 sq. feet
|
1 baths 3 beds |
show details | |

|
#46
Wood Rd
Rochester, NY 14626
|
1,209 sq. feet
|
1 baths 4 beds |
show details | |

|
#47
Elm St
Webster, NY 14580
|
1,997 sq. feet
|
1 baths 4 beds |
show details | |

|
#48
Armstrong Rd
Rochester, NY 14612
|
1,032 sq. feet
|
1 baths 3 beds |
show details | |

|
#49
Barmont Dr
Rochester, NY 14626
|
1,272 sq. feet
|
1 baths 3 beds |
show details | |

|
Check over 1 million property listings on Foreclosure.com!
|
browse all offers | |||

Latest news about housing in Brighton, NY collected exclusively by city-data.com from local newspapers, TV, and radio stations


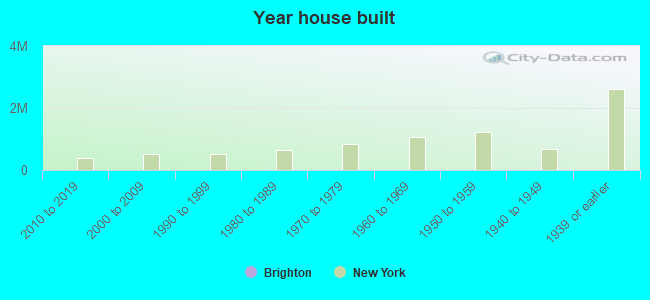
Median year apartment built: 1975
Household type by relationship:
Households: 36,606- Male householders: 7,728 (1,979 living alone), Female householders: 8,108 (3,778 living alone)
7,005 spouses (6,882 opposite-sex spouses), 1,347 unmarried partners, (1,307 opposite-sex unmarried partners), 8,313 children (7,775 natural, 215 adopted, 322 stepchildren), 159 grandchildren, 149 brothers or sisters, 236 parents, 11 foster children, 291 other relatives, 833 non-relatives
- In group quarters: 2,421
Size of family households: 4,171 2-persons, 1,714 3-persons, 1,757 4-persons, 698 5-persons, 75 6-persons, 17 7-or-more-persons.
Size of nonfamily households: 5,973 1-person, 1,689 2-persons, 113 3-persons, 6 5-persons.
5,142 married couples with children.
1,287 single-parent households (249 men, 1,038 women).
84.8% of residents of Brighton speak English at home.
2.0% of residents speak Spanish at home (85% speak English very well, 11% speak English well, 4% speak English not well).
5.5% of residents speak other Indo-European language at home (72% speak English very well, 18% speak English well, 5% speak English not well, 4% don't speak English at all).
5.5% of residents speak Asian or Pacific Island language at home (61% speak English very well, 29% speak English well, 10% speak English not well).
2.2% of residents speak other language at home (71% speak English very well, 20% speak English well, 9% speak English not well).
Foreign born population: 5,147 (14.1%)
(55.2% of them are naturalized citizens)
| Here: | 7.0 |
| State: | 6.3 |
| Here: | 3.8 |
| State: | 3.8 |
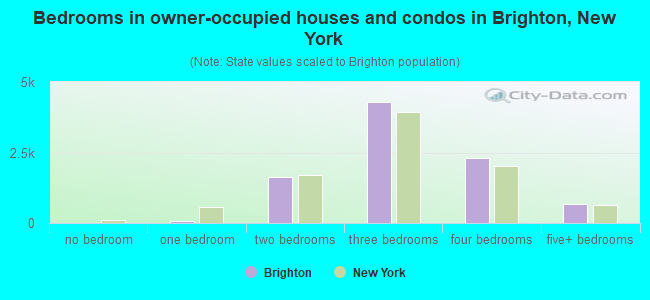
- Bedrooms in owner-occupied houses and condos in Brighton, New York
- 17no bedroom
- 661 bedroom
- 1,6472 bedrooms
- 4,2923 bedrooms
- 2,2964 bedrooms
- 6675+ bedrooms
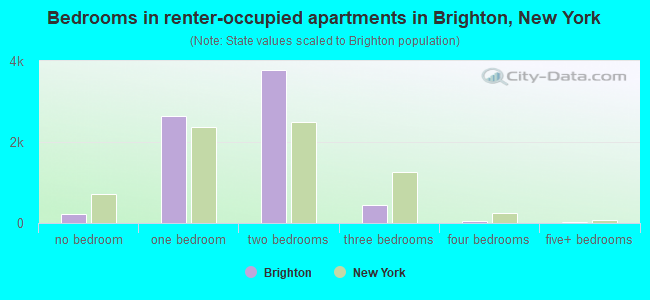
- Bedrooms in renter-occupied apartments in Brighton, New York
- 225no bedroom
- 2,6361 bedroom
- 3,7852 bedrooms
- 4563 bedrooms
- 554 bedrooms
- 215+ bedrooms
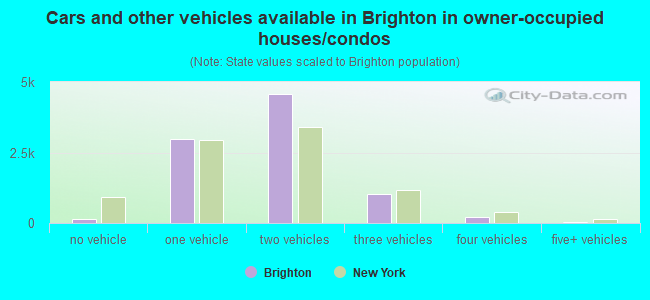
- Cars and other vehicles available in Brighton in owner-occupied houses/condos
- 146no vehicle
- 2,9611 vehicle
- 4,5802 vehicles
- 1,0273 vehicles
- 2264 vehicles
- 455+ vehicles
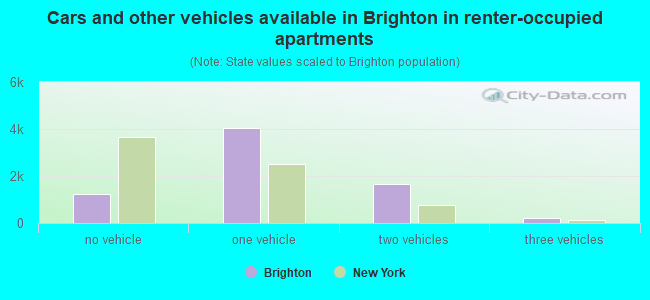
- Cars and other vehicles available in Brighton in renter-occupied apartments
- 1,235no vehicle
- 4,0351 vehicle
- 1,6752 vehicles
- 2163 vehicles
- 144 vehicles
- 25+ vehicles
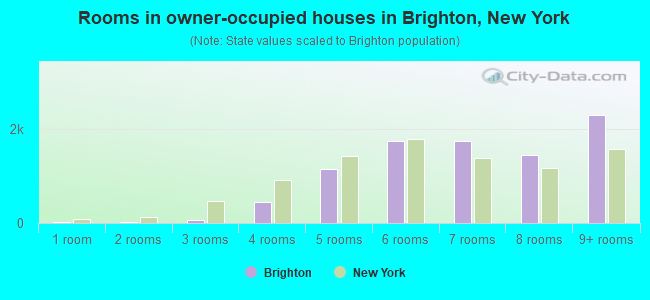
- Rooms in owner-occupied houses in Brighton, New York
- 171 room
- 182 rooms
- 683 rooms
- 4504 rooms
- 1,1505 rooms
- 1,7596 rooms
- 1,7557 rooms
- 1,4608 rooms
- 2,3079+ rooms
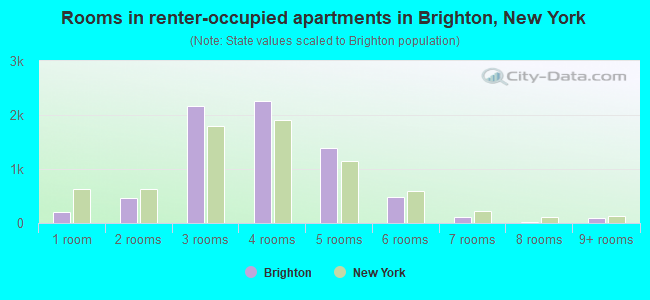
- Rooms in renter-occupied apartments in Brighton, New York
- 2101 room
- 4692 rooms
- 2,1623 rooms
- 2,2554 rooms
- 1,3905 rooms
- 4766 rooms
- 1037 rooms
- 278 rooms
- 859+ rooms
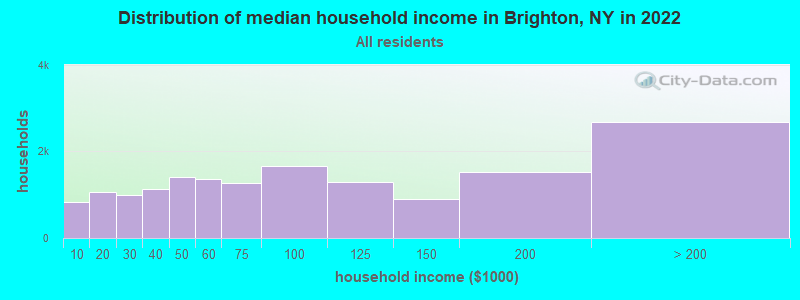
Brighton, NY household income distribution

- 828Less than $10,000
- 1,066$10,000 to $19,999
- 1,000$20,000 to $29,999
- 1,141$30,000 to $39,999
- 1,415$40,000 to $49,999
- 1,353$50,000 to $59,999
- 1,262$60,000 to $74,999
- 1,654$75,000 to $99,999
- 1,303$100,000 to $124,999
- 891$125,000 to $149,999
- 1,521$150,000 to $199,999
- 2,679$200,000 or more
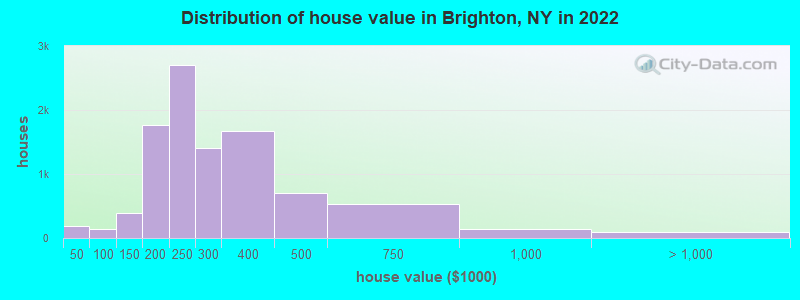
Home value of owner - occupied houses in 2022 in Brighton, NY
-
- 45Less than $10,000
- 25$20,000 to $24,999
- 67$25,000 to $29,999
- 22$35,000 to $39,999
- 27$40,000 to $49,999
- 16$60,000 to $69,999
- 10$70,000 to $79,999
- 24$80,000 to $89,999
- 67$90,000 to $99,999
- 73$100,000 to $124,999
- 322$125,000 to $149,999
- 693$150,000 to $174,999
- 1,067$175,000 to $199,999
- 2,703$200,000 to $249,999
- 1,398$250,000 to $299,999
- 1,672$300,000 to $399,999
- 706$400,000 to $499,999
- 525$500,000 to $749,999
- 137$750,000 to $999,999
- 67$1,000,000 to $1,499,999
- 22$2,000,000 or more
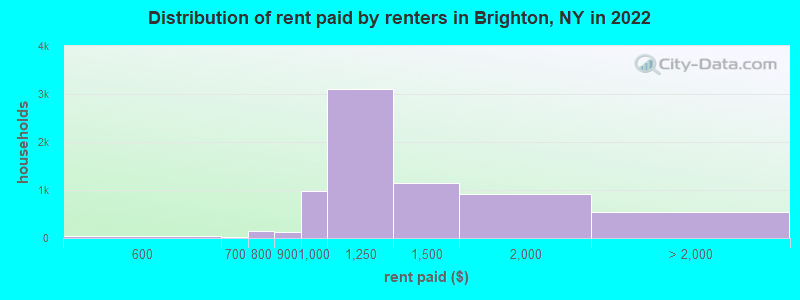
Rent paid by renters in 2022 in Brighton, NY
-
- 20$250 to $299
- 8$400 to $449
- 7$450 to $499
- 27$500 to $549
- 8$550 to $599
- 21$650 to $699
- 80$700 to $749
- 65$750 to $799
- 125$800 to $899
- 973$900 to $999
- 3,093$1,000 to $1,249
- 1,155$1,250 to $1,499
- 924$1,500 to $1,999
- 166$2,000 to $2,499
- 109$2,500 to $2,999
- 30$3,000 to $3,499
- 171$3,500 or more
- 63No cash rent
Percentage of workers working in this county: 94.2%
Number of people working at home: 4,353 (23.1% of all workers)
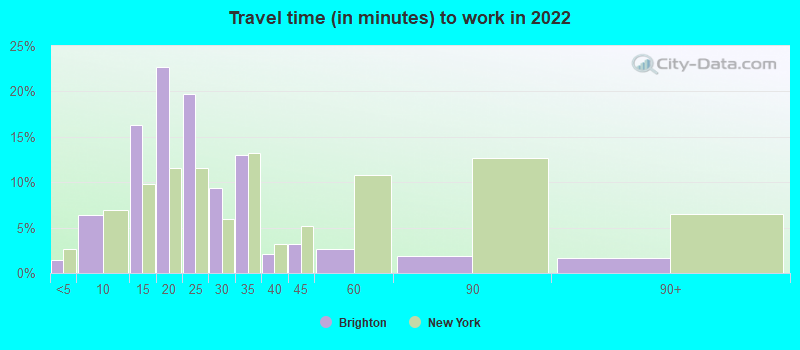
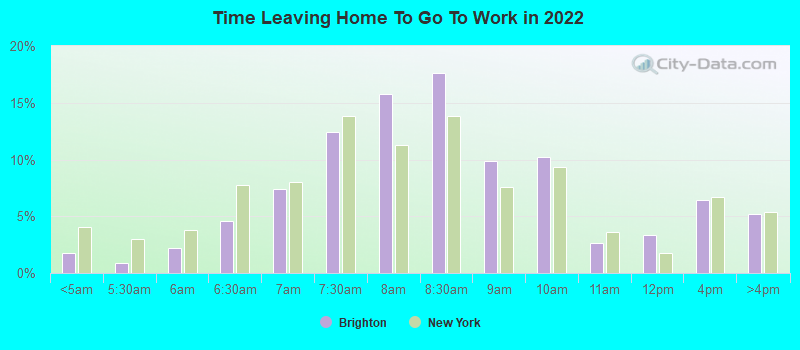
Travel time to work (commute)
- Less than 5 minutes: 215
- 5 to 9 minutes: 1,966
- 10 to 14 minutes: 4,482
- 15 to 19 minutes: 4,355
- 20 to 24 minutes: 2,174
- 25 to 29 minutes: 446
- 30 to 34 minutes: 637
- 35 to 39 minutes: 159
- 40 to 44 minutes: 95
- 45 to 59 minutes: 163
- 60 to 89 minutes: 191
- 90 or more minutes: 144
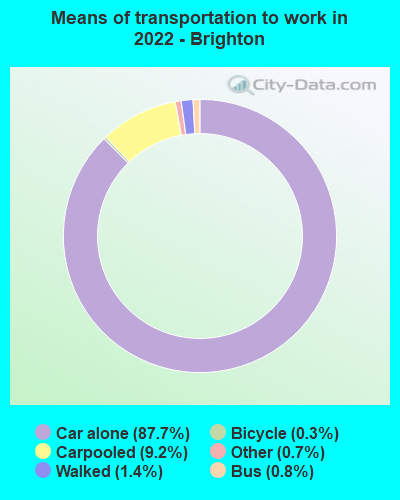
Means of transportation to work:
- Drove a car alone: 18,280 (73.7%)
- Carpooled: 1,724 (7.0%)
- Bus: 129 (0.5%)
- Taxi: 149 (0.6%)
- Bicycle: 54 (0.2%)
- Walked: 321 (1.3%)
- Worked at home: 4,353 (17.6%)
- Unemployment by race in 2022
- Unemployment rate for White non-Hispanic residents
- 3.1%Males
- 2.8%Females
- Unemployment rate for Black residents
- 13.0%Males
- 0.6%Females
- Unemployment rate for Asian residents
- 3.4%Males
- 3.4%Females
- Unemployment rate for two or more race residents
- 3.3%Males
- 3.6%Females
- Unemployment rate for Hispanic or Latino residents
- 9.0%Males
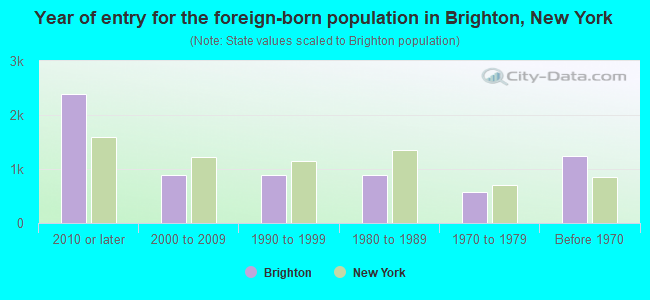
- Year of entry for the foreign-born population in Brighton, New York
- 2,3952010 or later
- 8872000 to 2009
- 8921990 to 1999
- 8921980 to 1989
- 5791970 to 1979
- 1,234Before 1970
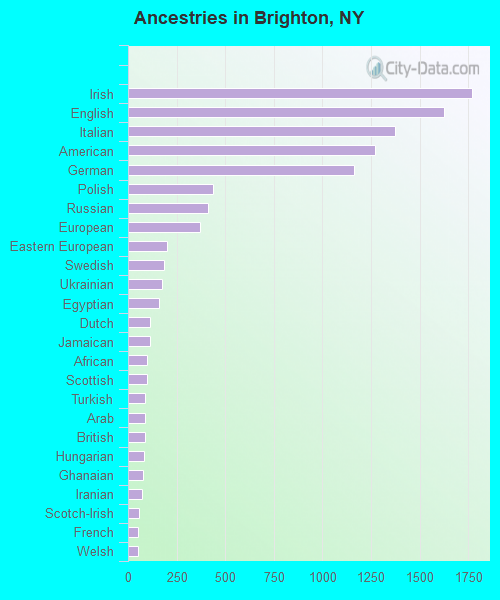
First ancestries reported:
- Irish: 1,769 (10.8%)
- English: 1,624 (9.9%)
- Italian: 1,373 (8.4%)
- American: 1,270 (7.8%)
- German: 1,164 (7.1%)
- Polish: 438 (2.7%)
- Russian: 414 (2.5%)
- European: 371 (2.3%)
- Eastern European: 201 (1.2%)
- Swedish: 183 (1.1%)
- Ukrainian: 174 (1.1%)
- Egyptian: 162 (1.0%)
- Dutch: 114 (0.7%)
- Jamaican: 114 (0.7%)
- African: 100 (0.6%)
- Scottish: 99 (0.6%)
- Turkish: 89 (0.5%)
- Arab: 88 (0.5%)
- British: 87 (0.5%)
- Hungarian: 80 (0.5%)
- Ghanaian: 77 (0.5%)
- Iranian: 74 (0.5%)
- Scotch-Irish: 59 (0.4%)
- French: 54 (0.3%)
- Welsh: 51 (0.3%)
- Scandinavian: 47 (0.3%)
- Albanian: 43 (0.3%)
- Israeli: 39 (0.2%)
- Afghan: 30 (0.2%)
- Lebanese: 29 (0.2%)
- Serbian: 29 (0.2%)
- Norwegian: 26 (0.2%)
- Greek: 25 (0.2%)
- Nigerian: 24 (0.1%)
- French Canadian: 23 (0.1%)
- Celtic: 21 (0.1%)
- Alsatian: 20 (0.1%)
- Danish: 19 (0.1%)
- Swiss: 16 (0.10%)
- Haitian: 14 (0.09%)
- Canadian: 12 (0.07%)
- Belgian: 12 (0.07%)
- Lithuanian: 11 (0.07%)
- Slovak: 7 (0.04%)
- Liberian: 5 (0.03%)
- Macedonian: 5 (0.03%)
- Czechoslovakian: 4 (0.02%)
- Czech: 4 (0.02%)
- Austrian: 3 (0.02%)
- Northern European: 3 (0.02%)
- Moroccan: 3 (0.02%)
- West Indian: 3 (0.02%)
Most common places of birth for foreign-born residents (%):
| Brighton: | 16.8% (957) |
| New York: | 3.5% (158,432) |
| Brighton: | 10.9% (621) |
| New York: | 9.1% (410,910) |
| Brighton: | 5.8% (331) |
| New York: | 1.8% (82,786) |
| Brighton: | 4.4% (250) |
| New York: | 0.4% (17,363) |
| Brighton: | 3.6% (206) |
| New York: | 1.7% (75,802) |
| Brighton: | 3.6% (204) |
| New York: | 1.3% (59,107) |
| Brighton: | 2.7% (151) |
| New York: | 0.2% (7,915) |
| Brighton: | 2.3% (133) |
| New York: | 0.2% (8,010) |
| Brighton: | 2.3% (132) |
| New York: | 0.5% (23,058) |
| Brighton: | 2.2% (127) |
| New York: | 0.1% (6,029) |
| Brighton: | 2.2% (123) |
| New York: | 0.7% (30,619) |
| Brighton: | 2.1% (122) |
| New York: | 0.1% (6,152) |
| Brighton: | 2.0% (114) |
| New York: | 1.4% (61,245) |
| Brighton: | 2.0% (113) |
| New York: | 0.0% (1,642) |
| Brighton: | 1.8% (104) |
| New York: | 0.0% (2,170) |
| Brighton: | 1.8% (104) |
| New York: | 0.7% (30,173) |
| Brighton: | 1.8% (101) |
| New York: | 0.6% (27,385) |
| Brighton: | 1.7% (94) |
| New York: | 0.4% (17,813) |
| Brighton: | 1.6% (90) |
| New York: | 0.5% (23,242) |
| Brighton: | 1.5% (87) |
| New York: | 0.7% (29,743) |
Place of birth for U.S.-born residents:
- This state: 22,742
- Other state: 7,514
- Northeast: 2,773
- Midwest: 1,703
- South: 1,991
- West: 1,053
81.1% of Brighton residents lived in the same house 1 years ago.
Out of people who lived in different houses, 36.5% lived in this county.
Out of people who lived in different counties, 64.1% lived in New York.
| Brighton: | 81.1% |
| State average: | 89.6% |
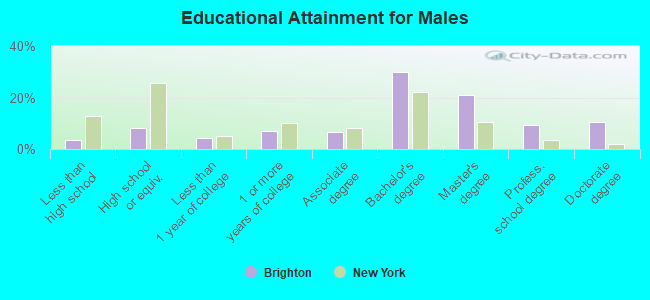
Education attainment for males 25 years and older:
- No schooling: 107
- Nursery to 4th grade: 3
- 5th and 6th grade: 10
- 7th and 8th grade: 34
- 9th grade: 22
- 10th grade: 78
- 11th grade: 62
- 12th grade, no diploma: 98
- High school graduate (or equivalency): 972
- Less than 1 year of college: 511
- Some college more than 1 year, no degree: 866
- Associate degree: 792
- Bachelor's degree: 3,614
- Master's degree: 2,570
- Professional school degree: 1,157
- Doctorate degree: 1,269
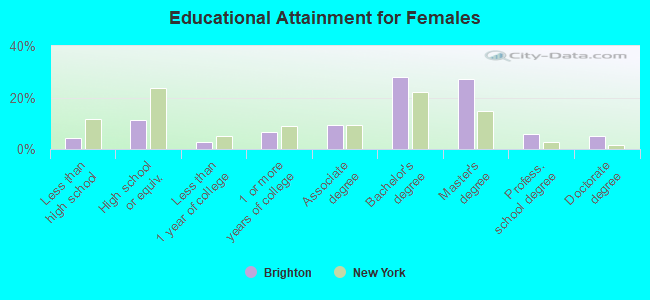
Education attainment for females 25 years and older:
- No schooling: 285
- Nursery to 4th grade: 15
- 5th and 6th grade: 13
- 7th and 8th grade: 52
- 9th grade: 23
- 10th grade: 21
- 11th grade: 69
- 12th grade, no diploma: 86
- High school graduate (or equivalency): 1,542
- Less than 1 year of college: 397
- Some college more than 1 year, no degree: 937
- Associate degree: 1,293
- Bachelor's degree: 3,870
- Master's degree: 3,731
- Professional school degree: 785
- Doctorate degree: 682
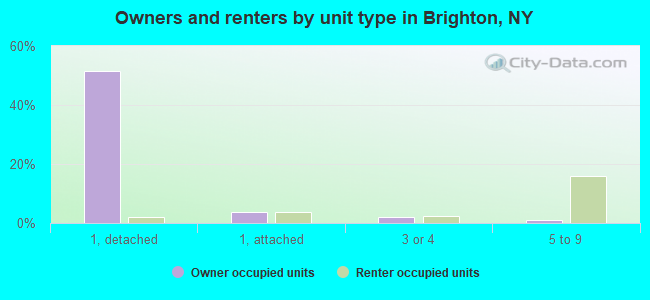
Housing units in structures:
- One, detached: 9,263
- One, attached: 1,174
- Two: 77
- 3 or 4: 684
- 5 to 9: 3,263
- 10 to 19: 879
- 20 to 49: 399
- 50 or more: 1,437
- Mobile homes: 11
Housing units lacking complete kitchen facilities in 2022: 0.6%
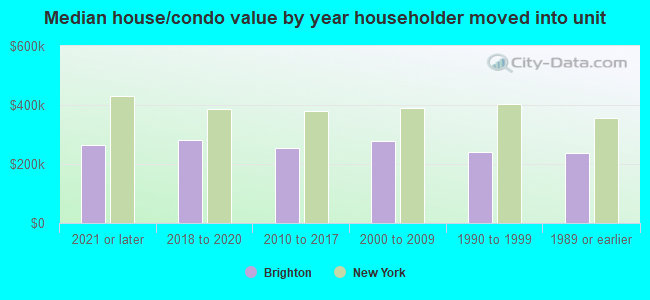
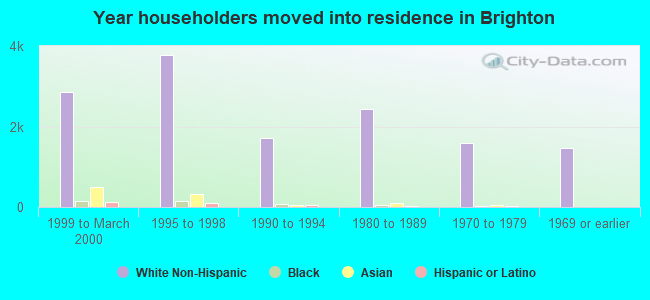
House/condo owner moved in on average 12 years ago
Renter moved in on average 2 years ago
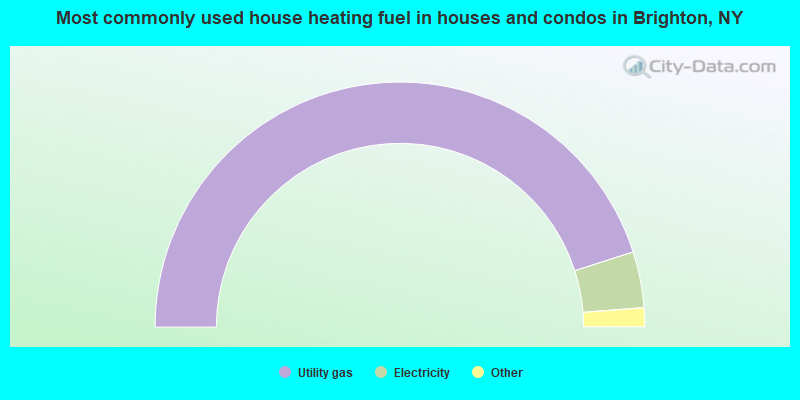
- 90.1%Utility gas
- 7.4%Electricity
- 1.3%Fuel oil, kerosene, etc.
- 0.9%Bottled, tank, or LP gas
- 0.2%Other fuel
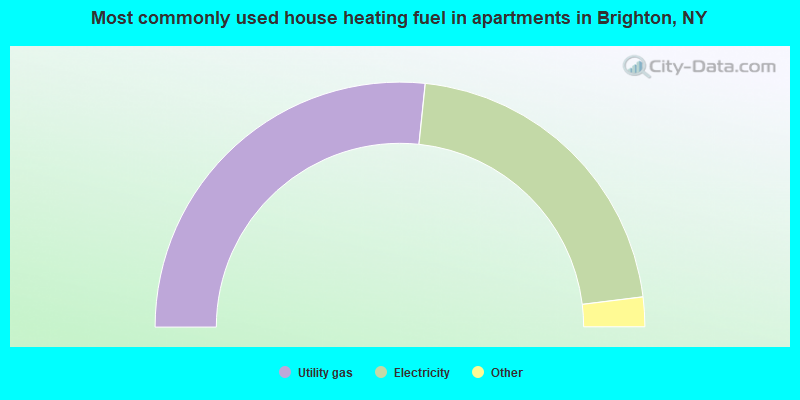
- 53.3%Utility gas
- 42.8%Electricity
- 1.8%Bottled, tank, or LP gas
- 1.0%Other fuel
- 0.6%Fuel oil, kerosene, etc.
- 0.6%No fuel used
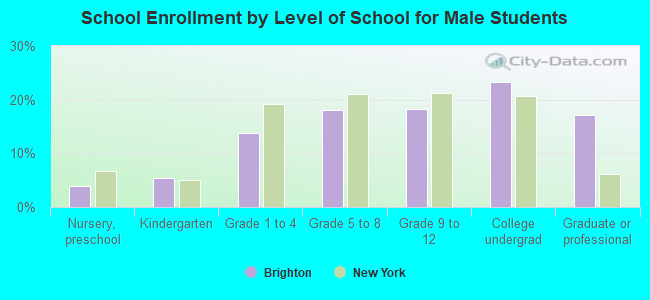
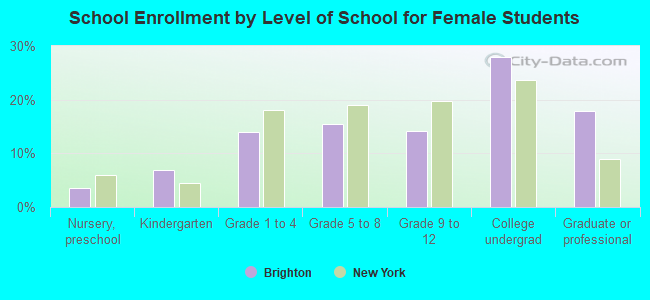
Private vs. public school enrollment:
| Here: | 7.1% |
| New York: | 15.6% |
| Here: | 9.8% |
| New York: | 15.0% |
| Here: | 36.3% |
| New York: | 39.2% |