Broadview Heights, OH (Ohio) Houses and Residents
| Broadview Heights: | $307,389 |
| Ohio: | $204,100 |
Mean price in 2022:
Detached houses: $393,436
Here: $393,436 State: $254,366 Townhouses or other attached units: $298,730
Here: $298,730 State: $225,733 In 3-to-4-unit structures: $157,974
Here: $157,974 State: $203,002 In 5-or-more-unit structures: $123,510
Here: $123,510 State: $211,593
Total population: 19,254 (Urban population: 15,842, Rural population: 125 (all nonfarm))
Houses: 8,714 (8,385 occupied: 7,019 owner occupied, 1,415 renter occupied)
| % of renters here: | 17% |
| State: | 33% |
Housing density: 667 houses/condos per square mile
Median price asked for vacant for-sale houses and condos in 2022: $308,831.
Median contract rent in 2022: $915 (lower quartile is $818, upper quartile is $1,024)
Median rent asked for vacant for-rent units in 2022: $1,112
Median gross rent in Broadview Heights, OH in 2022: $1,064
Housing units in Broadview Heights with a mortgage: 4,549 (577 second mortgage, 0 home equity loan, 521 both second mortgage and home equity loan)
Houses without a mortgage: 203
Median household income for houses/condos with a mortgage: $125,580
Median household income for apartments without a mortgage: $82,917
Median monthly housing costs: $1,380
Compare current foreclosures near Broadview Heights, OH:
| Photo | Address | Area | Beds / Baths | Price | Details |
|---|---|---|---|---|---|

|
#1
E Wallings Rd
Broadview Heights, OH 44147
|
1,908 sq. feet
|
2 baths 3 beds |
show details | |

|
#2
S Yorkshire Dr
Broadview Heights, OH 44147
|
1,514 sq. feet
|
2 baths 2 beds |
show details | |

|
#3
Tollis Pkwy Apt 175e
Broadview Heights, OH 44147
|
920 sq. feet
|
1 baths 2 beds |
show details | |

|
#4
Chaucer Blvd
Broadview Heights, OH 44147
|
3,467 sq. feet
|
2 baths 4 beds |
show details | |

|
#5
Broadview Rd
Broadview Heights, OH 44147
|
1,288 sq. feet
|
1 baths 3 beds |
show details | |

|
#6
W Mill Rd
Broadview Heights, OH 44147
|
1,524 sq. feet
|
1 baths 2 beds |
show details | |

|
#7
Wilmington Dr
Broadview Heights, OH 44147
|
2,450 sq. feet
|
2 baths 4 beds |
show details | |

|
#8
Stoney Run Trl
Broadview Heights, OH 44147
|
717 sq. feet
|
1 baths 1 beds |
show details | |

|
#9
Summit Blvd
Broadview Heights, OH 44147
|
- sq. feet
|
- baths - beds |
show details | |

|
#10
Tanhollow Trl
Broadview Heights, OH 44147
|
- sq. feet
|
- baths - beds |
show details |
| Photo | Address | Area | Beds / Baths | Price | Details |
|---|---|---|---|---|---|

|
#11
Scenicview Dr Apt 203
Broadview Heights, OH 44147
|
- sq. feet
|
- baths - beds |
show details | |

|
#12
Summit Blvd
Broadview Heights, OH 44147
|
- sq. feet
|
- baths - beds |
show details | |

|
#13
E 147th St
Cleveland, OH 44120
|
2,360 sq. feet
|
3 baths 5 beds |
$22,500
|
show details |

|
#14
E 128th St
Cleveland, OH 44120
|
2,590 sq. feet
|
3 baths 5 beds |
$22,500
|
show details |

|
#15
E 128th St
Cleveland, OH 44120
|
1,894 sq. feet
|
1 baths 4 beds |
$44,900
|
show details |

|
#16
Greenfield Ct
Berea, OH 44017
|
840 sq. feet
|
1 baths 2 beds |
$144,500
|
show details |

|
#17
Ashland Dr
Brook Park, OH 44142
|
888 sq. feet
|
1 baths 3 beds |
$214,500
|
show details |

|
#18
Westgrove Ct
Medina, OH 44256
|
1,688 sq. feet
|
2 baths 3 beds |
$274,900
|
show details |

|
#19
Hale Dr
Streetsboro, OH 44241
|
1,874 sq. feet
|
2 baths 3 beds |
$314,500
|
show details |

|
#20
E 134th St
Cleveland, OH 44105
|
1,549 sq. feet
|
1 baths 3 beds |
$129,900
|
show details |
| Photo | Address | Area | Beds / Baths | Price | Details |
|---|---|---|---|---|---|

|
#21
Wilmington Rd
Cleveland, OH 44121
|
1,278 sq. feet
|
1 baths 3 beds |
$134,900
|
show details |

|
#22
E 97th St
Cleveland, OH 44105
|
- sq. feet
|
1 baths 5 beds |
$62,400
|
show details |

|
#23
Maryland Ave
Cleveland, OH 44105
|
1,908 sq. feet
|
2 baths 4 beds |
$29,900
|
show details |

|
#24
Van Aken Blvd Apt 207
Beachwood, OH 44122
|
798 sq. feet
|
1 baths 2 beds |
show details | |

|
#25
Daleford Rd
Cleveland, OH 44120
|
3,164 sq. feet
|
3 baths 6 beds |
show details | |

|
#26
Tampa Ave
Cleveland, OH 44109
|
1,155 sq. feet
|
2 baths 3 beds |
show details | |

|
#27
E 137th St
Cleveland, OH 44120
|
1,851 sq. feet
|
1 baths 4 beds |
show details | |

|
#28
Keyes Ave
Cleveland, OH 44104
|
1,253 sq. feet
|
2 baths 4 beds |
show details | |

|
#29
Mapleboro Ave
Maple Heights, OH 44137
|
1,041 sq. feet
|
1 baths 2 beds |
show details | |

|
#30
E Aurora Rd
Macedonia, OH 44056
|
1,532 sq. feet
|
1 baths 2 beds |
show details |
| Photo | Address | Area | Beds / Baths | Price | Details |
|---|---|---|---|---|---|

|
#31
Biltmore Ave
Cleveland, OH 44128
|
1,151 sq. feet
|
1 baths 3 beds |
show details | |

|
#32
Oxford Dr
Cleveland, OH 44129
|
1,562 sq. feet
|
1 baths 3 beds |
show details | |

|
#33
Dove Ave
Cleveland, OH 44105
|
1,455 sq. feet
|
2 baths 3 beds |
show details | |

|
#34
E 146th St
Cleveland, OH 44110
|
1,091 sq. feet
|
1 baths 3 beds |
show details | |

|
#35
Whitethorn Rd
Cleveland, OH 44118
|
1,500 sq. feet
|
1 baths 3 beds |
show details | |

|
#36
Reed Rd
Grafton, OH 44044
|
1,508 sq. feet
|
2 baths 3 beds |
show details | |

|
#37
W 145th St
Cleveland, OH 44135
|
1,232 sq. feet
|
1 baths 3 beds |
show details | |

|
#38
Kennerdown Ave
Maple Heights, OH 44137
|
1,188 sq. feet
|
1 baths 3 beds |
show details | |

|
#39
Mountville Dr
Maple Heights, OH 44137
|
1,175 sq. feet
|
2 baths 3 beds |
show details | |

|
#40
Blue Heron Dr
Solon, OH 44139
|
2,372 sq. feet
|
3 baths 4 beds |
show details |
| Photo | Address | Area | Beds / Baths | Price | Details |
|---|---|---|---|---|---|

|
#41
Huntsford Dr
Macedonia, OH 44056
|
1,566 sq. feet
|
2 baths 3 beds |
show details | |

|
#42
Woodbridge Ave
Cleveland, OH 44109
|
1,364 sq. feet
|
1 baths 3 beds |
show details | |

|
#43
Forest Glen Dr
North Royalton, OH 44133
|
3,464 sq. feet
|
3 baths 4 beds |
show details | |

|
#44
Palmetto Ave
Bedford, OH 44146
|
1,068 sq. feet
|
1 baths 3 beds |
show details | |

|
#45
Thornwood Ave
Cleveland, OH 44108
|
1,228 sq. feet
|
1 baths 3 beds |
show details | |

|
#46
Forest Ave
Cleveland, OH 44129
|
1,626 sq. feet
|
1 baths 4 beds |
show details | |

|
#47
Akron St
Chagrin Falls, OH 44023
|
1,228 sq. feet
|
1 baths 3 beds |
show details | |

|
#48
W 135th St
Cleveland, OH 44111
|
1,645 sq. feet
|
2 baths 3 beds |
show details | |

|
#49
S Noble Rd
Cleveland, OH 44121
|
1,020 sq. feet
|
1 baths 3 beds |
show details | |

|
Check over 1 million property listings on Foreclosure.com!
|
browse all offers | |||


 | Home daycares around Broadview Heights (0 replies) |
| Cleveland Development Discussions (4357 replies) |
| Visiting Cleveland: a couple of questions (38 replies) |
| where are the liberal, family friendly suburbs? (83 replies) |
| Thinking of Ohio as option to move from NY (16 replies) |
| Houses for rent near Independence (3 replies) |

Median year apartment built: 1976
Household type by relationship:
Households: 19,490- Male householders: 3,797 (979 living alone), Female householders: 4,460 (1,434 living alone)
4,428 spouses (4,311 opposite-sex spouses), 527 unmarried partners, (527 opposite-sex unmarried partners), 5,437 children (5,291 natural, 85 adopted, 60 stepchildren), 187 grandchildren, 36 brothers or sisters, 209 parents, 0 foster children, 22 other relatives, 236 non-relatives
- In group quarters: 146
Size of family households: 2,771 2-persons, 1,271 3-persons, 1,028 4-persons, 300 5-persons, 102 6-persons, 61 7-or-more-persons.
Size of nonfamily households: 2,431 1-person, 404 2-persons, 91 3-persons, 3 4-persons.
2,925 married couples with children.
936 single-parent households (265 men, 671 women).
89.3% of residents of Broadview Heights speak English at home.
1.0% of residents speak Spanish at home (70% speak English very well, 30% speak English well).
6.9% of residents speak other Indo-European language at home (73% speak English very well, 17% speak English well, 8% speak English not well, 2% don't speak English at all).
2.5% of residents speak Asian or Pacific Island language at home (78% speak English very well, 12% speak English well, 4% speak English not well, 7% don't speak English at all).
0.7% of residents speak other language at home (100% speak English very well).
Foreign born population: 1,898 (9.7%)
(85.7% of them are naturalized citizens)
| Here: | 7.4 |
| State: | 6.7 |
| Here: | 4.0 |
| State: | 4.4 |

- Bedrooms in owner-occupied houses and condos in Broadview Heights, Ohio
- 0no bedroom
- 601 bedroom
- 1,2982 bedrooms
- 2,7723 bedrooms
- 2,4764 bedrooms
- 4135+ bedrooms

- Bedrooms in renter-occupied apartments in Broadview Heights, Ohio
- 8no bedroom
- 2621 bedroom
- 9512 bedrooms
- 1703 bedrooms
- 244 bedrooms
- 05+ bedrooms

- Cars and other vehicles available in Broadview Heights in owner-occupied houses/condos
- 86no vehicle
- 1,8821 vehicle
- 3,5232 vehicles
- 1,0683 vehicles
- 3514 vehicles
- 1105+ vehicles

- Cars and other vehicles available in Broadview Heights in renter-occupied apartments
- 207no vehicle
- 6841 vehicle
- 4332 vehicles
- 913 vehicles
- 04 vehicles
- 05+ vehicles

- Rooms in owner-occupied houses in Broadview Heights, Ohio
- 01 room
- 02 rooms
- 663 rooms
- 4744 rooms
- 1,0355 rooms
- 8856 rooms
- 1,2217 rooms
- 1,1938 rooms
- 2,1469+ rooms

- Rooms in renter-occupied apartments in Broadview Heights, Ohio
- 81 room
- 02 rooms
- 1373 rooms
- 9184 rooms
- 1835 rooms
- 1006 rooms
- 457 rooms
- 08 rooms
- 249+ rooms


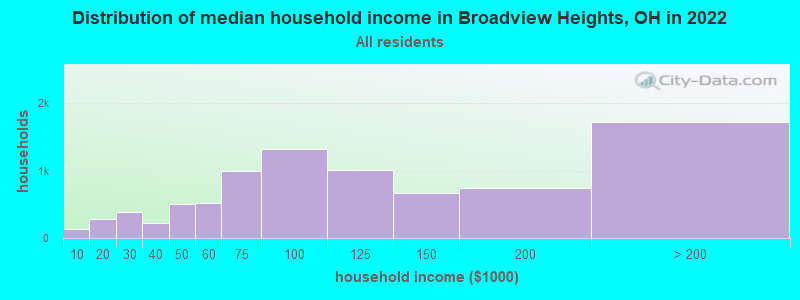
Broadview Heights, OH household income distribution

- 134Less than $10,000
- 280$10,000 to $19,999
- 389$20,000 to $29,999
- 228$30,000 to $39,999
- 511$40,000 to $49,999
- 515$50,000 to $59,999
- 989$60,000 to $74,999
- 1,312$75,000 to $99,999
- 1,009$100,000 to $124,999
- 672$125,000 to $149,999
- 737$150,000 to $199,999
- 1,719$200,000 or more
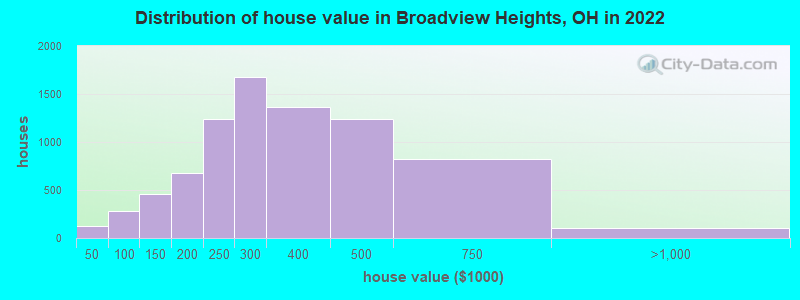
Home value of owner - occupied houses in 2022 in Broadview Heights, OH
-
- 35Less than $10,000
- 19$15,000 to $19,999
- 8$20,000 to $24,999
- 7$25,000 to $29,999
- 15$30,000 to $34,999
- 39$40,000 to $49,999
- 10$50,000 to $59,999
- 92$60,000 to $69,999
- 68$70,000 to $79,999
- 19$80,000 to $89,999
- 54$90,000 to $99,999
- 256$100,000 to $124,999
- 201$125,000 to $149,999
- 160$150,000 to $174,999
- 519$175,000 to $199,999
- 1,235$200,000 to $249,999
- 1,678$250,000 to $299,999
- 1,369$300,000 to $399,999
- 1,236$400,000 to $499,999
- 826$500,000 to $749,999
- 91$750,000 to $999,999
- 11$1,000,000 to $1,499,999
Rent paid by renters in 2022 in Broadview Heights, OH
-
- 36$500 to $549
- 116$650 to $699
- 53$700 to $749
- 156$750 to $799
- 259$800 to $899
- 410$900 to $999
- 144$1,000 to $1,249
- 89$1,250 to $1,499
- 41$1,500 to $1,999
- 40No cash rent


Percentage of workers working in this county: 86.1%
Number of people working at home: 2,178 (21.0% of all workers)
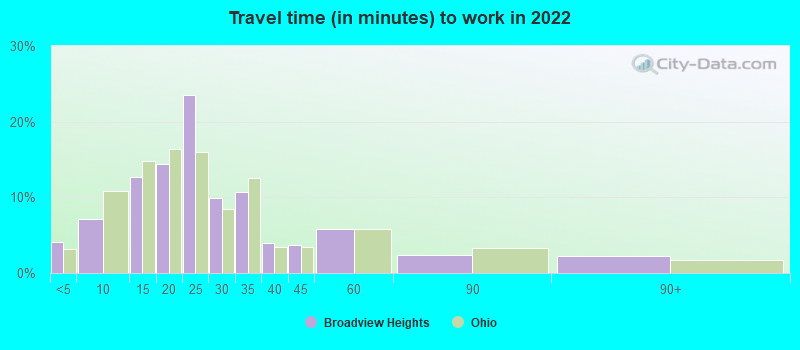
Travel time to work (commute)
- Less than 5 minutes: 220
- 5 to 9 minutes: 619
- 10 to 14 minutes: 872
- 15 to 19 minutes: 998
- 20 to 24 minutes: 1,157
- 25 to 29 minutes: 645
- 30 to 34 minutes: 1,603
- 35 to 39 minutes: 364
- 40 to 44 minutes: 738
- 45 to 59 minutes: 599
- 60 to 89 minutes: 159
- 90 or more minutes: 134
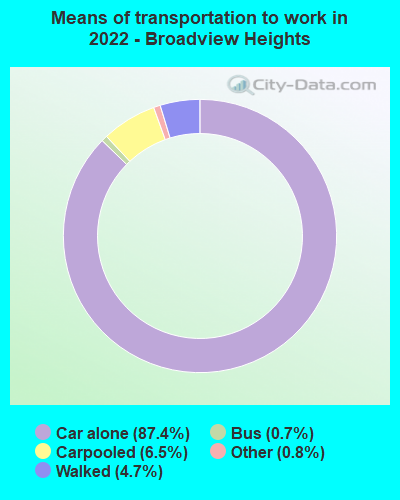
Means of transportation to work:
- Drove a car alone: 3,828 (62.4%)
- Carpooled: 285 (4.6%)
- Bus: 25 (0.4%)
- Taxi: 35 (0.6%)
- Walked: 243 (4.0%)
- Worked at home: 2,178 (35.5%)

- Unemployment by race in 2022
- Unemployment rate for White non-Hispanic residents
- 0.4%Males
- 1.5%Females
- Unemployment rate for Asian residents
- 3.4%Females

- Year of entry for the foreign-born population in Broadview Heights, Ohio
- 1372010 or later
- 2812000 to 2009
- 6231990 to 1999
- 2011980 to 1989
- 1941970 to 1979
- 596Before 1970

First ancestries reported:
- Italian: 947 (12.1%)
- American: 898 (11.4%)
- Polish: 711 (9.1%)
- German: 703 (9.0%)
- Serbian: 379 (4.8%)
- Irish: 379 (4.8%)
- Ukrainian: 322 (4.1%)
- English: 201 (2.6%)
- Slovak: 194 (2.5%)
- European: 165 (2.1%)
- Hungarian: 151 (1.9%)
- Scottish: 119 (1.5%)
- Macedonian: 94 (1.2%)
- Bulgarian: 91 (1.2%)
- Slovene: 89 (1.1%)
- Egyptian: 79 (1.0%)
- Welsh: 75 (1.0%)
- Lebanese: 74 (0.9%)
- Eastern European: 66 (0.8%)
- Czech: 60 (0.8%)
- Swedish: 37 (0.5%)
- Jamaican: 31 (0.4%)
- French Canadian: 30 (0.4%)
- Greek: 28 (0.4%)
- Russian: 22 (0.3%)
- Lithuanian: 20 (0.3%)
- Norwegian: 20 (0.3%)
- French: 19 (0.2%)
- Czechoslovakian: 17 (0.2%)
- Scotch-Irish: 16 (0.2%)
- Belgian: 15 (0.2%)
- Austrian: 14 (0.2%)
- Latvian: 12 (0.2%)
- Arab: 6 (0.08%)
- Slavic: 6 (0.08%)
Most common places of birth for foreign-born residents (%):
| Broadview Heights: | 17.6% (347) |
| Ohio: | 11.6% (66,525) |
| Broadview Heights: | 8.7% (171) |
| Ohio: | 0.3% (1,875) |
| Broadview Heights: | 7.6% (149) |
| Ohio: | 0.6% (3,269) |
| Broadview Heights: | 6.0% (119) |
| Ohio: | 3.1% (17,818) |
| Broadview Heights: | 5.7% (112) |
| Ohio: | 1.2% (6,679) |
| Broadview Heights: | 4.3% (84) |
| Ohio: | 1.7% (9,564) |
| Broadview Heights: | 3.9% (77) |
| Ohio: | 2.0% (11,398) |
| Broadview Heights: | 3.6% (70) |
| Ohio: | 0.3% (1,568) |
| Broadview Heights: | 3.3% (64) |
| Ohio: | 2.2% (12,846) |
| Broadview Heights: | 3.0% (60) |
| Ohio: | 0.8% (4,651) |
| Broadview Heights: | 2.7% (54) |
| Ohio: | 0.7% (4,187) |
| Broadview Heights: | 2.6% (52) |
| Ohio: | 0.2% (1,210) |
| Broadview Heights: | 2.6% (52) |
| Ohio: | 6.2% (35,703) |
| Broadview Heights: | 2.3% (45) |
| Ohio: | 0.2% (1,179) |
| Broadview Heights: | 1.8% (36) |
| Ohio: | 0.2% (1,320) |
| Broadview Heights: | 1.7% (34) |
| Ohio: | 0.7% (3,862) |
Place of birth for U.S.-born residents:
- This state: 14,989
- Other state: 2,397
- Northeast: 989
- Midwest: 771
- South: 400
- West: 262
88.8% of Broadview Heights residents lived in the same house 1 years ago.
Out of people who lived in different houses, 33.3% lived in this county.
Out of people who lived in different counties, 69.0% lived in Ohio.
| Broadview Heights: | 88.8% |
| State average: | 87.8% |
Education attainment for males 25 years and older:
- No schooling: 66
- Nursery to 4th grade: 13
- 5th and 6th grade: 10
- 7th and 8th grade: 18
- 9th grade: 0
- 10th grade: 11
- 11th grade: 20
- 12th grade, no diploma: 30
- High school graduate (or equivalency): 1,030
- Less than 1 year of college: 568
- Some college more than 1 year, no degree: 591
- Associate degree: 474
- Bachelor's degree: 2,380
- Master's degree: 935
- Professional school degree: 448
- Doctorate degree: 102

Education attainment for females 25 years and older:
- No schooling: 99
- Nursery to 4th grade: 17
- 5th and 6th grade: 13
- 7th and 8th grade: 13
- 9th grade: 21
- 10th grade: 6
- 11th grade: 14
- 12th grade, no diploma: 12
- High school graduate (or equivalency): 1,280
- Less than 1 year of college: 516
- Some college more than 1 year, no degree: 932
- Associate degree: 463
- Bachelor's degree: 2,558
- Master's degree: 1,354
- Professional school degree: 206
- Doctorate degree: 149


Housing units in structures:
- One, detached: 5,976
- One, attached: 656
- Two: 21
- 3 or 4: 162
- 5 to 9: 397
- 10 to 19: 974
- 20 to 49: 206
- 50 or more: 307
- Boats, RVs, vans, etc.: 9
Housing units lacking complete kitchen facilities in 2022: 0.9%
House/condo owner moved in on average 11 years ago
Renter moved in on average 1 years ago

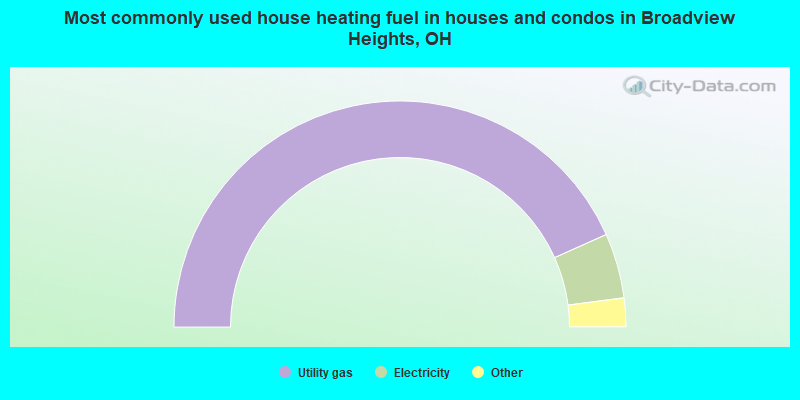
- 86.6%Utility gas
- 9.3%Electricity
- 1.7%Other fuel
- 1.1%Bottled, tank, or LP gas
- 0.7%Wood
- 0.4%Fuel oil, kerosene, etc.
- 0.1%No fuel used
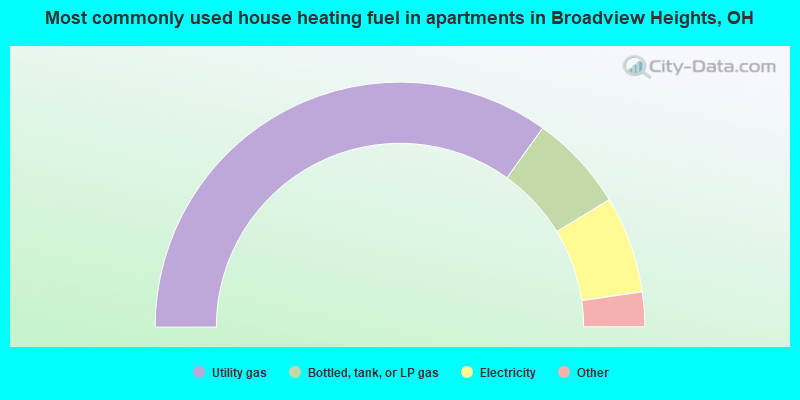
- 69.9%Utility gas
- 12.8%Bottled, tank, or LP gas
- 12.8%Electricity
- 3.3%Other fuel
- 1.2%No fuel used
Private vs. public school enrollment:
| Here: | 25.0% |
| Ohio: | 16.0% |
| Here: | 7.2% |
| Ohio: | 13.1% |
| Here: | 34.3% |
| Ohio: | 22.3% |


