Burlington, KY (Kentucky) Houses and Residents
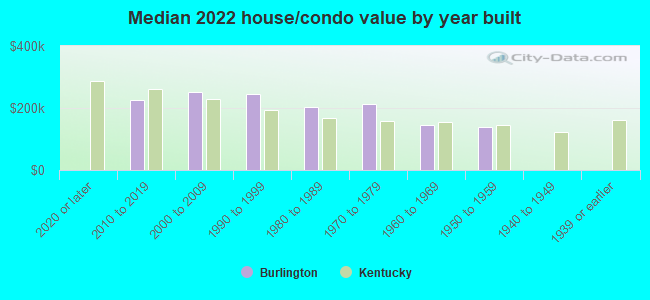
| Burlington: | $242,497 |
| Kentucky: | $196,300 |
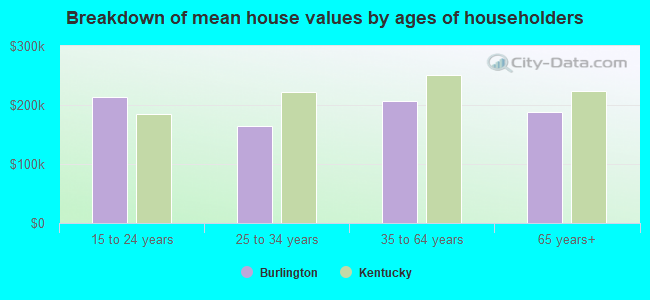
Mean price in 2022:
Detached houses: $258,044
Here: $258,044 State: $256,452 Townhouses or other attached units: $229,095
Here: $229,095 State: $264,090 In 3-to-4-unit structures: $141,981
Here: $141,981 State: $169,074 In 5-or-more-unit structures: $261,041
Here: $261,041 State: $245,174
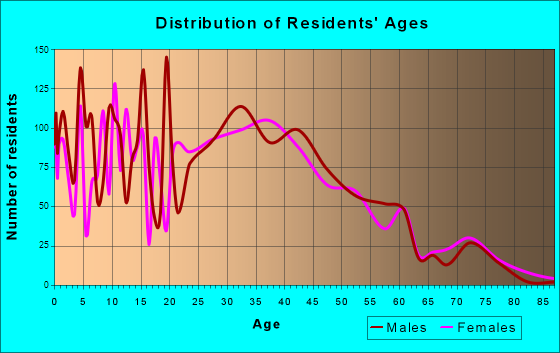
Total population: 15,926 (Urban population: 10,248, Rural population: 410 (all nonfarm))
Houses: 7,062 (6,738 occupied: 5,381 owner occupied, 1,468 renter occupied)
| % of renters here: | 21% |
| State: | 31% |
Housing density: 836 houses/condos per square mile
Median price asked for vacant for-sale houses and condos in 2022: $129,296.
Median contract rent in 2022: $1,216 (lower quartile is $964, upper quartile is $1,575)
Median rent asked for vacant for-rent units in 2022: $1,421
Median gross rent in Burlington, KY in 2022: $1,389
Housing units in Burlington with a mortgage: 4,338 (763 second mortgage, 11 home equity loan, 660 both second mortgage and home equity loan)
Houses without a mortgage: 24
Median household income for houses/condos with a mortgage: $117,701
Median household income for apartments without a mortgage: $58,655
Median monthly housing costs: $1,349
Compare current foreclosures in Burlington, KY:
| Photo | Address | Area | Beds / Baths | Price | Details |
|---|---|---|---|---|---|

|
#1
Coachlight Ln
Burlington, KY 41005
|
1,708 sq. feet
|
2 baths 3 beds |
show details | |

|
#2
Coachlight Ln
Burlington, KY 41005
|
1,826 sq. feet
|
2 baths 3 beds |
show details | |

|
#3
Birchwood Ct
Burlington, KY 41005
|
1,508 sq. feet
|
1 baths 3 beds |
show details | |

|
#4
Piney Creek Cir
Burlington, KY 41005
|
2,160 sq. feet
|
3 baths 4 beds |
show details | |

|
#5
Mary Teal Ln
Burlington, KY 41005
|
1,924 sq. feet
|
2 baths 3 beds |
show details | |

|
#6
E Bend Rd
Burlington, KY 41005
|
864 sq. feet
|
2 baths 3 beds |
show details | |

|
#7
Wolf Creek Way
Burlington, KY 41005
|
1,960 sq. feet
|
2 baths 4 beds |
show details | |

|
#8
Coachlight Ln
Burlington, KY 41005
|
1,737 sq. feet
|
2 baths 3 beds |
show details | |

|
#9
Cottontail Trl
Burlington, KY 41005
|
1,840 sq. feet
|
3 baths 3 beds |
show details | |

|
#10
Bluegrama Dr
Burlington, KY 41005
|
1,836 sq. feet
|
2 baths 3 beds |
show details |
| Photo | Address | Area | Beds / Baths | Price | Details |
|---|---|---|---|---|---|

|
#11
Red Oak Dr
Burlington, KY 41005
|
1,684 sq. feet
|
2 baths 4 beds |
show details | |

|
#12
Samantha Dr
Burlington, KY 41005
|
1,740 sq. feet
|
2 baths 4 beds |
show details | |

|
#13
Summertime Ln
Burlington, KY 41005
|
1,692 sq. feet
|
2 baths 3 beds |
show details | |

|
#14
Deer Run Dr
Burlington, KY 41005
|
1,728 sq. feet
|
2 baths 4 beds |
show details | |

|
#15
Hidden Springs Ct
Burlington, KY 41005
|
1,872 sq. feet
|
1 baths 3 beds |
show details | |

|
#16
Coachlight Ln
Burlington, KY 41005
|
1,610 sq. feet
|
2 baths 3 beds |
show details | |

|
#17
Heathersfield Dr
Burlington, KY 41005
|
- sq. feet
|
2 baths 3 beds |
show details | |

|
#18
Graham Ct
Burlington, KY 41005
|
- sq. feet
|
- baths - beds |
show details | |

|
#19
Tanglewood Ct Apt 5
Burlington, KY 41005
|
- sq. feet
|
- baths - beds |
show details | |

|
#20
Northern Dancer Ct
Burlington, KY 41005
|
1,536 sq. feet
|
- baths - beds |
show details |
| Photo | Address | Area | Beds / Baths | Price | Details |
|---|---|---|---|---|---|

|
#21
Cannondale Dr
Burlington, KY 41005
|
- sq. feet
|
- baths - beds |
show details | |

|
#22
Nelson Ln
Burlington, KY 41005
|
- sq. feet
|
- baths - beds |
show details | |

|
#23
Whippoorwill Ct Apt 59
Burlington, KY 41005
|
- sq. feet
|
- baths - beds |
show details | |

|
#24
Taylor Dr Apt 63
Burlington, KY 41005
|
- sq. feet
|
- baths - beds |
show details | |

|
#25
Sandbur Ct
Burlington, KY 41005
|
- sq. feet
|
- baths - beds |
show details | |

|
#26
Bordeaux Blvd Apt H
Burlington, KY 41005
|
- sq. feet
|
- baths - beds |
show details | |

|
#27
Tanglewood Ct Apt 8
Burlington, KY 41005
|
- sq. feet
|
- baths - beds |
show details | |

|
#28
Camp Ernst Rd
Burlington, KY 41005
|
- sq. feet
|
- baths - beds |
show details | |

|
#29
Peel Rd
Burlington, KY 41005
|
- sq. feet
|
- baths - beds |
show details | |

|
#30
Wolf Creek Way
Burlington, KY 41005
|
- sq. feet
|
- baths - beds |
show details |
| Photo | Address | Area | Beds / Baths | Price | Details |
|---|---|---|---|---|---|

|
#31
Rocky Fork Rd Apt 78
Burlington, KY 41005
|
- sq. feet
|
- baths - beds |
show details | |

|
#32
Gabriella Ct
Burlington, KY 41005
|
- sq. feet
|
- baths - beds |
show details | |

|
#33
Taylor Dr Apt 162
Burlington, KY 41005
|
- sq. feet
|
- baths - beds |
show details | |

|
#34
Lucia Dr
Burlington, KY 41005
|
- sq. feet
|
- baths - beds |
show details | |

|
#35
Woodcrest Dr
Burlington, KY 41005
|
- sq. feet
|
- baths - beds |
show details | |

|
#36
S Jefferson St
Burlington, KY 41005
|
- sq. feet
|
- baths - beds |
show details | |

|
#37
Hammer Ct
Burlington, KY 41005
|
- sq. feet
|
- baths - beds |
show details | |

|
#38
Sarah Ln
Burlington, KY 41005
|
- sq. feet
|
- baths - beds |
show details | |

|
#39
Teal Briar Ln Apt 205
Burlington, KY 41005
|
- sq. feet
|
- baths - beds |
show details | |

|
#40
Regal Ridge Dr
Burlington, KY 41005
|
- sq. feet
|
- baths - beds |
show details |
| Photo | Address | Area | Beds / Baths | Price | Details |
|---|---|---|---|---|---|

|
#41
Featherstone Dr
Burlington, KY 41005
|
- sq. feet
|
- baths - beds |
show details | |

|
#42
Coachlight Ln
Burlington, KY 41005
|
- sq. feet
|
- baths - beds |
show details | |

|
#43
Mcguire Ln
Burlington, KY 41005
|
- sq. feet
|
- baths - beds |
show details | |

|
#44
Howe Rd
Burlington, KY 41005
|
- sq. feet
|
- baths - beds |
show details | |

|
#45
Gordon Blvd
Burlington, KY 41005
|
- sq. feet
|
- baths - beds |
show details | |

|
#46
Avalon Dr
Burlington, KY 41005
|
- sq. feet
|
- baths - beds |
show details | |

|
#47
Sawmill Ct Apt 207
Burlington, KY 41005
|
- sq. feet
|
- baths - beds |
show details | |

|
#48
Teal Briar Ln Apt 208
Burlington, KY 41005
|
- sq. feet
|
- baths - beds |
show details | |

|
#49
Falls Creek Way
Burlington, KY 41005
|
- sq. feet
|
- baths - beds |
show details | |

|
Check over 1 million property listings on Foreclosure.com!
|
browse all offers | |||

Latest news about housing in Burlington, KY collected exclusively by city-data.com from local newspapers, TV, and radio stations

 | rural rentals for relocating couple near Ghent, KY?? (3 replies) |
| What town if better for a retired couple in Kentucky? (19 replies) |
| Advice on northern KY and mixing rural and city life? (19 replies) |
| N.KY Cincinnati area questions (3 replies) |
| A possible move to the Florence area (or nearby) (24 replies) |
| Thinking of moving to Kentucky (36 replies) |
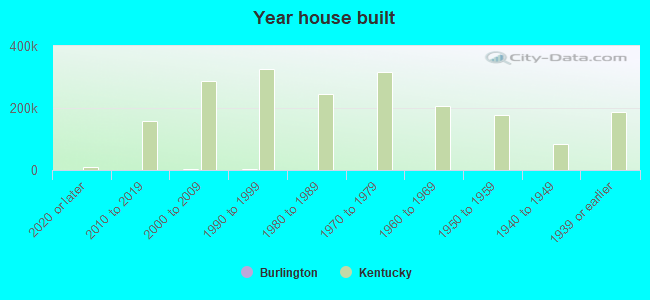
Median year apartment built: 1989
Household type by relationship:
Households: 18,658- Male householders: 3,563 (617 living alone), Female householders: 3,104 (922 living alone)
3,905 spouses (3,899 opposite-sex spouses), 527 unmarried partners, (470 opposite-sex unmarried partners), 5,617 children (5,016 natural, 194 adopted, 407 stepchildren), 664 grandchildren, 91 brothers or sisters, 56 parents, 81 foster children, 161 other relatives, 434 non-relatives
- In group quarters: 450
Size of family households: 1,548 2-persons, 1,565 3-persons, 1,093 4-persons, 590 5-persons, 60 6-persons, 98 7-or-more-persons.
Size of nonfamily households: 1,369 1-person, 331 2-persons, 120 3-persons, 52 4-persons.
2,425 married couples with children.
891 single-parent households (440 men, 451 women).
91.2% of residents of Burlington speak English at home.
4.3% of residents speak Spanish at home (72% speak English very well, 24% speak English well, 3% speak English not well, 1% don't speak English at all).
1.0% of residents speak other Indo-European language at home (61% speak English very well, 39% speak English well).
2.1% of residents speak Asian or Pacific Island language at home (100% speak English very well).
1.1% of residents speak other language at home (46% speak English very well, 36% speak English well, 18% speak English not well).
Foreign born population: 1,234 (6.6%)
(36.9% of them are naturalized citizens)
| Here: | 6.4 |
| State: | 6.4 |
| Here: | 4.5 |
| State: | 4.4 |
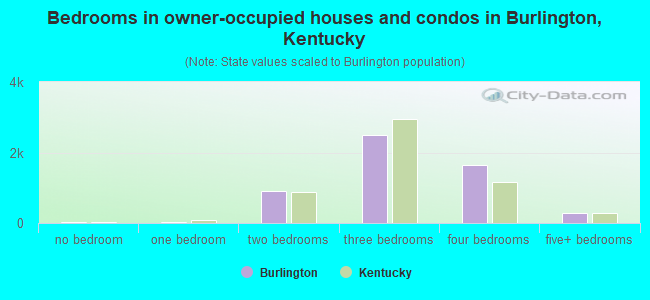
- Bedrooms in owner-occupied houses and condos in Burlington, Kentucky
- 33no bedroom
- 161 bedroom
- 9042 bedrooms
- 2,4893 bedrooms
- 1,6484 bedrooms
- 2935+ bedrooms
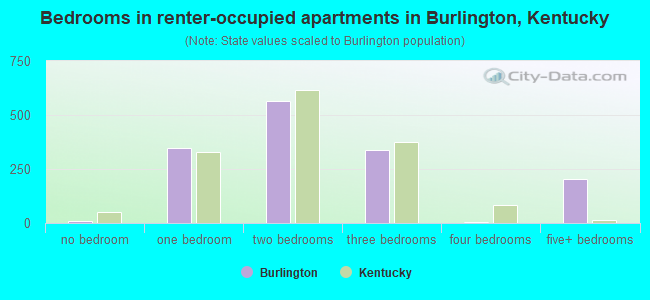
- Bedrooms in renter-occupied apartments in Burlington, Kentucky
- 8no bedroom
- 3471 bedroom
- 5672 bedrooms
- 3393 bedrooms
- 54 bedrooms
- 2025+ bedrooms
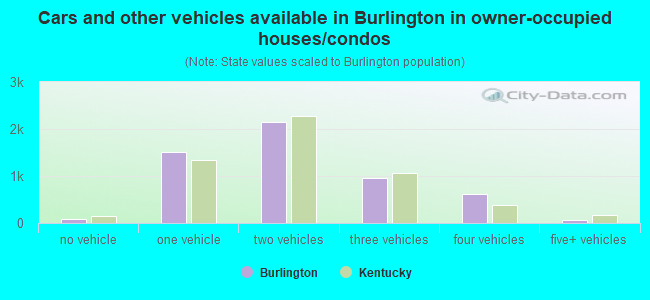
- Cars and other vehicles available in Burlington in owner-occupied houses/condos
- 78no vehicle
- 1,5081 vehicle
- 2,1572 vehicles
- 9593 vehicles
- 6194 vehicles
- 615+ vehicles
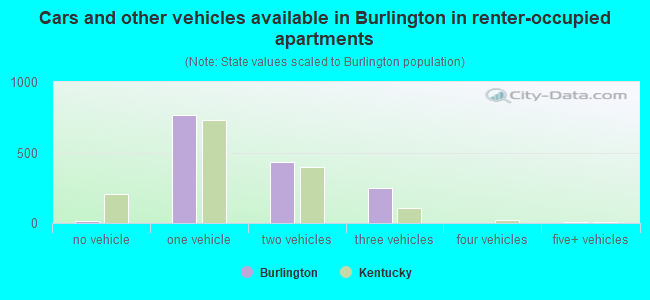
- Cars and other vehicles available in Burlington in renter-occupied apartments
- 14no vehicle
- 7691 vehicle
- 4332 vehicles
- 2473 vehicles
- 04 vehicles
- 55+ vehicles
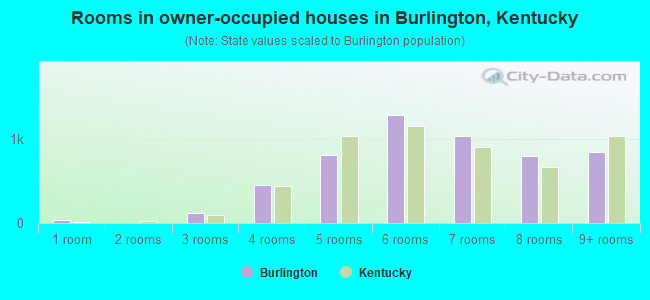
- Rooms in owner-occupied houses in Burlington, Kentucky
- 331 room
- 02 rooms
- 1163 rooms
- 4534 rooms
- 8155 rooms
- 1,2906 rooms
- 1,0337 rooms
- 7998 rooms
- 8439+ rooms
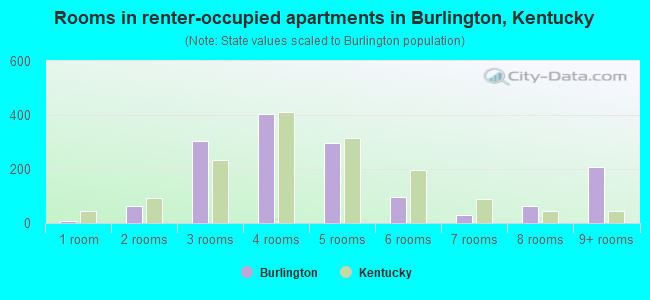
- Rooms in renter-occupied apartments in Burlington, Kentucky
- 81 room
- 632 rooms
- 3023 rooms
- 4024 rooms
- 2975 rooms
- 976 rooms
- 307 rooms
- 628 rooms
- 2079+ rooms
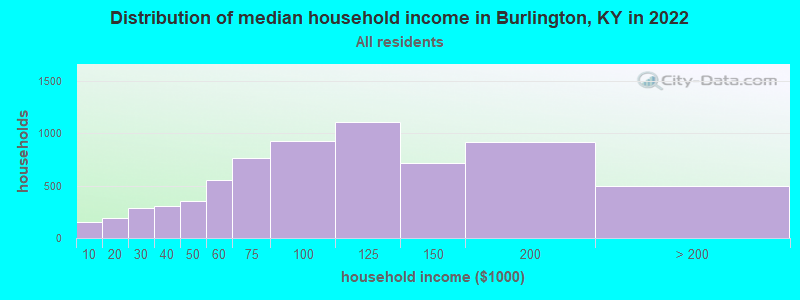
Burlington, KY household income distribution

- 153Less than $10,000
- 189$10,000 to $19,999
- 290$20,000 to $29,999
- 302$30,000 to $39,999
- 355$40,000 to $49,999
- 554$50,000 to $59,999
- 764$60,000 to $74,999
- 925$75,000 to $99,999
- 1,110$100,000 to $124,999
- 720$125,000 to $149,999
- 921$150,000 to $199,999
- 494$200,000 or more
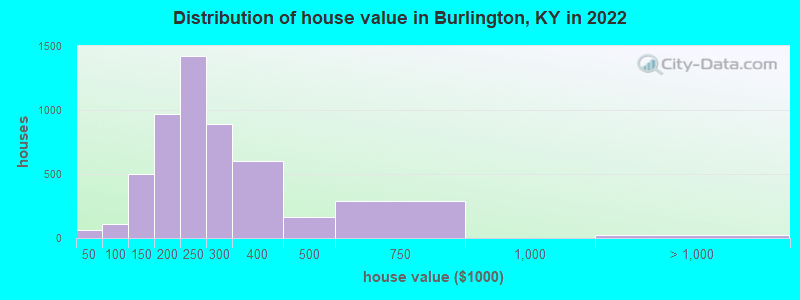
Home value of owner - occupied houses in 2022 in Burlington, KY
-
- 9$20,000 to $24,999
- 21$25,000 to $29,999
- 20$30,000 to $34,999
- 14$40,000 to $49,999
- 28$60,000 to $69,999
- 17$70,000 to $79,999
- 21$80,000 to $89,999
- 28$90,000 to $99,999
- 277$100,000 to $124,999
- 224$125,000 to $149,999
- 250$150,000 to $174,999
- 720$175,000 to $199,999
- 1,421$200,000 to $249,999
- 893$250,000 to $299,999
- 603$300,000 to $399,999
- 164$400,000 to $499,999
- 291$500,000 to $749,999
- 26$2,000,000 or more
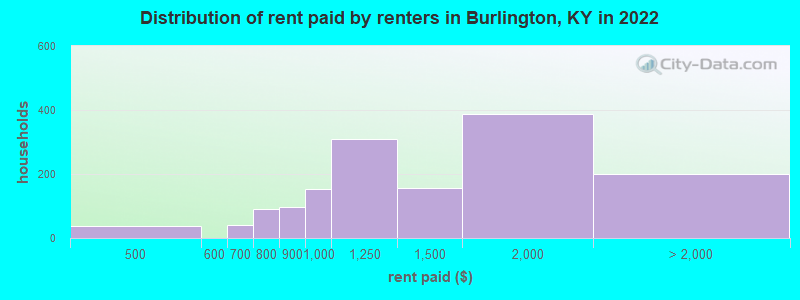
Rent paid by renters in 2022 in Burlington, KY
-
- 38$450 to $499
- 16$600 to $649
- 26$650 to $699
- 78$700 to $749
- 13$750 to $799
- 98$800 to $899
- 152$900 to $999
- 310$1,000 to $1,249
- 155$1,250 to $1,499
- 389$1,500 to $1,999
- 201No cash rent
Percentage of workers working in this county: 71.4%
Number of people working at home: 1,624 (16.3% of all workers)
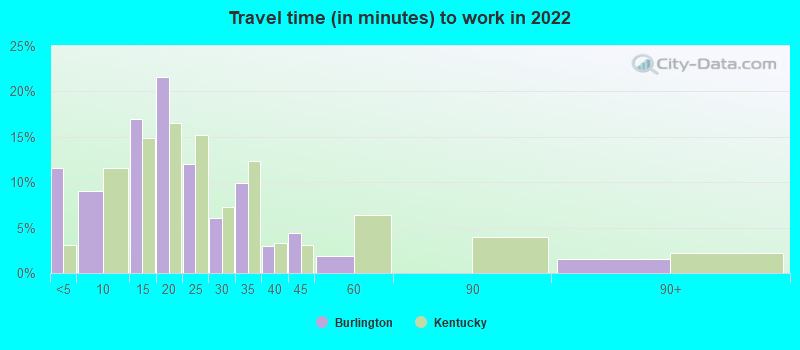
Travel time to work (commute)
- Less than 5 minutes: 347
- 5 to 9 minutes: 341
- 10 to 14 minutes: 1,253
- 15 to 19 minutes: 2,259
- 20 to 24 minutes: 918
- 25 to 29 minutes: 674
- 30 to 34 minutes: 1,014
- 35 to 39 minutes: 431
- 40 to 44 minutes: 180
- 45 to 59 minutes: 537
- 60 to 89 minutes: 115
- 90 or more minutes: 347
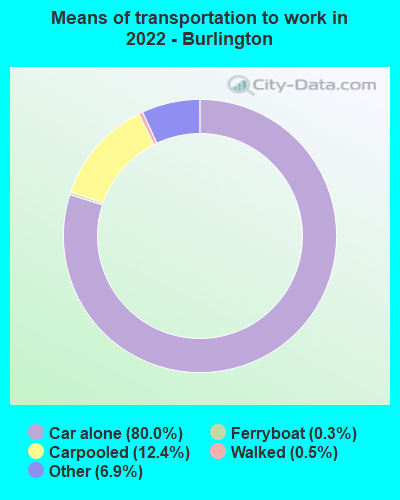
Means of transportation to work:
- Drove a car alone: 2,526 (56.0%)
- Carpooled: 431 (9.6%)
- Ferryboat: 17 (0.4%)
- Taxi: 261 (5.8%)
- Walked: 14 (0.3%)
- Worked at home: 1,624 (36.0%)
- Unemployment by race in 2022
- Unemployment rate for White non-Hispanic residents
- 6.1%Males
- 0.4%Females
- Unemployment rate for Hispanic or Latino residents
- 5.3%Males
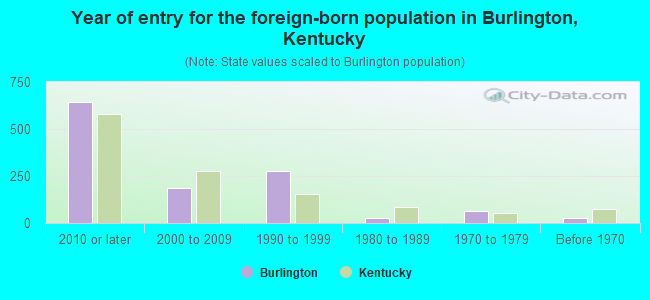
- Year of entry for the foreign-born population in Burlington, Kentucky
- 6412010 or later
- 1862000 to 2009
- 2751990 to 1999
- 281980 to 1989
- 631970 to 1979
- 29Before 1970
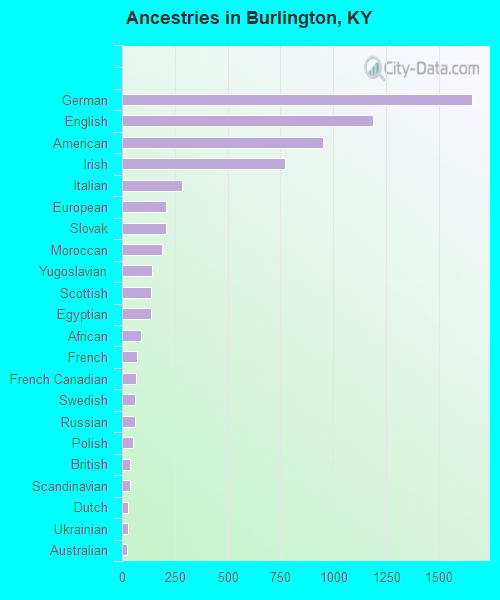
First ancestries reported:
- German: 1,654 (20.9%)
- English: 1,189 (15.0%)
- American: 951 (12.0%)
- Irish: 769 (9.7%)
- Italian: 282 (3.6%)
- European: 209 (2.6%)
- Slovak: 208 (2.6%)
- Moroccan: 187 (2.4%)
- Yugoslavian: 144 (1.8%)
- Scottish: 138 (1.7%)
- Egyptian: 135 (1.7%)
- African: 89 (1.1%)
- French: 70 (0.9%)
- French Canadian: 66 (0.8%)
- Swedish: 62 (0.8%)
- Russian: 60 (0.8%)
- Polish: 54 (0.7%)
- British: 39 (0.5%)
- Scandinavian: 39 (0.5%)
- Dutch: 30 (0.4%)
- Ukrainian: 29 (0.4%)
- Australian: 23 (0.3%)
- Bulgarian: 15 (0.2%)
- Welsh: 10 (0.1%)
- Scotch-Irish: 9 (0.1%)
- Zimbabwean: 9 (0.1%)
Most common places of birth for foreign-born residents (%):
| Burlington: | 27.4% (313) |
| Kentucky: | 7.3% (13,454) |
| Burlington: | 15.8% (181) |
| Kentucky: | 0.7% (1,310) |
| Burlington: | 7.5% (86) |
| Kentucky: | 15.8% (29,070) |
| Burlington: | 6.6% (76) |
| Kentucky: | 3.3% (6,109) |
| Burlington: | 5.8% (66) |
| Kentucky: | 1.7% (3,094) |
| Burlington: | 5.6% (64) |
| Kentucky: | 0.9% (1,604) |
| Burlington: | 5.5% (63) |
| Kentucky: | 0.3% (488) |
| Burlington: | 4.9% (56) |
| Kentucky: | 0.6% (1,089) |
| Burlington: | 4.7% (54) |
| Kentucky: | 0.9% (1,652) |
| Burlington: | 3.8% (44) |
| Kentucky: | 3.7% (6,894) |
| Burlington: | 2.3% (26) |
| Kentucky: | 4.2% (7,734) |
| Burlington: | 2.3% (26) |
| Kentucky: | 0.2% (438) |
| Burlington: | 1.6% (18) |
| Kentucky: | 0.8% (1,529) |
Place of birth for U.S.-born residents:
- This state: 10,096
- Other state: 7,163
- Northeast: 495
- Midwest: 4,841
- South: 1,622
- West: 267
86.8% of Burlington residents lived in the same house 1 years ago.
Out of people who lived in different houses, 26.0% lived in this county.
Out of people who lived in different counties, 59.3% lived in Kentucky.
| Burlington: | 86.8% |
| State average: | 87.2% |
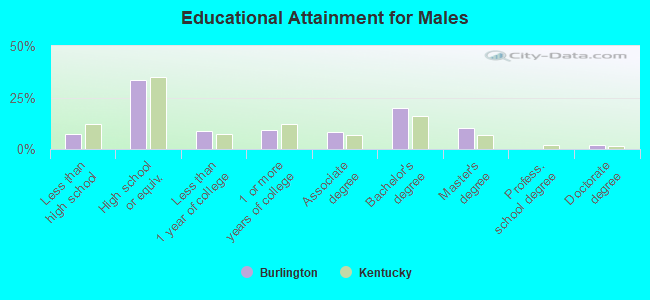
Education attainment for males 25 years and older:
- No schooling: 8
- Nursery to 4th grade: 29
- 5th and 6th grade: 23
- 7th and 8th grade: 23
- 9th grade: 132
- 10th grade: 48
- 11th grade: 104
- 12th grade, no diploma: 81
- High school graduate (or equivalency): 2,131
- Less than 1 year of college: 563
- Some college more than 1 year, no degree: 588
- Associate degree: 536
- Bachelor's degree: 1,272
- Master's degree: 659
- Professional school degree: 11
- Doctorate degree: 119
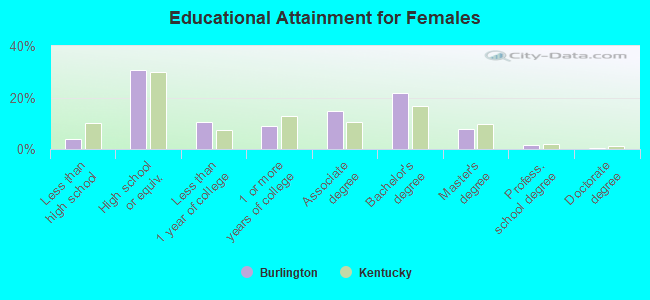
Education attainment for females 25 years and older:
- No schooling: 0
- Nursery to 4th grade: 0
- 5th and 6th grade: 33
- 7th and 8th grade: 38
- 9th grade: 7
- 10th grade: 64
- 11th grade: 23
- 12th grade, no diploma: 82
- High school graduate (or equivalency): 1,991
- Less than 1 year of college: 675
- Some college more than 1 year, no degree: 591
- Associate degree: 955
- Bachelor's degree: 1,407
- Master's degree: 509
- Professional school degree: 107
- Doctorate degree: 13
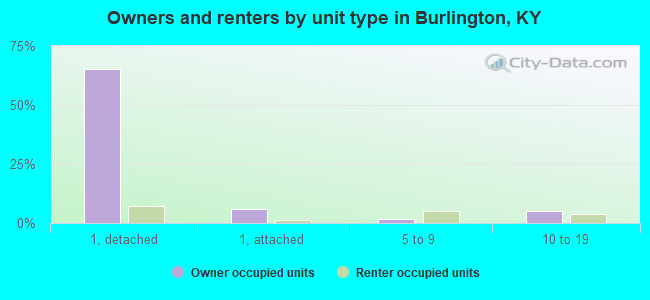
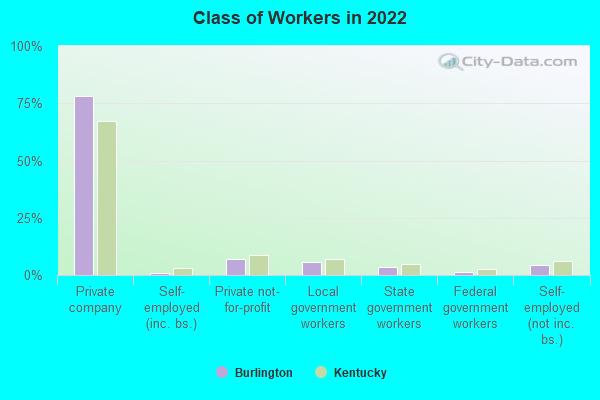
Housing units in structures:
- One, detached: 4,967
- One, attached: 549
- Two: 30
- 3 or 4: 130
- 5 to 9: 580
- 10 to 19: 745
- 50 or more: 58
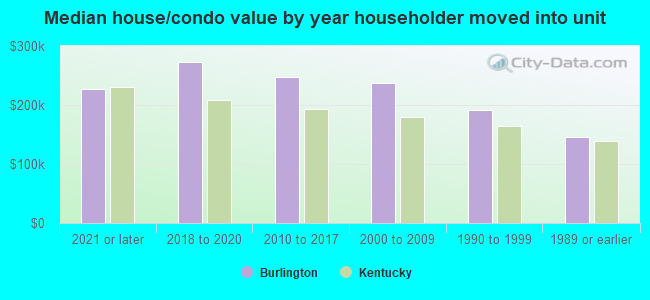
House/condo owner moved in on average 9 years ago
Renter moved in on average 4 years ago
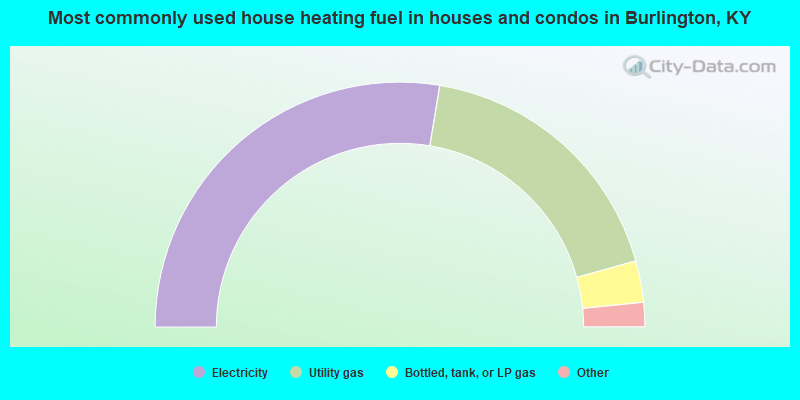
- 55.2%Electricity
- 36.1%Utility gas
- 5.5%Bottled, tank, or LP gas
- 1.4%Wood
- 0.9%Fuel oil, kerosene, etc.
- 0.9%No fuel used
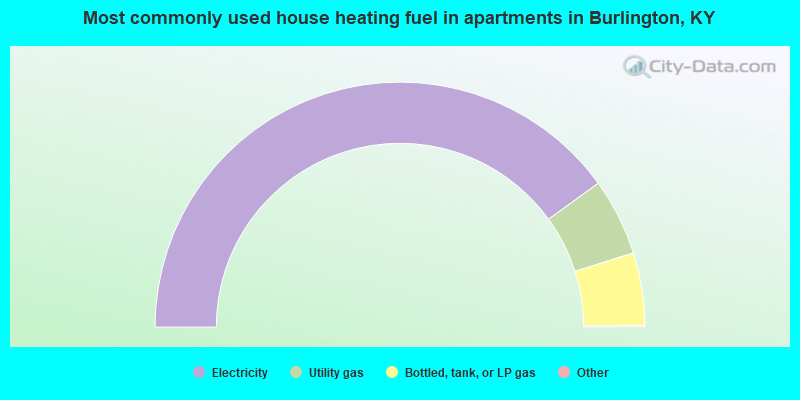
- 80.2%Electricity
- 10.2%Utility gas
- 9.6%Bottled, tank, or LP gas
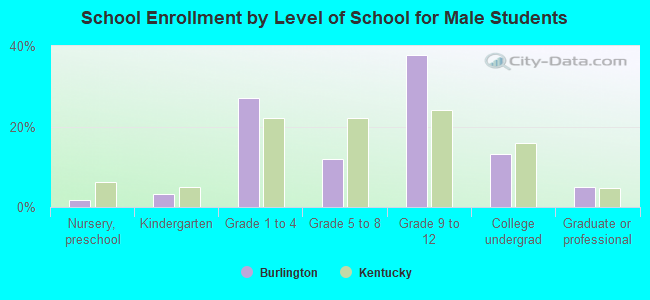
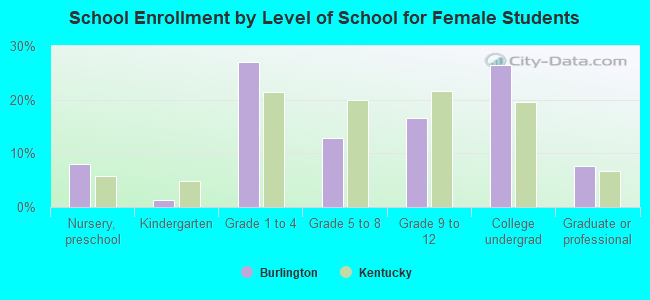
Private vs. public school enrollment:
| Here: | 10.4% |
| Kentucky: | 17.2% |
| Here: | 2.7% |
| Kentucky: | 15.2% |
| Here: | 18.0% |
| Kentucky: | 19.6% |