Cedar Mill, OR (Oregon) Houses and Residents
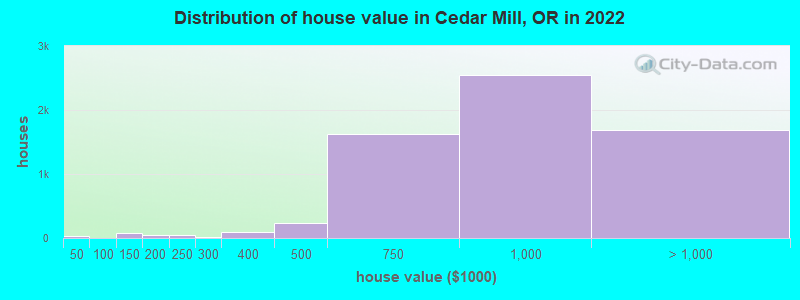
Estimated median house or condo value in 2022: $950,824 (it was $258,800 in 2000 )
Cedar Mill:
$950,824Oregon:
$475,600
Lower value quartile - upper value quartile: $651,399 - $1,092,756Mean price in 2022: Detached houses: $1,277,298 Here:
$1,277,298State:
$562,872
Townhouses or other attached units: $509,786 Here:
$509,786State:
$463,029
In 3-to-4-unit structures: $265,136 Here:
$265,136State:
$419,673
In 5-or-more-unit structures: $166,467 Here:
$166,467State:
$420,389
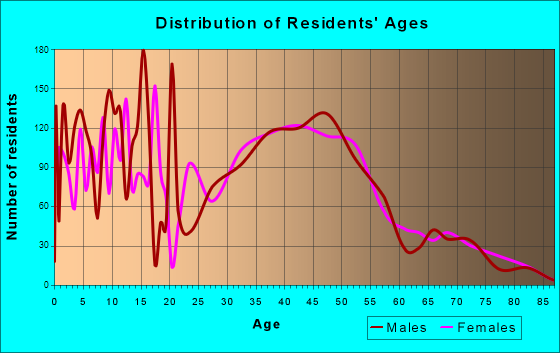
Total population: 14,546 (Urban population: 12,776, Rural population: 0)
Houses: 6,798 (6,717 occupied: 5,152 owner occupied, 1,607 renter occupied )
% of renters here:
24%State:
37%
Housing density: 1,828 houses/condos per square mile
Median price asked for vacant for-sale houses and condos in 2022 in this county: $413,110.
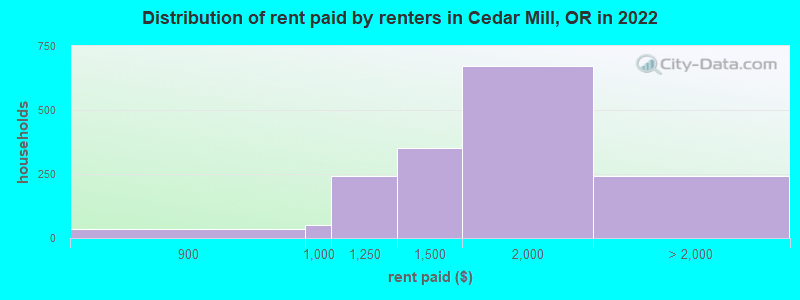
Median contract rent in 2022: $1,601 (lower quartile is $1,301, upper quartile is $1,898)
Median rent asked for vacant for-rent units in 2022: $4,358
Median gross rent in Cedar Mill, OR in 2022: $1,723
Housing units in Cedar Mill with a mortgage: 3,407 (329 second mortgage, 8 home equity loan, 292 both second mortgage and home equity loan )Houses without a mortgage: 108
Median household income for houses/condos with a mortgage: $211,276
Median household income for apartments without a mortgage: $193,473
Median monthly housing costs: $2,061
Data:
Median house or condo value ($)
Median house or condo value ($ change since 2000)
Median house or condo value ($) - White
Median house or condo value ($) - Black or African American
Median house or condo value ($) - Asian
Median house or condo value ($) - Hispanic or Latino
Median house or condo value ($) - American Indian and Alaska Native
Median house or condo value ($) - Multirace
Median house or condo value ($) - Other Race
Median price asked for mobile homes ($)
Household density (households per square mile)
Mean house or condo value by units in structure - 1, detached ($)
Mean house or condo value by units in structure - 1, attached ($)
Mean house or condo value by units in structure - 2 ($)
Mean house or condo value by units in structure by units in structure - 3 or 4 ($)
Mean house or condo value by units in structure - 5 or more ($)
Mean house or condo value by units in structure - Boat, RV, van, etc. ($)
Mean house or condo value by units in structure - Mobile home ($)
Median contract rent ($)
Median contract rent - Lower quartile ($)
Median contract rent - Upper quartile ($)
Median gross rent ($)
Urban houses (%)
Rural houses (%)
Houses occupied (%)
Houses occupied (% change since 2000)
Houses owner occupied (%)
Houses owner occupied (% change since 2000)
Houses renter occupied (%)
Houses renter occupied (% change since 2000)
Vacant housing units - For rent (%)
Vacant housing units - For rent (% change since 2000)
Vacant housing units - For sale only (%)
Vacant housing units - For sale only (% change since 2000)
Vacant housing units - Rented or sold, not occupied (%)
Vacant housing units - Rented or sold, not occupied (% change since 2000)
Vacant housing units - For seasonal, recreational, or occasional use (%)
Vacant housing units - For seasonal, recreational, or occasional use (% change since 2000)
Vacant housing units - For migrant workers (%)
Vacant housing units - For migrant workers (% change since 2000)
Vacant housing units - Other vacant (%)
Vacant housing units - Other vacant (% change since 2000)
Median monthly housing costs ($)
Median household income for houses/condos with a mortgage ($)
Median household income for houses/condos without a mortgage ($)
Median household income ($)
Median household income ($) - White
Median household income ($) - Black or African American
Median household income ($) - Asian
Median household income ($) - Hispanic or Latino
Median household income ($) - American Indian and Alaska Native
Median household income ($) - Multirace
Median household income ($) - Other Race
Mortgage status - with mortgage (%)
Mortgage status - with second mortgage (%)
Mortgage status - with home equity loan (%)
Mortgage status - with both second mortgage and home equity loan (%)
Mortgage status - without a mortgage (%)
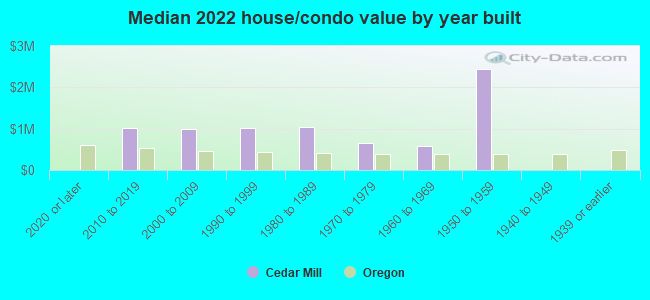
Median year house/condo built
Median year apartment built
Household type by relationship - Male householder living alone (%)
Household type by relationship - Male householder not living alone (%)
Household type by relationship - Female householder living alone (%)
Household type by relationship - Female householder not living alone (%)
Household type by relationship - Opposite-Sex spouse (%)
Household type by relationship - Same-Sex spouse (%)
Household type by relationship - Opposite-Sex unmarried partner (%)
Household type by relationship - Same-Sex unmarried partner (%)
Household type by relationship - In group quarters (%)
Size of family households - 2-person household (%)
Size of family households - 3-person household (%)
Size of family households - 4-person household (%)
Size of family households - 5-person household (%)
Size of family households - 6-person household (%)
Size of family households - 7-or-more-person household (%)
Size of nonfamily households - 1-person household (%)
Size of nonfamily households - 2-person household (%)
Size of nonfamily households - 3-person household (%)
Size of nonfamily households - 4-person household (%)
Size of nonfamily households - 5-person household (%)
Size of nonfamily households - 6-person household (%)
Size of nonfamily households - 7-or-moreperson household (%)
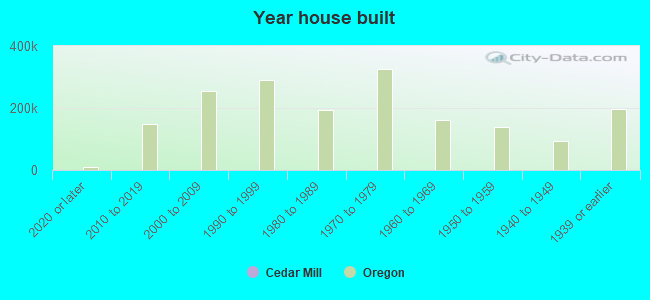
Year house built - Built 2010 or later (%)
Year house built - Built 2000 to 2009 (%)
Year house built - Built 1990 to 1999 (%)
Year house built - Built 1980 to 1989 (%)
Year house built - Built 1970 to 1979 (%)
Year house built - Built 1960 to 1969 (%)
Year house built - Built 1950 to 1959 (%)
Year house built - Built 1940 to 1949 (%)
Year house built - Built 1939 or earlier (%)
Median number of rooms in houses and condos
Median number of rooms in apartments
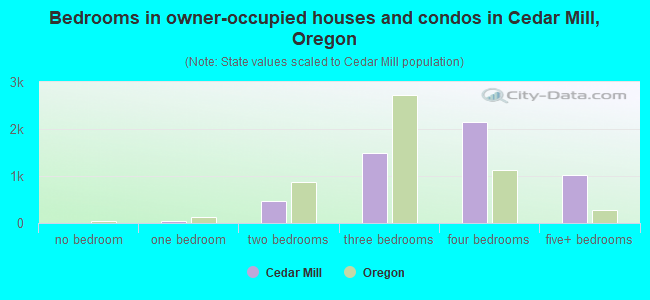
Median number of bedrooms in owner occupied houses
Mean number of bedrooms in owner occupied houses
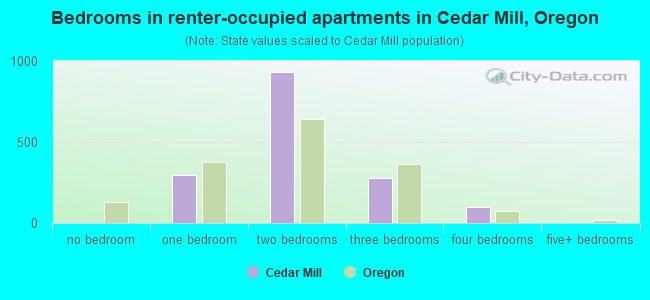
Median number of bedrooms in renter occupied houses
Mean number of bedrooms in renter occupied houses
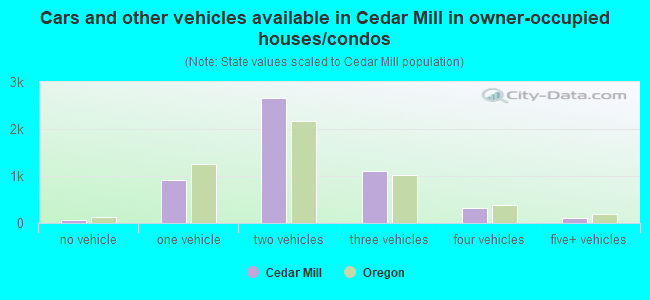
Median number of vehichles in owner occupied houses
Mean number of vehichles in owner occupied houses
Median number of vehichles in renter occupied houses
Mean number of vehichles in renter occupied houses
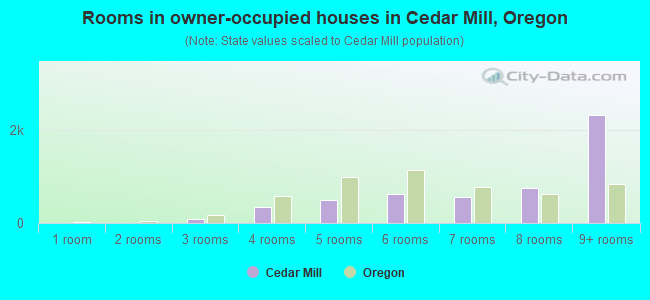
Rooms in owner-occupied houses - 1 room (%)
Rooms in owner-occupied houses - 2 rooms (%)
Rooms in owner-occupied houses - 3 rooms (%)
Rooms in owner-occupied houses - 4 rooms (%)
Rooms in owner-occupied houses - 5 rooms (%)
Rooms in owner-occupied houses - 6 rooms (%)
Rooms in owner-occupied houses - 7 rooms (%)
Rooms in owner-occupied houses - 8 rooms (%)
Rooms in owner-occupied houses - 9+ rooms (%)
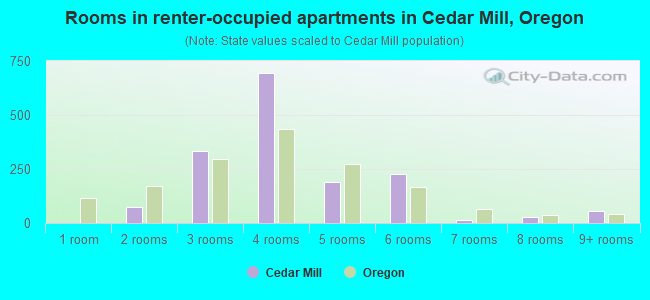
Rooms in renter-occupied houses - 1 room (%)
Rooms in renter-occupied houses - 2 rooms (%)
Rooms in renter-occupied houses - 3 rooms (%)
Rooms in renter-occupied houses - 4 rooms (%)
Rooms in renter-occupied houses - 5 rooms (%)
Rooms in renter-occupied houses - 6 rooms (%)
Rooms in renter-occupied houses - 7 rooms (%)
Rooms in renter-occupied houses - 8 rooms (%)
Rooms in renter-occupied houses - 9+ rooms (%)
Bedrooms in owner-occupied houses - no bedrooms (%)
Bedrooms in owner-occupied houses - 1 bedroom (%)
Bedrooms in owner-occupied houses - 2 bedrooms (%)
Bedrooms in owner-occupied houses - 3 bedrooms (%)
Bedrooms in owner-occupied houses - 4 bedrooms (%)
Bedrooms in owner-occupied houses - 5+ bedrooms (%)
Bedrooms in renter-occupied houses - no bedrooms (%)
Bedrooms in renter-occupied houses - 1 bedroom (%)
Bedrooms in renter-occupied houses - 2 bedrooms (%)
Bedrooms in renter-occupied houses - 3 bedrooms (%)
Bedrooms in renter-occupied houses - 4 bedrooms (%)
Bedrooms in renter-occupied houses - 5+ bedrooms (%)
Vehicles available in owner-occupied houses - no vehicle available (%)
Vehicles available in owner-occupied houses - 1 vehicle available(%)
Vehicles available in owner-occupied houses - 2 Vehicles available (%)
Vehicles available in owner-occupied houses - 3 Vehicles available (%)
Vehicles available in owner-occupied houses - 4 Vehicles available (%)
Vehicles available in owner-occupied houses - 5+ Vehicles available (%)
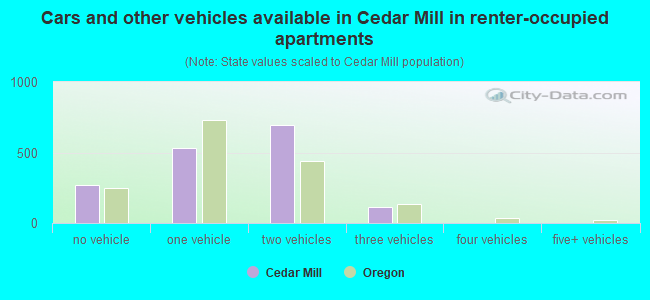
Vehicles available in renter-occupied houses - no vehicle available (%)
Vehicles available in renter-occupied houses - 1 vehicle available (%)
Vehicles available in renter-occupied houses - 2 Vehicles available (%)
Vehicles available in renter-occupied houses - 3 Vehicles available (%)
Vehicles available in renter-occupied houses - 4 Vehicles available (%)
Vehicles available in renter-occupied houses - 5+ Vehicles available (%)
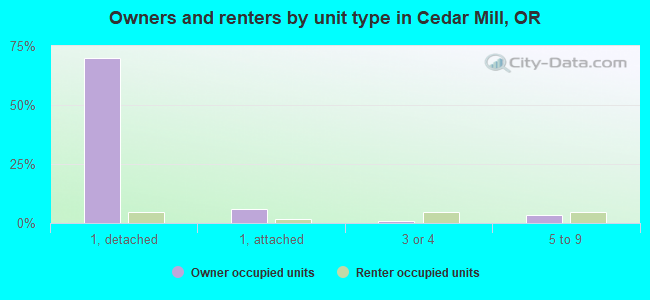
Housing units in structures - 1, detached (%)
Housing units in structures - 1, attached (%)
Housing units in structures - 2 (%)
Housing units in structures - 3 or 4 (%)
Housing units in structures - 5 to 9 (%)
Housing units in structures - 10 to 19 (%)
Housing units in structures - 20 to 49 (%)
Housing units in structures - 50 or more (%)
Housing units in structures - Mobile home (%)
Housing units in structures - Boat, RV, van, etc. (%)
Housing units in structures - Owners - 1, detached (%)
Housing units in structures - Owners - 1, attached (%)
Housing units in structures - Owners - 2 (%)
Housing units in structures - Owners - 3 or 4 (%)
Housing units in structures - Owners - 5 to 9 (%)
Housing units in structures - Owners - 10 to 19 (%)
Housing units in structures - Owners - 20 to 49 (%)
Housing units in structures - Owners - 50 or more (%)
Housing units in structures - Owners - Mobile home (%)
Housing units in structures - Owners - Boat, RV, van, etc. (%)
Housing units in structures - Renters - 1, detached (%)
Housing units in structures - Renters - 1, attached (%)
Housing units in structures - Renters - 2 (%)
Housing units in structures - Renters - 3 or 4 (%)
Housing units in structures - Renters - 5 to 9 (%)
Housing units in structures - Renters - 10 to 19 (%)
Housing units in structures - Renters - 20 to 49 (%)
Housing units in structures - Renters - 50 or more (%)
Housing units in structures - Renters - Mobile home (%)
Housing units in structures - Renters - Boat, RV, van, etc. (%)
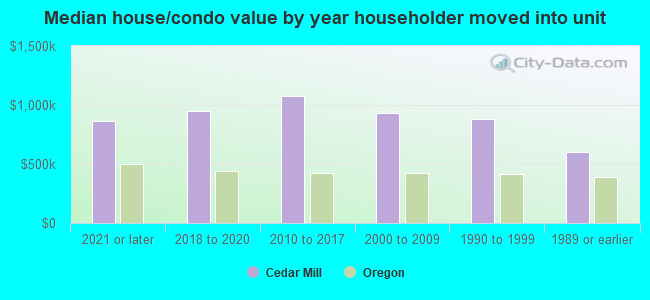
House/condo owner moved in on average (years ago)
Renter moved in on average (years ago)
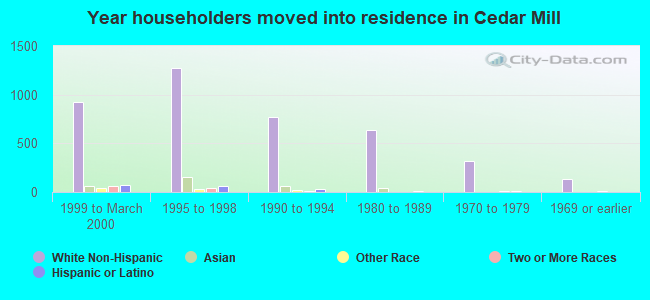
Year householder moved into unit - Moved in 1999 to March 2000 (%)
Year householder moved into unit - Moved in 1999 to March 2000 (%) - White
Year householder moved into unit - Moved in 1999 to March 2000 (%) - Black or African American
Year householder moved into unit - Moved in 1999 to March 2000 (%) - Asian
Year householder moved into unit - Moved in 1999 to March 2000 (%) - Hispanic or Latino
Year householder moved into unit - Moved in 1999 to March 2000 (%) - American Indian and Alaska Native
Year householder moved into unit - Moved in 1999 to March 2000 (%) - Multirace
Year householder moved into unit - Moved in 1999 to March 2000 (%) - Other Race
Year householder moved into unit - Moved in 1995 to 1998 (%)
Year householder moved into unit - Moved in 1995 to 1998 (%) - White
Year householder moved into unit - Moved in 1995 to 1998 (%) - Black or African American
Year householder moved into unit - Moved in 1995 to 1998 (%) - Asian
Year householder moved into unit - Moved in 1995 to 1998 (%) - Hispanic or Latino
Year householder moved into unit - Moved in 1995 to 1998 (%) - American Indian and Alaska Native
Year householder moved into unit - Moved in 1995 to 1998 (%) - Multirace
Year householder moved into unit - Moved in 1995 to 1998 (%) - Other Race
Year householder moved into unit - Moved in 1990 to 1994 (%)
Year householder moved into unit - Moved in 1990 to 1994 (%) - White
Year householder moved into unit - Moved in 1990 to 1994 (%) - Black or African American
Year householder moved into unit - Moved in 1990 to 1994 (%) - Asian
Year householder moved into unit - Moved in 1990 to 1994 (%) - Hispanic or Latino
Year householder moved into unit - Moved in 1990 to 1994 (%) - American Indian and Alaska Native
Year householder moved into unit - Moved in 1990 to 1994 (%) - Multirace
Year householder moved into unit - Moved in 1990 to 1994 (%) - Other Race
Year householder moved into unit - Moved in 1980 to 1989 (%)
Year householder moved into unit - Moved in 1980 to 1989 (%) - White
Year householder moved into unit - Moved in 1980 to 1989 (%) - Black or African American
Year householder moved into unit - Moved in 1980 to 1989 (%) - Asian
Year householder moved into unit - Moved in 1980 to 1989 (%) - Hispanic or Latino
Year householder moved into unit - Moved in 1980 to 1989 (%) - American Indian and Alaska Native
Year householder moved into unit - Moved in 1980 to 1989 (%) - Multirace
Year householder moved into unit - Moved in 1980 to 1989 (%) - Other Race
Year householder moved into unit - Moved in 1970 to 1979 (%)
Year householder moved into unit - Moved in 1970 to 1979 (%) - White
Year householder moved into unit - Moved in 1970 to 1979 (%) - Black or African American
Year householder moved into unit - Moved in 1970 to 1979 (%) - Asian
Year householder moved into unit - Moved in 1970 to 1979 (%) - Hispanic or Latino
Year householder moved into unit - Moved in 1970 to 1979 (%) - American Indian and Alaska Native
Year householder moved into unit - Moved in 1970 to 1979 (%) - Multirace
Year householder moved into unit - Moved in 1970 to 1979 (%) - Other Race
Year householder moved into unit - Moved in 1969 or earlier (%)
Year householder moved into unit - Moved in 1969 or earlier (%) - White
Year householder moved into unit - Moved in 1969 or earlier (%) - Black or African American
Year householder moved into unit - Moved in 1969 or earlier (%) - Asian
Year householder moved into unit - Moved in 1969 or earlier (%) - Hispanic or Latino
Year householder moved into unit - Moved in 1969 or earlier (%) - American Indian and Alaska Native
Year householder moved into unit - Moved in 1969 or earlier (%) - Multirace
Year householder moved into unit - Moved in 1969 or earlier (%) - Other Race
Housing units lacking complete plumbing facilities (%)
Housing units lacking complete kitchen facilities (%)
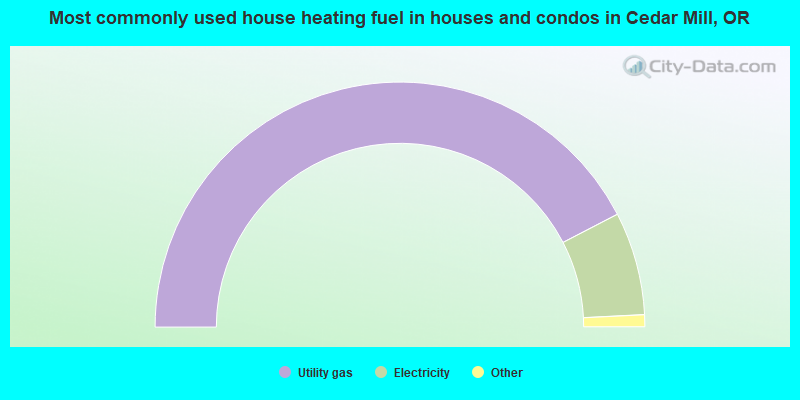
House heating fuel used in houses and condos - Utility gas (%)
House heating fuel used in houses and condos - Bottled, tank, or LP gas (%)
House heating fuel used in houses and condos - Electricity (%)
House heating fuel used in houses and condos - Fuel oil, kerosene, etc. (%)
House heating fuel used in houses and condos - Coal or coke (%)
House heating fuel used in houses and condos - Wood (%)
House heating fuel used in houses and condos - Solar energy (%)
House heating fuel used in houses and condos - Other fuel (%)
House heating fuel used in houses and condos - No fuel used (%)
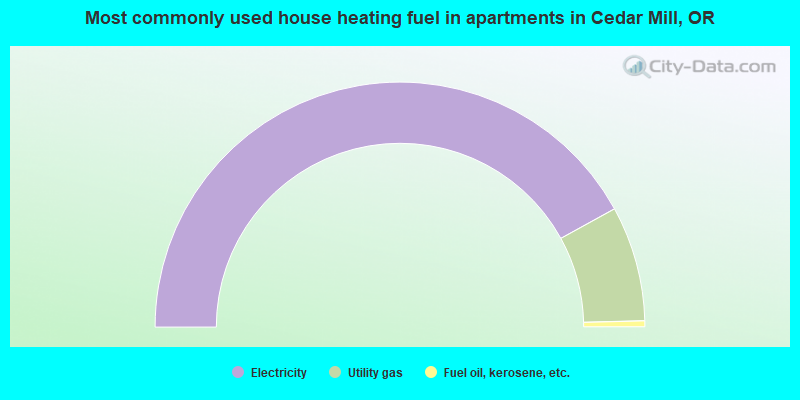
House heating fuel used in apartments - Utility gas (%)
House heating fuel used in apartments - Bottled, tank, or LP gas (%)
House heating fuel used in apartments - Electricity (%)
House heating fuel used in apartments - Fuel oil, kerosene, etc. (%)
House heating fuel used in apartments - Coal or coke (%)
House heating fuel used in apartments - Wood (%)
House heating fuel used in apartments - Solar energy (%)
House heating fuel used in apartments - Other fuel (%)
House heating fuel used in apartments - No fuel used (%)
Median year house/condo built: 1994Median year apartment built: 1982Household type by relationship:
Households: 19,171
Male householders: 3,697 (704 living alone ), Female householders: 2,864 (623 living alone )4,036 spouses (3,997 opposite-sex spouses ), 492 unmarried partners , (453 opposite-sex unmarried partners ), 6,919 children (6,641 natural , 196 adopted , 82 stepchildren ), 78 grandchildren , 103 brothers or sisters , 357 parents , 0 foster children , 216 other relatives , 374 non-relatives In group quarters: 32
Size of family households: 1,595 2-persons , 1,141 3-persons , 1,214 4-persons , 652 5-persons , 203 6-persons , 43 7-or-more-persons .
Size of nonfamily households: 1,436 1-person , 308 2-persons , 54 3-persons , 9 4-persons .
4,571 married couples with children. single-parent households (190 men , 561 women ).
70.4% of residents of Cedar Mill speak English at home. of residents speak Spanish at home (46% speak English very well , 34% speak English well , 21% speak English not well ).of residents speak other Indo-European language at home (96% speak English very well , 3% speak English well , 1% speak English not well ).of residents speak Asian or Pacific Island language at home (75% speak English very well , 16% speak English well , 8% speak English not well , 1% don't speak English at all ).of residents speak other language at home (86% speak English very well , 9% speak English well , 4% don't speak English at all ).
Foreign born population: 4,798 (25.0%)of them are naturalized citizens )
Median number of rooms in houses and condos:
Median number of rooms in apartments
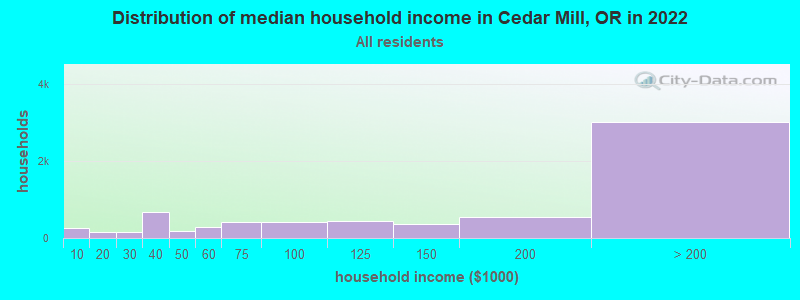
Cedar Mill, OR household income distribution 249 Less than $10,000152 $10,000 to $19,999148 $20,000 to $29,999678 $30,000 to $39,999195 $40,000 to $49,999275 $50,000 to $59,999405 $60,000 to $74,999407 $75,000 to $99,999455 $100,000 to $124,999365 $125,000 to $149,999538 $150,000 to $199,9993,018 $200,000 or more
Home value of owner - occupied houses in 2022 in Cedar Mill, OR 12 Less than $10,00014 $10,000 to $14,99940 $100,000 to $124,99940 $125,000 to $149,99950 $175,000 to $199,99952 $200,000 to $249,99910 $250,000 to $299,99998 $300,000 to $399,999233 $400,000 to $499,9991,620 $500,000 to $749,9992,544 $750,000 to $999,9991,332 $1,000,000 to $1,499,999128 $1,500,000 to $1,999,999227 $2,000,000 or moreRent paid by renters in 2022 in Cedar Mill, OR 33 $800 to $89951 $900 to $999242 $1,000 to $1,249349 $1,250 to $1,499672 $1,500 to $1,999158 $2,000 to $2,49960 $2,500 to $2,99921 $3,000 to $3,499
Percentage of workers working in this county: 81.9%Number of people working at home: 3,642 (39.2% of all workers )
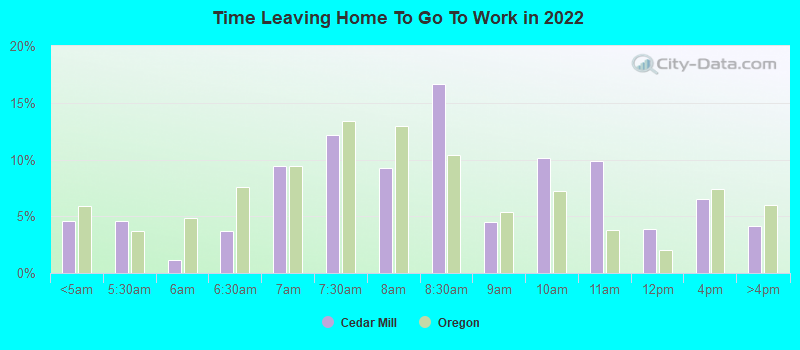
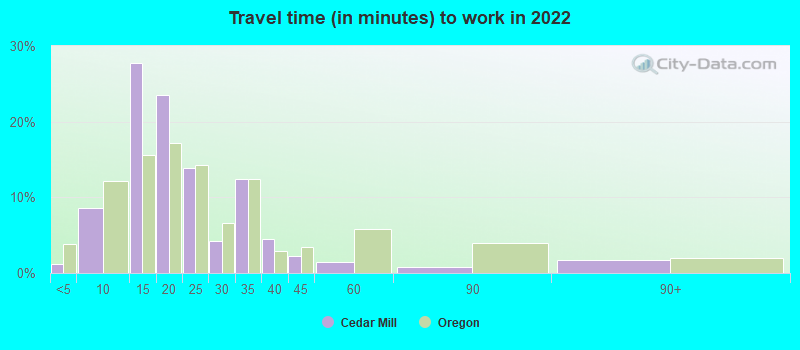
Travel time to work (commute)
Less than 5 minutes: 475 to 9 minutes: 37010 to 14 minutes: 76815 to 19 minutes: 1,18520 to 24 minutes: 1,49325 to 29 minutes: 50430 to 34 minutes: 79835 to 39 minutes: 23540 to 44 minutes: 10045 to 59 minutes: 25460 to 89 minutes: 25190 or more minutes: 51
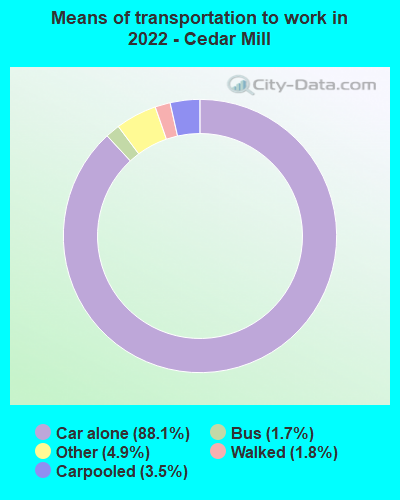
Means of transportation to work:
Drove a car alone: 1,773 (36.6%)Carpooled: 62 (1.3%)Bus : 29 (0.6%)Taxi: 125 (2.6%)Walked: 41 (0.8%)Worked at home: 3,642 (75.1%)
Unemployment by race in 2022
Unemployment rate for White non-Hispanic residents 3.6% Males4.0% FemalesUnemployment rate for Asian residents 7.7% Males5.6% Females
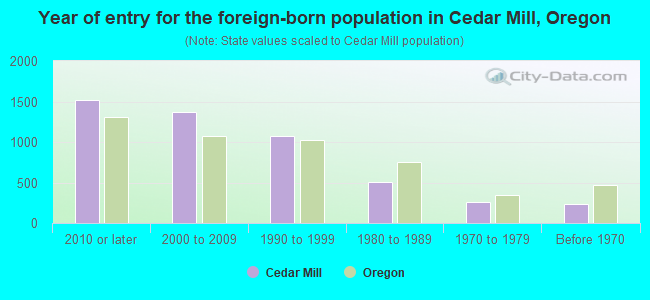
Year of entry for the foreign-born population in Cedar Mill, Oregon
1,521 2010 or later 1,368 2000 to 2009 1,076 1990 to 1999 510 1980 to 1989 261 1970 to 1979 231 Before 1970
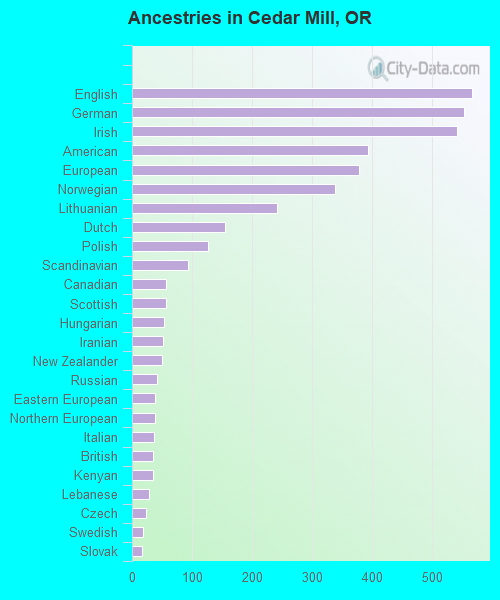
First ancestries reported:
English: 567 (6.6%)
German: 554 (6.4%)
Irish: 542 (6.3%)
American: 394 (4.6%)
European: 379 (4.4%)
Norwegian: 339 (3.9%)
Lithuanian: 242 (2.8%)
Dutch: 155 (1.8%)
Polish: 126 (1.5%)
Scandinavian: 94 (1.1%)
Canadian: 56 (0.6%)
Scottish: 56 (0.6%)
Hungarian: 53 (0.6%)
Iranian: 51 (0.6%)
New Zealander: 50 (0.6%)
Russian: 41 (0.5%)
Eastern European: 38 (0.4%)
Northern European: 38 (0.4%)
Italian: 36 (0.4%)
British: 35 (0.4%)
Kenyan: 35 (0.4%)
Lebanese: 29 (0.3%)
Czech: 24 (0.3%)
Swedish: 18 (0.2%)
Slovak: 17 (0.2%)
Danish: 13 (0.2%)
Portuguese: 13 (0.2%)
Scotch-Irish: 12 (0.1%)
Turkish: 12 (0.1%)
Egyptian: 11 (0.1%)
Pennsylvania German: 11 (0.1%)
Swiss: 10 (0.1%)
French: 9 (0.1%)
Belgian: 6 (0.07%)
South African: 5 (0.06%)
Welsh: 2 (0.02%)
African: 1 (0.01%) Most common places of birth for foreign-born residents (%): India Cedar Mill:
17.9% (866)Oregon:
4.7% (19,604)
China, excluding Hong Kong and Taiwan Cedar Mill:
12.1% (582)Oregon:
5.2% (21,429)
Israel Cedar Mill:
6.2% (301)Oregon:
0.5% (1,983)
United Kingdom, excluding England and Scotland Cedar Mill:
6.1% (294)Oregon:
1.2% (5,082)
Mexico Cedar Mill:
5.5% (265)Oregon:
33.9% (140,109)
Ireland Cedar Mill:
4.8% (231)Oregon:
0.4% (1,480)
Jordan Cedar Mill:
3.9% (190)Oregon:
0.2% (640)
Korea Cedar Mill:
3.3% (160)Oregon:
2.8% (11,450)
Vietnam Cedar Mill:
3.3% (157)Oregon:
5.5% (22,563)
England Cedar Mill:
3.1% (149)Oregon:
1.5% (6,313)
Taiwan Cedar Mill:
2.7% (128)Oregon:
0.8% (3,319)
Germany Cedar Mill:
2.4% (118)Oregon:
1.9% (8,005)
Lithuania Cedar Mill:
2.4% (114)Oregon:
0.1% (368)
Hong Kong Cedar Mill:
2.2% (106)Oregon:
0.6% (2,667)
Guatemala Cedar Mill:
2.2% (104)Oregon:
1.7% (7,103)
Philippines Cedar Mill:
2.1% (101)Oregon:
3.5% (14,530)
Canada Cedar Mill:
1.7% (82)Oregon:
3.7% (15,229)
Kenya Cedar Mill:
1.5% (74)Oregon:
0.4% (1,625)
Place of birth for U.S.-born residents:
This state: 7,029Other state: 7,189Northeast: 1,395Midwest: 1,044South: 1,235West: 3,507 88.3% of Cedar Mill residents lived in the same house 1 years ago.
Out of people who lived in different houses, 32.8% lived in this county.
Out of people who lived in different counties, 58.3% lived in Oregon.
Cedar Mill:
88.3%State average:
85.5%
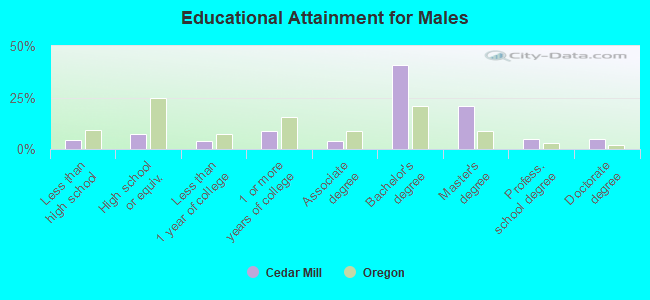
Education attainment for males 25 years and older:
No schooling: 56Nursery to 4th grade: 05th and 6th grade: 1207th and 8th grade: 309th grade: 010th grade: 011th grade: 2512th grade, no diploma: 47High school graduate (or equivalency): 481Less than 1 year of college: 262Some college more than 1 year, no degree: 565Associate degree: 248Bachelor's degree: 2,626Master's degree: 1,342Professional school degree: 305Doctorate degree: 314
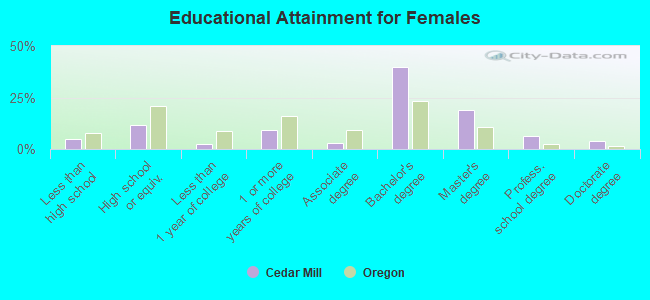
Education attainment for females 25 years and older:
No schooling: 52Nursery to 4th grade: 235th and 6th grade: 517th and 8th grade: 399th grade: 010th grade: 1211th grade: 2412th grade, no diploma: 93High school graduate (or equivalency): 722Less than 1 year of college: 136Some college more than 1 year, no degree: 564Associate degree: 171Bachelor's degree: 2,437Master's degree: 1,157Professional school degree: 394Doctorate degree: 231
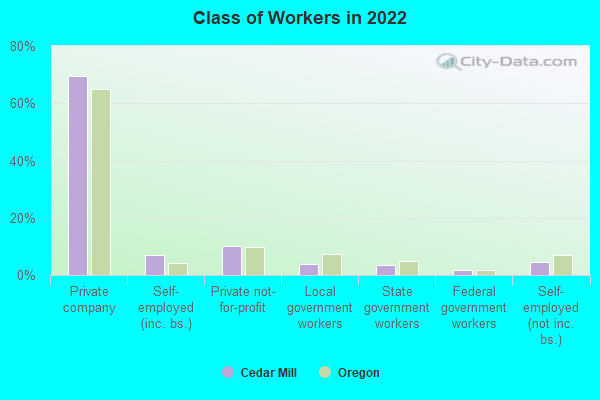
Housing units in structures:
One, detached: 4,997One, attached: 286Two: 923 or 4: 2775 to 9: 46210 to 19: 12220 to 49: 4650 or more: 513House/condo owner moved in on average 8 years ago
Renter moved in on average 4 years ago
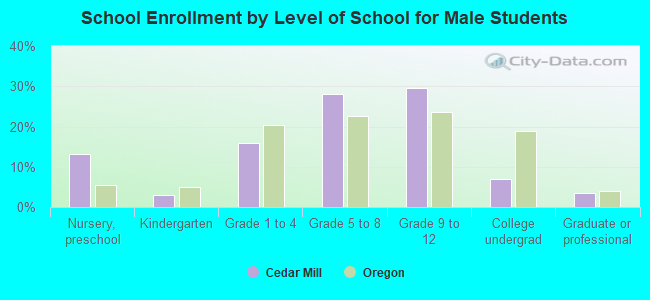
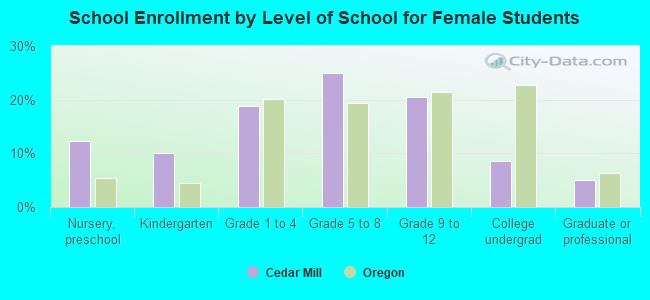
Private vs. public school enrollment:
Students in private schools in grades 1 to 8 (elementary and middle school): 599 Students in private schools in grades 9 to 12 (high school): 134 Students in private undergraduate colleges: 59