Cedar Rapids, IA (Iowa) Houses and Residents
Estimated median house or condo value in 2022: $173,200 (it was $92,900 in 2000 )
Cedar Rapids:
$173,200Iowa:
$194,600
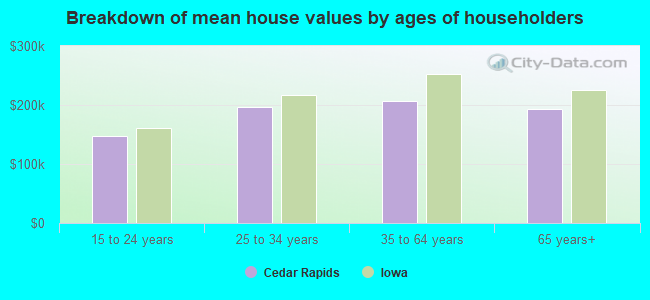
Lower value quartile - upper value quartile: $126,900 - $255,600Mean price in 2022: Detached houses: $213,344 Here:
$213,344State:
$245,224
Townhouses or other attached units: $208,186 Here:
$208,186State:
$238,767
In 2-unit structures: $181,669 Here:
$181,669State:
$243,070
In 3-to-4-unit structures: $123,362 Here:
$123,362State:
$162,139
In 5-or-more-unit structures: $180,307 Here:
$180,307State:
$190,519
Mobile homes: $33,824 Here:
$33,824State:
$51,271
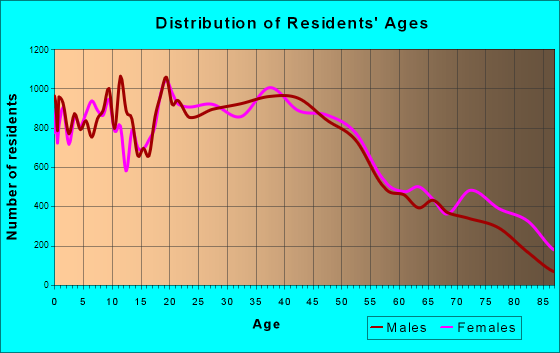
Total population: 129,195 (Urban population: 119,320, Rural population: 1,243 (28 farm, 1,215 nonfarm ))
Houses: 63,081 (58,282 occupied: 40,907 owner occupied, 17,375 renter occupied )
% of renters here:
30%State:
28%
Housing density: 999 houses/condos per square mile
Median price asked for vacant for-sale houses and condos in 2022: $149,268.
Median contract rent in 2022: $745 (lower quartile is $601, upper quartile is $931)
Median rent asked for vacant for-rent units in 2022: $1,314
Median gross rent in Cedar Rapids, IA in 2022: $835
Housing units in Cedar Rapids with a mortgage: 25,335 (3,405 second mortgage, 88 home equity loan, 2,105 both second mortgage and home equity loan )Houses without a mortgage: 929
Median household income for houses/condos with a mortgage: $88,975
Median household income for apartments without a mortgage: $64,800
Median monthly housing costs: $979
Data:
Median house or condo value ($)
Median house or condo value ($ change since 2000)
Median house or condo value ($) - White
Median house or condo value ($) - Black or African American
Median house or condo value ($) - Asian
Median house or condo value ($) - Hispanic or Latino
Median house or condo value ($) - American Indian and Alaska Native
Median house or condo value ($) - Multirace
Median house or condo value ($) - Other Race
Median price asked for mobile homes ($)
Household density (households per square mile)
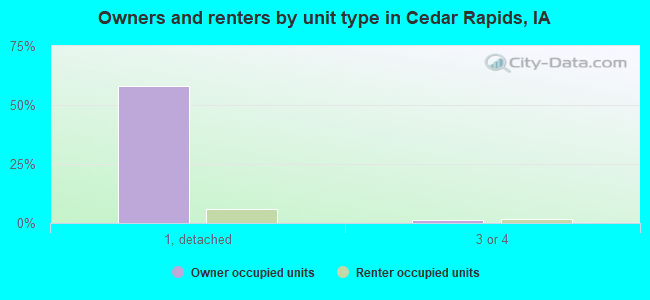
Mean house or condo value by units in structure - 1, detached ($)
Mean house or condo value by units in structure - 1, attached ($)
Mean house or condo value by units in structure - 2 ($)
Mean house or condo value by units in structure by units in structure - 3 or 4 ($)
Mean house or condo value by units in structure - 5 or more ($)
Mean house or condo value by units in structure - Boat, RV, van, etc. ($)
Mean house or condo value by units in structure - Mobile home ($)
Median contract rent ($)
Median contract rent - Lower quartile ($)
Median contract rent - Upper quartile ($)
Median gross rent ($)
Urban houses (%)
Rural houses (%)
Houses occupied (%)
Houses occupied (% change since 2000)
Houses owner occupied (%)
Houses owner occupied (% change since 2000)
Houses renter occupied (%)
Houses renter occupied (% change since 2000)
Vacant housing units - For rent (%)
Vacant housing units - For rent (% change since 2000)
Vacant housing units - For sale only (%)
Vacant housing units - For sale only (% change since 2000)
Vacant housing units - Rented or sold, not occupied (%)
Vacant housing units - Rented or sold, not occupied (% change since 2000)
Vacant housing units - For seasonal, recreational, or occasional use (%)
Vacant housing units - For seasonal, recreational, or occasional use (% change since 2000)
Vacant housing units - For migrant workers (%)
Vacant housing units - For migrant workers (% change since 2000)
Vacant housing units - Other vacant (%)
Vacant housing units - Other vacant (% change since 2000)
Median monthly housing costs ($)
Median household income for houses/condos with a mortgage ($)
Median household income for houses/condos without a mortgage ($)
Median household income ($)
Median household income ($) - White
Median household income ($) - Black or African American
Median household income ($) - Asian
Median household income ($) - Hispanic or Latino
Median household income ($) - American Indian and Alaska Native
Median household income ($) - Multirace
Median household income ($) - Other Race
Mortgage status - with mortgage (%)
Mortgage status - with second mortgage (%)
Mortgage status - with home equity loan (%)
Mortgage status - with both second mortgage and home equity loan (%)
Mortgage status - without a mortgage (%)
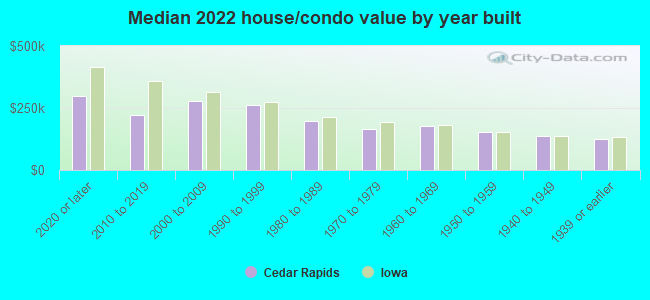
Median year house/condo built
Median year apartment built
Household type by relationship - Male householder living alone (%)
Household type by relationship - Male householder not living alone (%)
Household type by relationship - Female householder living alone (%)
Household type by relationship - Female householder not living alone (%)
Household type by relationship - Opposite-Sex spouse (%)
Household type by relationship - Same-Sex spouse (%)
Household type by relationship - Opposite-Sex unmarried partner (%)
Household type by relationship - Same-Sex unmarried partner (%)
Household type by relationship - In group quarters (%)
Size of family households - 2-person household (%)
Size of family households - 3-person household (%)
Size of family households - 4-person household (%)
Size of family households - 5-person household (%)
Size of family households - 6-person household (%)
Size of family households - 7-or-more-person household (%)
Size of nonfamily households - 1-person household (%)
Size of nonfamily households - 2-person household (%)
Size of nonfamily households - 3-person household (%)
Size of nonfamily households - 4-person household (%)
Size of nonfamily households - 5-person household (%)
Size of nonfamily households - 6-person household (%)
Size of nonfamily households - 7-or-moreperson household (%)
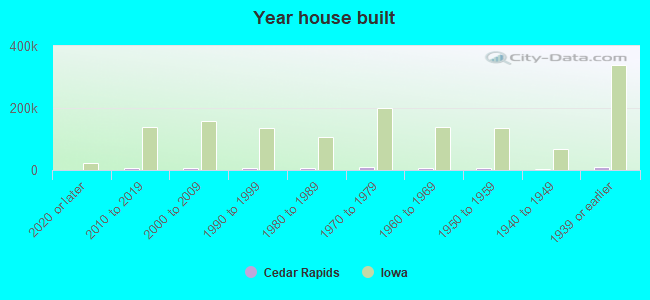
Year house built - Built 2010 or later (%)
Year house built - Built 2000 to 2009 (%)
Year house built - Built 1990 to 1999 (%)
Year house built - Built 1980 to 1989 (%)
Year house built - Built 1970 to 1979 (%)
Year house built - Built 1960 to 1969 (%)
Year house built - Built 1950 to 1959 (%)
Year house built - Built 1940 to 1949 (%)
Year house built - Built 1939 or earlier (%)
Median number of rooms in houses and condos
Median number of rooms in apartments
Median number of bedrooms in owner occupied houses
Mean number of bedrooms in owner occupied houses
Median number of bedrooms in renter occupied houses
Mean number of bedrooms in renter occupied houses
Median number of vehichles in owner occupied houses
Mean number of vehichles in owner occupied houses
Median number of vehichles in renter occupied houses
Mean number of vehichles in renter occupied houses
Rooms in owner-occupied houses - 1 room (%)
Rooms in owner-occupied houses - 2 rooms (%)
Rooms in owner-occupied houses - 3 rooms (%)
Rooms in owner-occupied houses - 4 rooms (%)
Rooms in owner-occupied houses - 5 rooms (%)
Rooms in owner-occupied houses - 6 rooms (%)
Rooms in owner-occupied houses - 7 rooms (%)
Rooms in owner-occupied houses - 8 rooms (%)
Rooms in owner-occupied houses - 9+ rooms (%)
Rooms in renter-occupied houses - 1 room (%)
Rooms in renter-occupied houses - 2 rooms (%)
Rooms in renter-occupied houses - 3 rooms (%)
Rooms in renter-occupied houses - 4 rooms (%)
Rooms in renter-occupied houses - 5 rooms (%)
Rooms in renter-occupied houses - 6 rooms (%)
Rooms in renter-occupied houses - 7 rooms (%)
Rooms in renter-occupied houses - 8 rooms (%)
Rooms in renter-occupied houses - 9+ rooms (%)
Bedrooms in owner-occupied houses - no bedrooms (%)
Bedrooms in owner-occupied houses - 1 bedroom (%)
Bedrooms in owner-occupied houses - 2 bedrooms (%)
Bedrooms in owner-occupied houses - 3 bedrooms (%)
Bedrooms in owner-occupied houses - 4 bedrooms (%)
Bedrooms in owner-occupied houses - 5+ bedrooms (%)
Bedrooms in renter-occupied houses - no bedrooms (%)
Bedrooms in renter-occupied houses - 1 bedroom (%)
Bedrooms in renter-occupied houses - 2 bedrooms (%)
Bedrooms in renter-occupied houses - 3 bedrooms (%)
Bedrooms in renter-occupied houses - 4 bedrooms (%)
Bedrooms in renter-occupied houses - 5+ bedrooms (%)
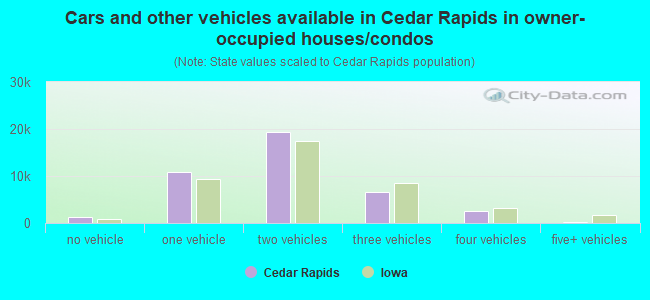
Vehicles available in owner-occupied houses - no vehicle available (%)
Vehicles available in owner-occupied houses - 1 vehicle available(%)
Vehicles available in owner-occupied houses - 2 Vehicles available (%)
Vehicles available in owner-occupied houses - 3 Vehicles available (%)
Vehicles available in owner-occupied houses - 4 Vehicles available (%)
Vehicles available in owner-occupied houses - 5+ Vehicles available (%)
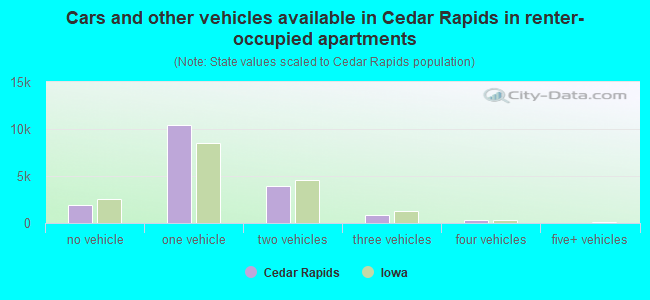
Vehicles available in renter-occupied houses - no vehicle available (%)
Vehicles available in renter-occupied houses - 1 vehicle available (%)
Vehicles available in renter-occupied houses - 2 Vehicles available (%)
Vehicles available in renter-occupied houses - 3 Vehicles available (%)
Vehicles available in renter-occupied houses - 4 Vehicles available (%)
Vehicles available in renter-occupied houses - 5+ Vehicles available (%)
Housing units in structures - 1, detached (%)
Housing units in structures - 1, attached (%)
Housing units in structures - 2 (%)
Housing units in structures - 3 or 4 (%)
Housing units in structures - 5 to 9 (%)
Housing units in structures - 10 to 19 (%)
Housing units in structures - 20 to 49 (%)
Housing units in structures - 50 or more (%)
Housing units in structures - Mobile home (%)
Housing units in structures - Boat, RV, van, etc. (%)
Housing units in structures - Owners - 1, detached (%)
Housing units in structures - Owners - 1, attached (%)
Housing units in structures - Owners - 2 (%)
Housing units in structures - Owners - 3 or 4 (%)
Housing units in structures - Owners - 5 to 9 (%)
Housing units in structures - Owners - 10 to 19 (%)
Housing units in structures - Owners - 20 to 49 (%)
Housing units in structures - Owners - 50 or more (%)
Housing units in structures - Owners - Mobile home (%)
Housing units in structures - Owners - Boat, RV, van, etc. (%)
Housing units in structures - Renters - 1, detached (%)
Housing units in structures - Renters - 1, attached (%)
Housing units in structures - Renters - 2 (%)
Housing units in structures - Renters - 3 or 4 (%)
Housing units in structures - Renters - 5 to 9 (%)
Housing units in structures - Renters - 10 to 19 (%)
Housing units in structures - Renters - 20 to 49 (%)
Housing units in structures - Renters - 50 or more (%)
Housing units in structures - Renters - Mobile home (%)
Housing units in structures - Renters - Boat, RV, van, etc. (%)
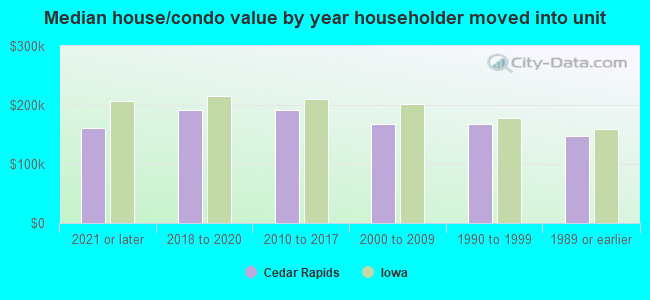
House/condo owner moved in on average (years ago)
Renter moved in on average (years ago)
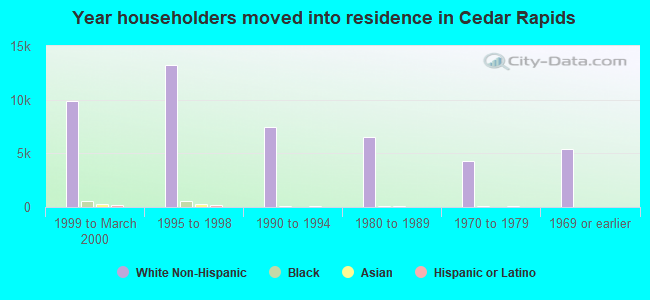
Year householder moved into unit - Moved in 1999 to March 2000 (%)
Year householder moved into unit - Moved in 1999 to March 2000 (%) - White
Year householder moved into unit - Moved in 1999 to March 2000 (%) - Black or African American
Year householder moved into unit - Moved in 1999 to March 2000 (%) - Asian
Year householder moved into unit - Moved in 1999 to March 2000 (%) - Hispanic or Latino
Year householder moved into unit - Moved in 1999 to March 2000 (%) - American Indian and Alaska Native
Year householder moved into unit - Moved in 1999 to March 2000 (%) - Multirace
Year householder moved into unit - Moved in 1999 to March 2000 (%) - Other Race
Year householder moved into unit - Moved in 1995 to 1998 (%)
Year householder moved into unit - Moved in 1995 to 1998 (%) - White
Year householder moved into unit - Moved in 1995 to 1998 (%) - Black or African American
Year householder moved into unit - Moved in 1995 to 1998 (%) - Asian
Year householder moved into unit - Moved in 1995 to 1998 (%) - Hispanic or Latino
Year householder moved into unit - Moved in 1995 to 1998 (%) - American Indian and Alaska Native
Year householder moved into unit - Moved in 1995 to 1998 (%) - Multirace
Year householder moved into unit - Moved in 1995 to 1998 (%) - Other Race
Year householder moved into unit - Moved in 1990 to 1994 (%)
Year householder moved into unit - Moved in 1990 to 1994 (%) - White
Year householder moved into unit - Moved in 1990 to 1994 (%) - Black or African American
Year householder moved into unit - Moved in 1990 to 1994 (%) - Asian
Year householder moved into unit - Moved in 1990 to 1994 (%) - Hispanic or Latino
Year householder moved into unit - Moved in 1990 to 1994 (%) - American Indian and Alaska Native
Year householder moved into unit - Moved in 1990 to 1994 (%) - Multirace
Year householder moved into unit - Moved in 1990 to 1994 (%) - Other Race
Year householder moved into unit - Moved in 1980 to 1989 (%)
Year householder moved into unit - Moved in 1980 to 1989 (%) - White
Year householder moved into unit - Moved in 1980 to 1989 (%) - Black or African American
Year householder moved into unit - Moved in 1980 to 1989 (%) - Asian
Year householder moved into unit - Moved in 1980 to 1989 (%) - Hispanic or Latino
Year householder moved into unit - Moved in 1980 to 1989 (%) - American Indian and Alaska Native
Year householder moved into unit - Moved in 1980 to 1989 (%) - Multirace
Year householder moved into unit - Moved in 1980 to 1989 (%) - Other Race
Year householder moved into unit - Moved in 1970 to 1979 (%)
Year householder moved into unit - Moved in 1970 to 1979 (%) - White
Year householder moved into unit - Moved in 1970 to 1979 (%) - Black or African American
Year householder moved into unit - Moved in 1970 to 1979 (%) - Asian
Year householder moved into unit - Moved in 1970 to 1979 (%) - Hispanic or Latino
Year householder moved into unit - Moved in 1970 to 1979 (%) - American Indian and Alaska Native
Year householder moved into unit - Moved in 1970 to 1979 (%) - Multirace
Year householder moved into unit - Moved in 1970 to 1979 (%) - Other Race
Year householder moved into unit - Moved in 1969 or earlier (%)
Year householder moved into unit - Moved in 1969 or earlier (%) - White
Year householder moved into unit - Moved in 1969 or earlier (%) - Black or African American
Year householder moved into unit - Moved in 1969 or earlier (%) - Asian
Year householder moved into unit - Moved in 1969 or earlier (%) - Hispanic or Latino
Year householder moved into unit - Moved in 1969 or earlier (%) - American Indian and Alaska Native
Year householder moved into unit - Moved in 1969 or earlier (%) - Multirace
Year householder moved into unit - Moved in 1969 or earlier (%) - Other Race
Housing units lacking complete plumbing facilities (%)
Housing units lacking complete kitchen facilities (%)
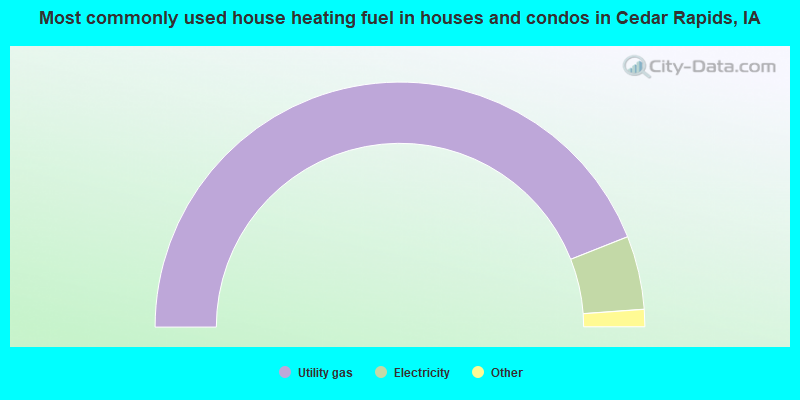
House heating fuel used in houses and condos - Utility gas (%)
House heating fuel used in houses and condos - Bottled, tank, or LP gas (%)
House heating fuel used in houses and condos - Electricity (%)
House heating fuel used in houses and condos - Fuel oil, kerosene, etc. (%)
House heating fuel used in houses and condos - Coal or coke (%)
House heating fuel used in houses and condos - Wood (%)
House heating fuel used in houses and condos - Solar energy (%)
House heating fuel used in houses and condos - Other fuel (%)
House heating fuel used in houses and condos - No fuel used (%)
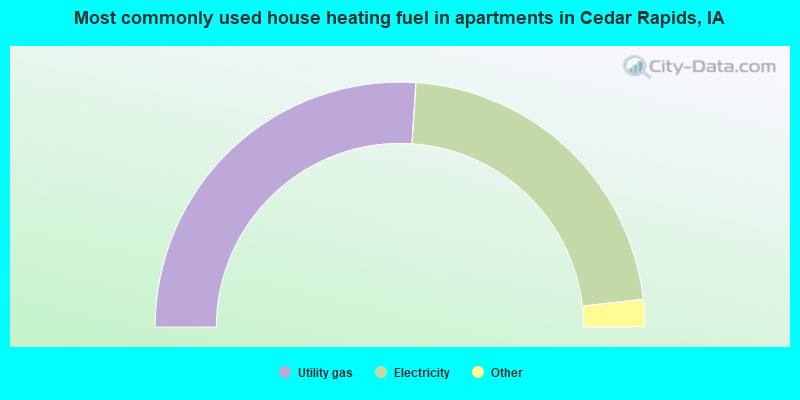
House heating fuel used in apartments - Utility gas (%)
House heating fuel used in apartments - Bottled, tank, or LP gas (%)
House heating fuel used in apartments - Electricity (%)
House heating fuel used in apartments - Fuel oil, kerosene, etc. (%)
House heating fuel used in apartments - Coal or coke (%)
House heating fuel used in apartments - Wood (%)
House heating fuel used in apartments - Solar energy (%)
House heating fuel used in apartments - Other fuel (%)
House heating fuel used in apartments - No fuel used (%)
Median year house/condo built: 1974Median year apartment built: 1979Household type by relationship:
Households: 136,438
Male householders: 27,969 (9,447 living alone ), Female householders: 30,313 (10,929 living alone )23,548 spouses (23,495 opposite-sex spouses ), 5,827 unmarried partners , (5,621 opposite-sex unmarried partners ), 35,914 children (34,156 natural , 744 adopted , 1,014 stepchildren ), 1,043 grandchildren , 1,130 brothers or sisters , 963 parents , 68 foster children , 1,780 other relatives , 4,588 non-relatives In group quarters: 3,295
Size of family households: 16,933 2-persons , 6,407 3-persons , 4,453 4-persons , 2,770 5-persons , 646 6-persons , 797 7-or-more-persons .
Size of nonfamily households: 20,376 1-person , 5,352 2-persons , 452 3-persons , 49 4-persons , 47 5-persons .
16,634 married couples with children. single-parent households (2,003 men , 6,617 women ).
91.0% of residents of Cedar Rapids speak English at home. of residents speak Spanish at home (74% speak English very well , 18% speak English well , 6% speak English not well , 1% don't speak English at all ).of residents speak other Indo-European language at home (47% speak English very well , 34% speak English well , 16% speak English not well , 2% don't speak English at all ).of residents speak Asian or Pacific Island language at home (54% speak English very well , 27% speak English well , 14% speak English not well , 4% don't speak English at all ).of residents speak other language at home (62% speak English very well , 18% speak English well , 14% speak English not well , 6% don't speak English at all ).
Foreign born population: 7,605 (5.6%)of them are naturalized citizens )
Median number of rooms in houses and condos:
Median number of rooms in apartments
Owner-occupied Renter-occupied
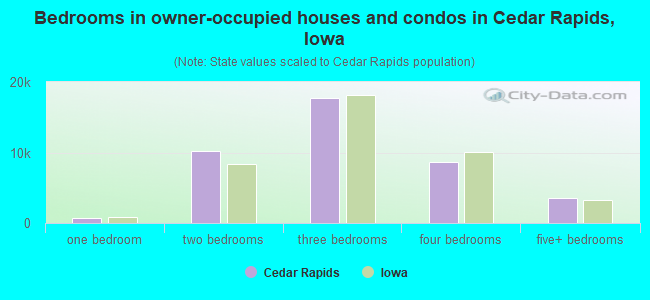
Bedrooms in owner-occupied houses and condos in Cedar Rapids, Iowa
41 no bedroom 716 1 bedroom 10,158 2 bedrooms 17,765 3 bedrooms 8,694 4 bedrooms 3,533 5+ bedrooms
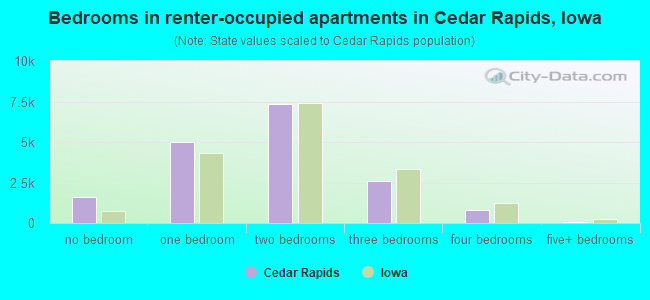
Bedrooms in renter-occupied apartments in Cedar Rapids, Iowa
1,581 no bedroom 5,015 1 bedroom 7,315 2 bedrooms 2,602 3 bedrooms 802 4 bedrooms 60 5+ bedrooms
Owner-occupied Renter-occupied
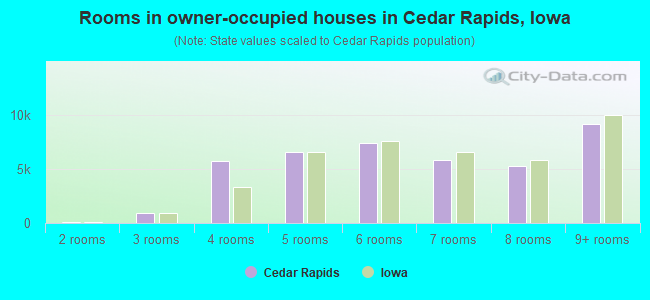
Rooms in owner-occupied houses in Cedar Rapids, Iowa
41 1 room 103 2 rooms 924 3 rooms 5,739 4 rooms 6,572 5 rooms 7,360 6 rooms 5,841 7 rooms 5,233 8 rooms 9,094 9+ rooms
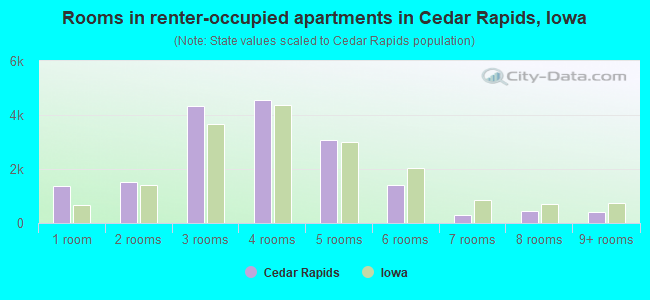
Rooms in renter-occupied apartments in Cedar Rapids, Iowa
1,358 1 room 1,533 2 rooms 4,341 3 rooms 4,549 4 rooms 3,069 5 rooms 1,395 6 rooms 283 7 rooms 426 8 rooms 421 9+ rooms
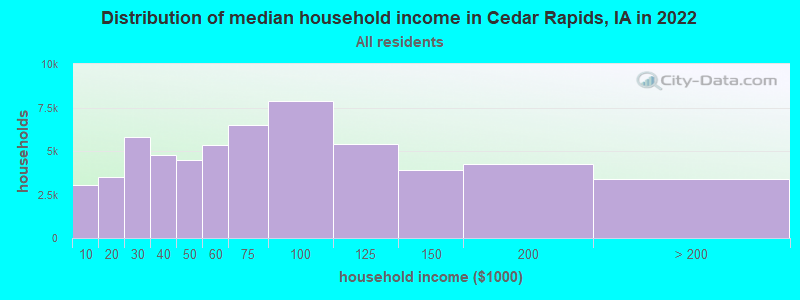
Cedar Rapids, IA household income distribution 3,059 Less than $10,0003,524 $10,000 to $19,9995,787 $20,000 to $29,9994,796 $30,000 to $39,9994,498 $40,000 to $49,9995,327 $50,000 to $59,9996,474 $60,000 to $74,9997,856 $75,000 to $99,9995,376 $100,000 to $124,9993,926 $125,000 to $149,9994,243 $150,000 to $199,9993,416 $200,000 or more
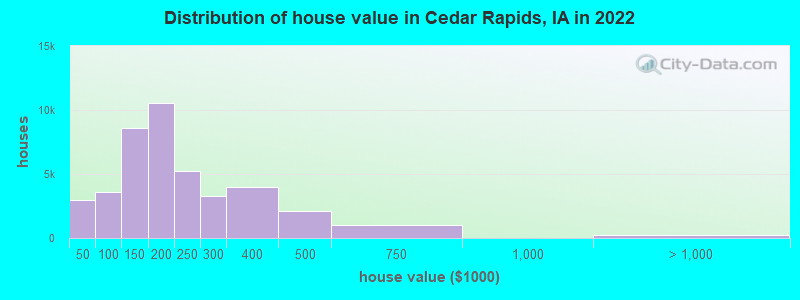
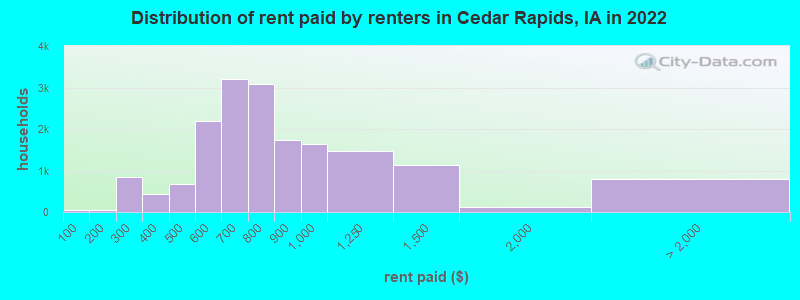
Home value of owner - occupied houses in 2022 in Cedar Rapids, IA 438 Less than $10,0001,068 $10,000 to $14,999153 $15,000 to $19,999232 $20,000 to $24,99971 $25,000 to $29,999318 $35,000 to $39,999718 $40,000 to $49,999271 $50,000 to $59,999415 $60,000 to $69,999258 $70,000 to $79,999786 $80,000 to $89,9991,182 $90,000 to $99,9993,959 $100,000 to $124,9994,602 $125,000 to $149,9996,447 $150,000 to $174,9994,123 $175,000 to $199,9995,273 $200,000 to $249,9993,299 $250,000 to $299,9993,972 $300,000 to $399,9992,095 $400,000 to $499,9991,013 $500,000 to $749,999134 $1,000,000 to $1,499,99980 $2,000,000 or moreRent paid by renters in 2022 in Cedar Rapids, IA 45 Less than $10049 $150 to $199682 $200 to $249169 $250 to $299126 $300 to $349296 $350 to $399491 $400 to $449175 $450 to $4991,001 $500 to $5491,195 $550 to $5991,846 $600 to $6491,358 $650 to $6991,171 $700 to $7491,907 $750 to $7991,731 $800 to $8991,632 $900 to $9991,471 $1,000 to $1,2491,128 $1,250 to $1,499112 $1,500 to $1,99942 $2,000 to $2,49943 $3,000 to $3,499327 $3,500 or more378 No cash rent
Percentage of workers working in this county: 89.7%Number of people working at home: 9,196 (12.5% of all workers )
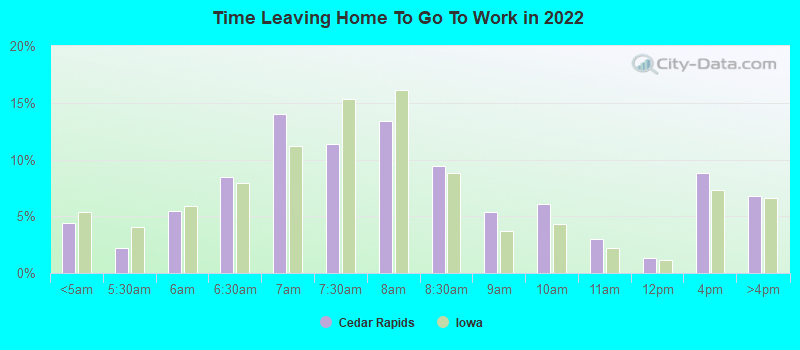
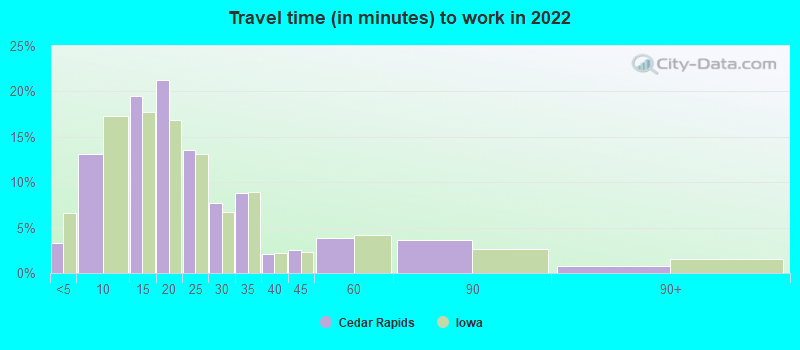
Travel time to work (commute)
Less than 5 minutes: 2,6495 to 9 minutes: 9,68410 to 14 minutes: 16,33415 to 19 minutes: 13,71020 to 24 minutes: 7,67725 to 29 minutes: 3,79230 to 34 minutes: 3,72835 to 39 minutes: 74640 to 44 minutes: 67145 to 59 minutes: 1,37660 to 89 minutes: 2,34190 or more minutes: 495
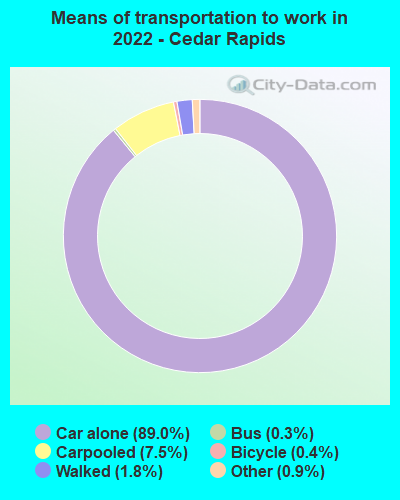
Means of transportation to work:
Drove a car alone: 77,297 (79.2%)Carpooled: 6,319 (6.5%)Bus : 238 (0.2%)Ferryboat: 26 (0.0%)Taxi: 611 (0.6%)Bicycle: 389 (0.4%)Walked: 1,686 (1.7%)Worked at home: 10,297 (10.5%)
Unemployment by race in 2022
Unemployment rate for White non-Hispanic residents 2.7% Males3.0% FemalesUnemployment rate for Black residents 10.0% Males3.5% FemalesUnemployment rate for Asian residents 1.8% Males0.2% FemalesUnemployment rate for other race residents 2.3% MalesUnemployment rate for two or more race residents 1.6% Males5.7% FemalesUnemployment rate for Hispanic or Latino residents 2.5% Males4.8% Females
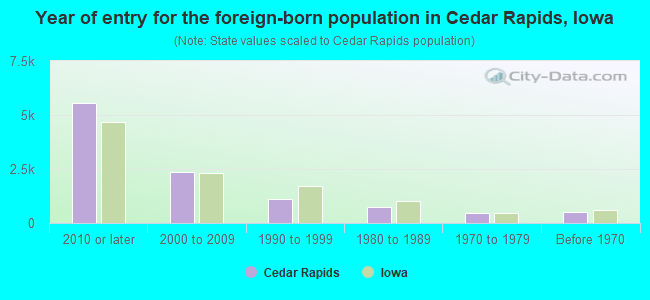
Year of entry for the foreign-born population in Cedar Rapids, Iowa
5,557 2010 or later 2,342 2000 to 2009 1,131 1990 to 1999 731 1980 to 1989 483 1970 to 1979 520 Before 1970
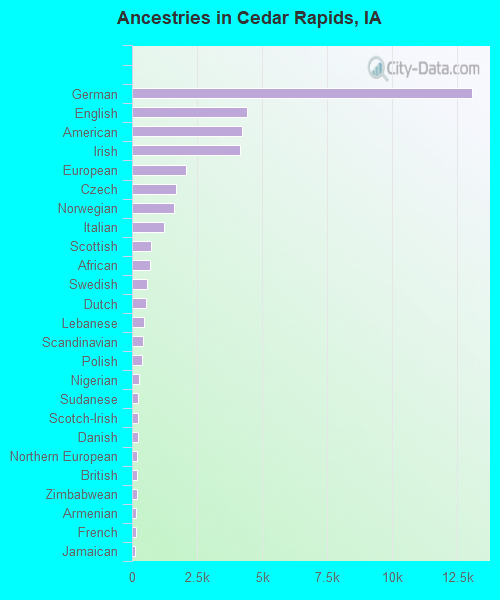
First ancestries reported:
German: 13,063 (23.0%)
English: 4,414 (7.8%)
American: 4,242 (7.5%)
Irish: 4,162 (7.3%)
European: 2,076 (3.7%)
Czech: 1,709 (3.0%)
Norwegian: 1,631 (2.9%)
Italian: 1,246 (2.2%)
Scottish: 725 (1.3%)
African: 682 (1.2%)
Swedish: 566 (1.0%)
Dutch: 535 (0.9%)
Lebanese: 460 (0.8%)
Scandinavian: 436 (0.8%)
Polish: 372 (0.7%)
Nigerian: 252 (0.4%)
Sudanese: 245 (0.4%)
Scotch-Irish: 242 (0.4%)
Danish: 224 (0.4%)
Northern European: 209 (0.4%)
British: 206 (0.4%)
Zimbabwean: 205 (0.4%)
Armenian: 170 (0.3%)
French: 142 (0.3%)
Jamaican: 127 (0.2%)
Eastern European: 107 (0.2%)
South African: 106 (0.2%)
Canadian: 102 (0.2%)
Ghanaian: 85 (0.1%)
Czechoslovakian: 81 (0.1%)
Haitian: 72 (0.1%)
Moroccan: 71 (0.1%)
Ukrainian: 60 (0.1%)
Greek: 59 (0.1%)
Welsh: 58 (0.1%)
Belgian: 52 (0.09%)
Turkish: 48 (0.08%)
Russian: 47 (0.08%)
Arab: 45 (0.08%)
French Canadian: 45 (0.08%)
Maltese: 43 (0.08%)
Albanian: 40 (0.07%)
Luxembourger: 38 (0.07%)
Austrian: 36 (0.06%)
Hungarian: 34 (0.06%)
Yugoslavian: 32 (0.06%)
Portuguese: 32 (0.06%)
Swiss: 31 (0.05%)
Slovene: 30 (0.05%)
Liberian: 26 (0.05%)
Celtic: 20 (0.04%)
Egyptian: 19 (0.03%)
Finnish: 17 (0.03%)
Estonian: 15 (0.03%)
Kenyan: 15 (0.03%)
Brazilian: 11 (0.02%)
Lithuanian: 9 (0.02%)
Romanian: 8 (0.01%)
Iranian: 8 (0.01%)
Slovak: 7 (0.01%)
Pennsylvania German: 6 (0.01%)
Most common places of birth for foreign-born residents (%): India Cedar Rapids:
15.2% (1,437)Iowa:
6.2% (11,148)
Mexico Cedar Rapids:
7.4% (702)Iowa:
23.3% (41,625)
Democratic Republic of Congo (Zaire) Cedar Rapids:
7.2% (680)Iowa:
2.1% (3,735)
Other Eastern Africa Cedar Rapids:
4.1% (386)Iowa:
1.4% (2,422)
Lebanon Cedar Rapids:
3.8% (359)Iowa:
0.4% (713)
Vietnam Cedar Rapids:
3.6% (340)Iowa:
4.2% (7,428)
Nigeria Cedar Rapids:
3.2% (307)Iowa:
0.7% (1,204)
Sudan Cedar Rapids:
3.2% (304)Iowa:
2.3% (4,084)
Liberia Cedar Rapids:
2.5% (240)Iowa:
1.7% (2,949)
Ivory Coast Cedar Rapids:
2.5% (240)Iowa:
0.2% (352)
Bhutan Cedar Rapids:
2.5% (235)Iowa:
0.8% (1,488)
China, excluding Hong Kong and Taiwan Cedar Rapids:
2.1% (201)Iowa:
4.6% (8,194)
Micronesia Cedar Rapids:
2.1% (198)Iowa:
0.7% (1,305)
Other Western Africa Cedar Rapids:
2.0% (190)Iowa:
0.4% (631)
Guatemala Cedar Rapids:
2.0% (187)Iowa:
3.2% (5,672)
Canada Cedar Rapids:
2.0% (186)Iowa:
1.6% (2,873)
Burma (Myanmar) Cedar Rapids:
1.7% (160)Iowa:
2.5% (4,514)
Togo Cedar Rapids:
1.6% (155)Iowa:
0.4% (798)
Germany Cedar Rapids:
1.6% (147)Iowa:
1.4% (2,525)
Place of birth for U.S.-born residents:
This state: 95,250Other state: 32,240Northeast: 2,561Midwest: 17,123South: 5,895West: 6,661 85.9% of Cedar Rapids residents lived in the same house 1 years ago.
Out of people who lived in different houses, 33.9% lived in this county.
Out of people who lived in different counties, 74.1% lived in Iowa.
Cedar Rapids:
85.9%State average:
87.2%
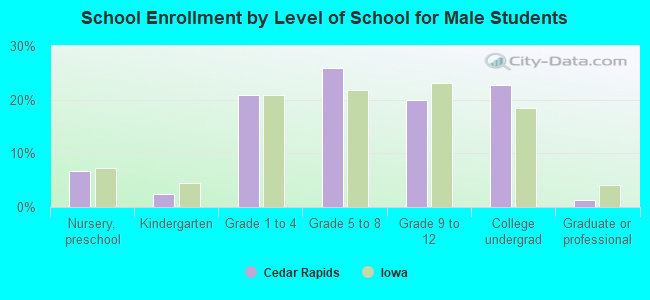
Education attainment for males 25 years and older:
No schooling: 208Nursery to 4th grade: 825th and 6th grade: 707th and 8th grade: 539th grade: 2510th grade: 71111th grade: 43012th grade, no diploma: 842High school graduate (or equivalency): 12,318Less than 1 year of college: 3,363Some college more than 1 year, no degree: 7,176Associate degree: 4,897Bachelor's degree: 9,448Master's degree: 4,238Professional school degree: 850Doctorate degree: 622
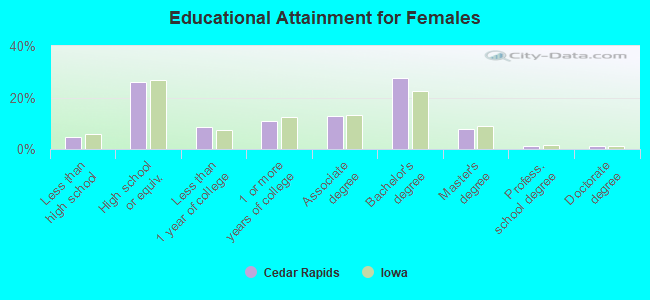
Education attainment for females 25 years and older:
No schooling: 275Nursery to 4th grade: 535th and 6th grade: 277th and 8th grade: 09th grade: 4710th grade: 52311th grade: 1,02012th grade, no diploma: 265High school graduate (or equivalency): 12,479Less than 1 year of college: 4,093Some college more than 1 year, no degree: 5,201Associate degree: 6,105Bachelor's degree: 13,239Master's degree: 3,811Professional school degree: 486Doctorate degree: 533
Housing units in structures:
One, detached: 38,294One, attached: 3,374Two: 3553 or 4: 2,3565 to 9: 4,41610 to 19: 5,59220 to 49: 3,75750 or more: 2,057Mobile homes: 2,880Median worth of mobile homes: $38,300
Housing units lacking complete plumbing facilities in 2022: 0.1%Housing units lacking complete kitchen facilities in 2022: 1.1%House/condo owner moved in on average 10 years ago
Renter moved in on average 2 years ago
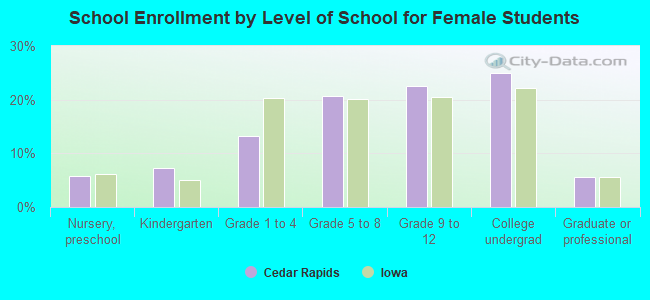
Private vs. public school enrollment:
Students in private schools in grades 1 to 8 (elementary and middle school): 1,940 Students in private schools in grades 9 to 12 (high school): 308 Students in private undergraduate colleges: 2,602