Races in Cedar Rapids, Iowa (IA) Detailed Stats
Data:
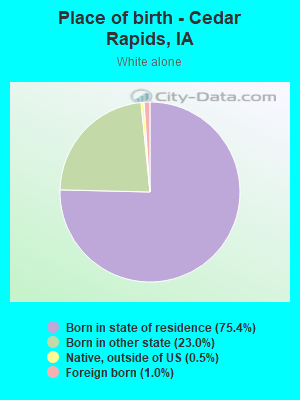
Races - White alone (%)
Races - White alone (% change since 2000)
Races - Black alone (%)
Races - Black alone (% change since 2000)
Races - American Indian alone (%)
Races - American Indian alone (% change since 2000)
Races - Asian alone (%)
Races - Asian alone (% change since 2000)
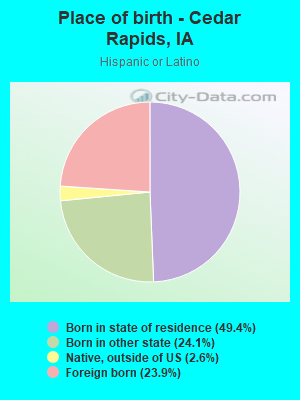
Races - Hispanic (%)
Races - Hispanic (% change since 2000)
Races - Native Hawaiian and Other Pacific Islander alone (%)
Races - Native Hawaiian and Other Pacific Islander alone (% change since 2000)
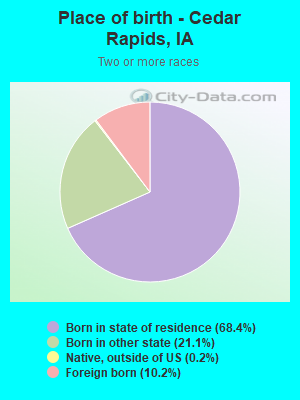
Races - Two or more races(%)
Races - Two or more races(% change since 2000)
Races - Other race alone (%)
Races - Other race alone (% change since 2000)
Racial diversity
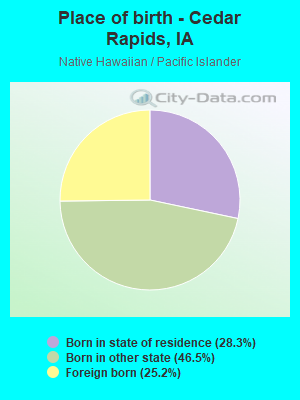
Place of birth - Born in state of residence (%)
Place of birth - Born in state of residence (%) - White
Place of birth - Born in state of residence (%) - Black or African American
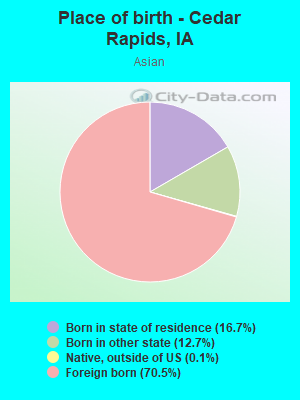
Place of birth - Born in state of residence (%) - Asian
Place of birth - Born in state of residence (%) - Hispanic or Latino
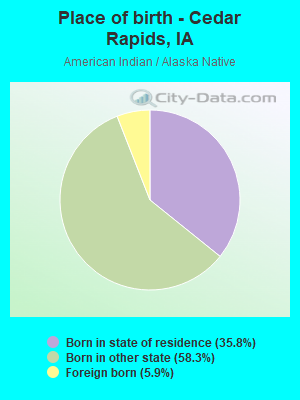
Place of birth - Born in state of residence (%) - American Indian and Alaska Native
Place of birth - Born in state of residence (%) - Multirace
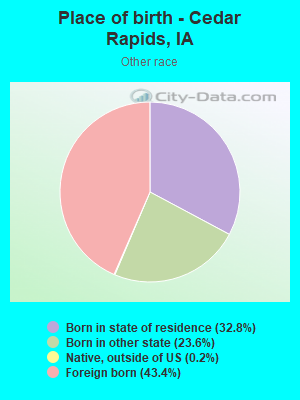
Place of birth - Born in state of residence (%) - Other Race
Place of birth - Born in other state (%)
Place of birth - Born in other state (%) - White
Place of birth - Born in other state (%) - Black or African American
Place of birth - Born in other state (%) - Asian
Place of birth - Born in other state (%) - Hispanic or Latino
Place of birth - Born in other state (%) - American Indian and Alaska Native
Place of birth - Born in other state (%) - Multirace
Place of birth - Born in other state (%) - Other Race
Place of birth - Native, outside of US (%)
Place of birth - Native, outside of US (%) - White
Place of birth - Native, outside of US (%) - Black or African American
Place of birth - Native, outside of US (%) - Asian
Place of birth - Native, outside of US (%) - Hispanic or Latino
Place of birth - Native, outside of US (%) - American Indian and Alaska Native
Place of birth - Native, outside of US (%) - Multirace
Place of birth - Native, outside of US (%) - Other Race
Place of birth - Foreign born (%)
Place of birth - Foreign born (%) - White
Place of birth - Foreign born (%) - Black or African American
Place of birth - Foreign born (%) - Asian
Place of birth - Foreign born (%) - Hispanic or Latino
Place of birth - Foreign born (%) - American Indian and Alaska Native
Place of birth - Foreign born (%) - Multirace
Place of birth - Foreign born (%) - Other Race
Residents speaking English at home (%)
Residents speaking English at home - Born in the United States (%)
Residents speaking English at home - Native, born elsewhere (%)
Residents speaking English at home - Foreign born (%)
Residents speaking Spanish at home (%)
Residents speaking Spanish at home - Born in the United States (%)
Residents speaking Spanish at home - Native, born elsewhere (%)
Residents speaking Spanish at home - Foreign born (%)
Residents speaking other language at home (%)
Residents speaking other language at home - Born in the United States (%)
Residents speaking other language at home - Native, born elsewhere (%)
Residents speaking other language at home - Foreign born (%)
Marital status - Never married (%)
Marital status - Now married (%)
Marital status - Separated (%)
Marital status - Widowed (%)
Marital status - Divorced (%)
Ancestries Reported - Arab (%)
Ancestries Reported - Czech (%)
Ancestries Reported - Danish (%)
Ancestries Reported - Dutch (%)
Ancestries Reported - English (%)
Ancestries Reported - French (%)
Ancestries Reported - French Canadian (%)
Ancestries Reported - German (%)
Ancestries Reported - Greek (%)
Ancestries Reported - Hungarian (%)
Ancestries Reported - Irish (%)
Ancestries Reported - Italian (%)
Ancestries Reported - Lithuanian (%)
Ancestries Reported - Norwegian (%)
Ancestries Reported - Polish (%)
Ancestries Reported - Portuguese (%)
Ancestries Reported - Russian (%)
Ancestries Reported - Scotch-Irish (%)
Ancestries Reported - Scottish (%)
Ancestries Reported - Slovak (%)
Ancestries Reported - Subsaharan African (%)
Ancestries Reported - Swedish (%)
Ancestries Reported - Swiss (%)
Ancestries Reported - Ukrainian (%)
Ancestries Reported - United States (%)
Ancestries Reported - Welsh (%)
Ancestries Reported - West Indian (%)
Ancestries Reported - Other (%)
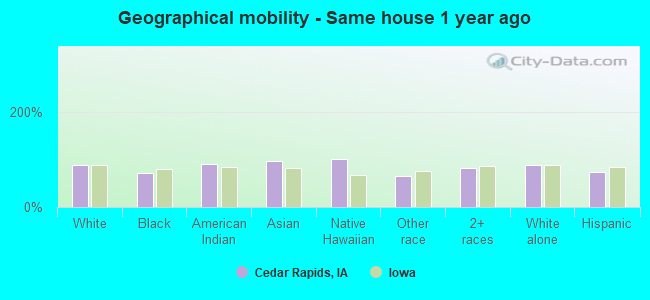
Geographical mobility - Same house 1 year ago (%)
Geographical mobility - Same house 1 year ago (%) - White
Geographical mobility - Same house 1 year ago (%) - Black or African American
Geographical mobility - Same house 1 year ago (%) - Asian
Geographical mobility - Same house 1 year ago (%) - Hispanic or Latino
Geographical mobility - Same house 1 year ago (%) - American Indian and Alaska Native
Geographical mobility - Same house 1 year ago (%) - Multirace
Geographical mobility - Same house 1 year ago (%) - Other Race
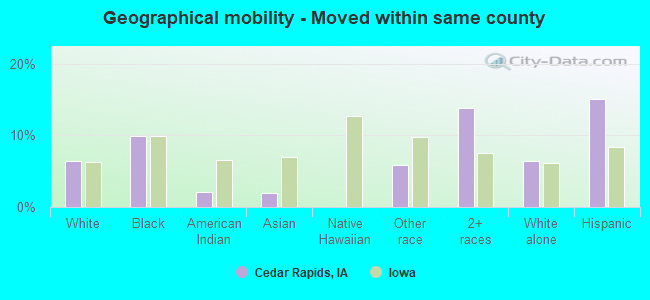
Geographical mobility - Moved within same county (%)
Geographical mobility - Moved within same county (%) - White
Geographical mobility - Moved within same county (%) - Black or African American
Geographical mobility - Moved within same county (%) - Asian
Geographical mobility - Moved within same county (%) - Hispanic or Latino
Geographical mobility - Moved within same county (%) - American Indian and Alaska Native
Geographical mobility - Moved within same county (%) - Multirace
Geographical mobility - Moved within same county (%) - Other Race
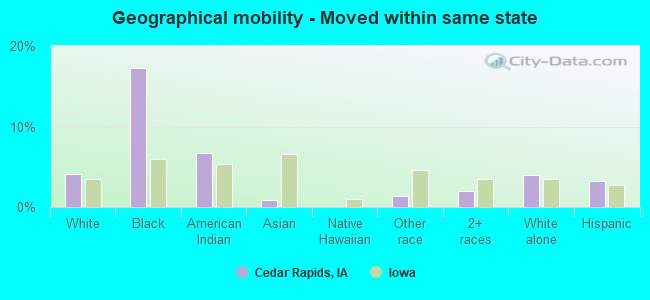
Geographical mobility - Moved from different county within same state (%)
Geographical mobility - Moved from different county within same state (%) - White
Geographical mobility - Moved from different county within same state (%) - Black or African American
Geographical mobility - Moved from different county within same state (%) - Asian
Geographical mobility - Moved from different county within same state (%) - Hispanic or Latino
Geographical mobility - Moved from different county within same state (%) - American Indian and Alaska Native
Geographical mobility - Moved from different county within same state (%) - Multirace
Geographical mobility - Moved from different county within same state (%) - Other Race
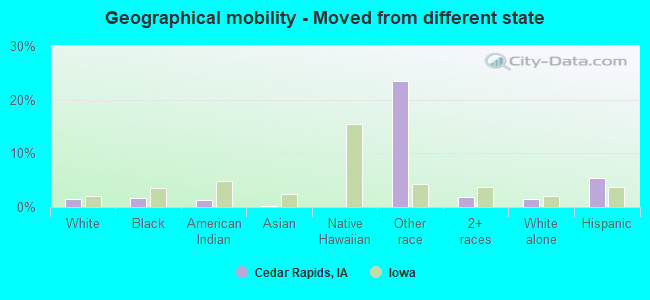
Geographical mobility - Moved from different state (%)
Geographical mobility - Moved from different state (%) - White
Geographical mobility - Moved from different state (%) - Black or African American
Geographical mobility - Moved from different state (%) - Asian
Geographical mobility - Moved from different state (%) - Hispanic or Latino
Geographical mobility - Moved from different state (%) - American Indian and Alaska Native
Geographical mobility - Moved from different state (%) - Multirace
Geographical mobility - Moved from different state (%) - Other Race
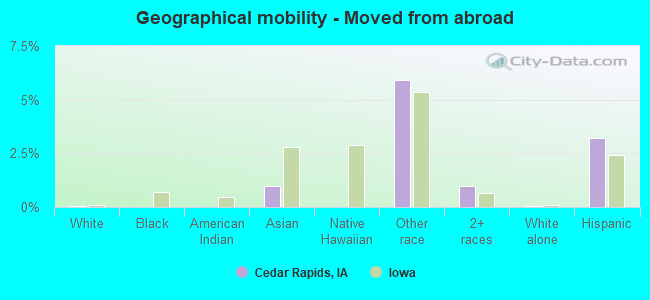
Geographical mobility - Moved from abroad (%)
Geographical mobility - Moved from abroad (%) - White
Geographical mobility - Moved from abroad (%) - Black or African American
Geographical mobility - Moved from abroad (%) - Asian
Geographical mobility - Moved from abroad (%) - Hispanic or Latino
Geographical mobility - Moved from abroad (%) - American Indian and Alaska Native
Geographical mobility - Moved from abroad (%) - Multirace
Geographical mobility - Moved from abroad (%) - Other Race
Place of birth for the foreign-born population - Ireland (%)
Place of birth for the foreign-born population - Denmark (%)
Place of birth for the foreign-born population - Norway (%)
Place of birth for the foreign-born population - Sweden (%)
Place of birth for the foreign-born population - United Kingdom (%)
Place of birth for the foreign-born population - England (%)
Place of birth for the foreign-born population - Scotland (%)
Place of birth for the foreign-born population - Other Northern Europe (%)
Place of birth for the foreign-born population - Austria (%)
Place of birth for the foreign-born population - Belgium (%)
Place of birth for the foreign-born population - France (%)
Place of birth for the foreign-born population - Germany (%)
Place of birth for the foreign-born population - Netherlands (%)
Place of birth for the foreign-born population - Switzerland (%)
Place of birth for the foreign-born population - Other Western Europe (%)
Place of birth for the foreign-born population - Greece (%)
Place of birth for the foreign-born population - Italy (%)
Place of birth for the foreign-born population - Portugal (%)
Place of birth for the foreign-born population - Spain (%)
Place of birth for the foreign-born population - Other Southern Europe (%)
Place of birth for the foreign-born population - Albania (%)
Place of birth for the foreign-born population - Belarus (%)
Place of birth for the foreign-born population - Bosnia and Herzegovina (%)
Place of birth for the foreign-born population - Bulgaria (%)
Place of birth for the foreign-born population - Croatia (%)
Place of birth for the foreign-born population - Czechoslovakia (%)
Place of birth for the foreign-born population - Hungary (%)
Place of birth for the foreign-born population - Latvia (%)
Place of birth for the foreign-born population - Lithuania (%)
Place of birth for the foreign-born population - North Macedonia (Macedonia) (%)
Place of birth for the foreign-born population - Moldova (%)
Place of birth for the foreign-born population - Poland (%)
Place of birth for the foreign-born population - Romania (%)
Place of birth for the foreign-born population - Russia (%)
Place of birth for the foreign-born population - Serbia (%)
Place of birth for the foreign-born population - Ukraine (%)
Place of birth for the foreign-born population - Other Eastern Europe (%)
Place of birth for the foreign-born population - China (%)
Place of birth for the foreign-born population - Hong Kong (%)
Place of birth for the foreign-born population - Taiwan (%)
Place of birth for the foreign-born population - Japan (%)
Place of birth for the foreign-born population - Korea (%)
Place of birth for the foreign-born population - Other Eastern Asia (%)
Place of birth for the foreign-born population - Afghanistan (%)
Place of birth for the foreign-born population - Bangladesh (%)
Place of birth for the foreign-born population - India (%)
Place of birth for the foreign-born population - Iran (%)
Place of birth for the foreign-born population - Kazakhstan (%)
Place of birth for the foreign-born population - Nepal (%)
Place of birth for the foreign-born population - Pakistan (%)
Place of birth for the foreign-born population - Sri Lanka (%)
Place of birth for the foreign-born population - Uzbekistan (%)
Place of birth for the foreign-born population - Other South Central Asia (%)
Place of birth for the foreign-born population - Burma (%)
Place of birth for the foreign-born population - Cambodia (%)
Place of birth for the foreign-born population - Indonesia (%)
Place of birth for the foreign-born population - Laos (%)
Place of birth for the foreign-born population - Malaysia (%)
Place of birth for the foreign-born population - Philippines (%)
Place of birth for the foreign-born population - Singapore (%)
Place of birth for the foreign-born population - Thailand (%)
Place of birth for the foreign-born population - Vietnam (%)
Place of birth for the foreign-born population - Other South Eastern Asia (%)
Place of birth for the foreign-born population - Armenia (%)
Place of birth for the foreign-born population - Iraq (%)
Place of birth for the foreign-born population - Israel (%)
Place of birth for the foreign-born population - Jordan (%)
Place of birth for the foreign-born population - Kuwait (%)
Place of birth for the foreign-born population - Lebanon (%)
Place of birth for the foreign-born population - Saudi Arabia (%)
Place of birth for the foreign-born population - Syria (%)
Place of birth for the foreign-born population - Turkey (%)
Place of birth for the foreign-born population - Yemen (%)
Place of birth for the foreign-born population - Other Western Asia (%)
Place of birth for the foreign-born population - Eritrea (%)
Place of birth for the foreign-born population - Ethiopia (%)
Place of birth for the foreign-born population - Kenya (%)
Place of birth for the foreign-born population - Somalia (%)
Place of birth for the foreign-born population - Uganda (%)
Place of birth for the foreign-born population - Zimbabwe (%)
Place of birth for the foreign-born population - Other Eastern Africa (%)
Place of birth for the foreign-born population - Cameroon (%)
Place of birth for the foreign-born population - Congo (%)
Place of birth for the foreign-born population - Democratic Republic of Congo (Zaire) (%)
Place of birth for the foreign-born population - Other Middle Africa (%)
Place of birth for the foreign-born population - Egypt (%)
Place of birth for the foreign-born population - Morocco (%)
Place of birth for the foreign-born population - Sudan (%)
Place of birth for the foreign-born population - Other Northern Africa (%)
Place of birth for the foreign-born population - South Africa (%)
Place of birth for the foreign-born population - Other Southern Africa (%)
Place of birth for the foreign-born population - Cabo Verde (%)
Place of birth for the foreign-born population - Ghana (%)
Place of birth for the foreign-born population - Liberia (%)
Place of birth for the foreign-born population - Nigeria (%)
Place of birth for the foreign-born population - Senegal (%)
Place of birth for the foreign-born population - Sierra Leone (%)
Place of birth for the foreign-born population - Other Western Africa (%)
Place of birth for the foreign-born population - Australia (%)
Place of birth for the foreign-born population - New Zealand (%)
Place of birth for the foreign-born population - Fiji (%)
Place of birth for the foreign-born population - Micronesia (%)
Place of birth for the foreign-born population - Bahamas (%)
Place of birth for the foreign-born population - Barbados (%)
Place of birth for the foreign-born population - Cuba (%)
Place of birth for the foreign-born population - Dominica (%)
Place of birth for the foreign-born population - Dominican Republic (%)
Place of birth for the foreign-born population - Grenada (%)
Place of birth for the foreign-born population - Haiti (%)
Place of birth for the foreign-born population - Jamaica (%)
Place of birth for the foreign-born population - St. Vincent and the Grenadines (%)
Place of birth for the foreign-born population - Trinidad and Tobago (%)
Place of birth for the foreign-born population - West Indies (%)
Place of birth for the foreign-born population - Other Caribbean (%)
Place of birth for the foreign-born population - Belize (%)
Place of birth for the foreign-born population - Costa Rica (%)
Place of birth for the foreign-born population - El Salvador (%)
Place of birth for the foreign-born population - Guatemala (%)
Place of birth for the foreign-born population - Honduras (%)
Place of birth for the foreign-born population - Mexico (%)
Place of birth for the foreign-born population - Nicaragua (%)
Place of birth for the foreign-born population - Panama (%)
Place of birth for the foreign-born population - Other Central America (%)
Place of birth for the foreign-born population - Argentina (%)
Place of birth for the foreign-born population - Bolivia (%)
Place of birth for the foreign-born population - Brazil (%)
Place of birth for the foreign-born population - Chile (%)
Place of birth for the foreign-born population - Colombia (%)
Place of birth for the foreign-born population - Ecuador (%)
Place of birth for the foreign-born population - Guyana (%)
Place of birth for the foreign-born population - Peru (%)
Place of birth for the foreign-born population - Uruguay (%)
Place of birth for the foreign-born population - Venezuela (%)
Place of birth for the foreign-born population - Other South America (%)
Place of birth for the foreign-born population - Canada (%)
Place of birth for the foreign-born population - Other Northern America (%)
Place of birth for the foreign-born population - Other (%)
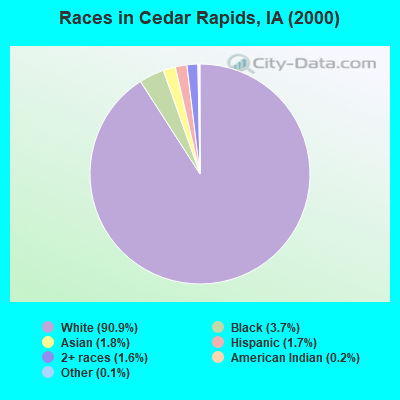
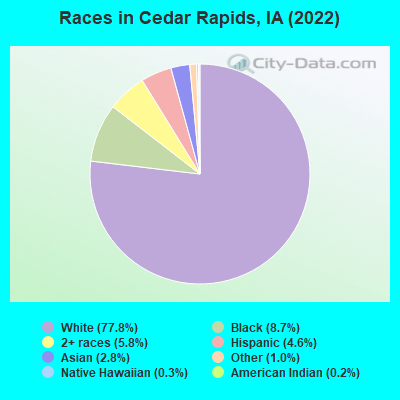
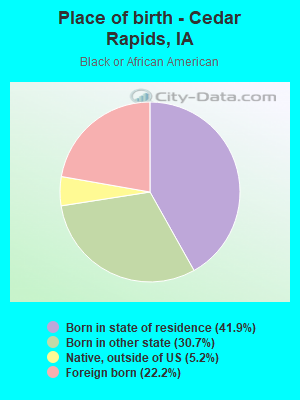
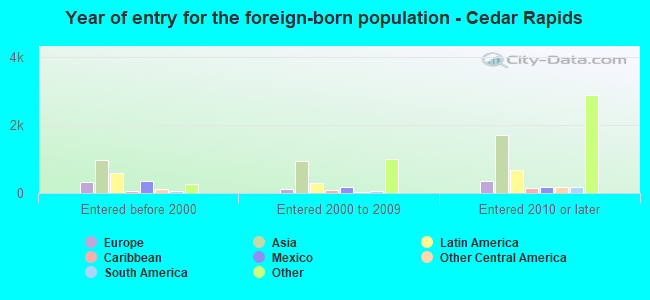
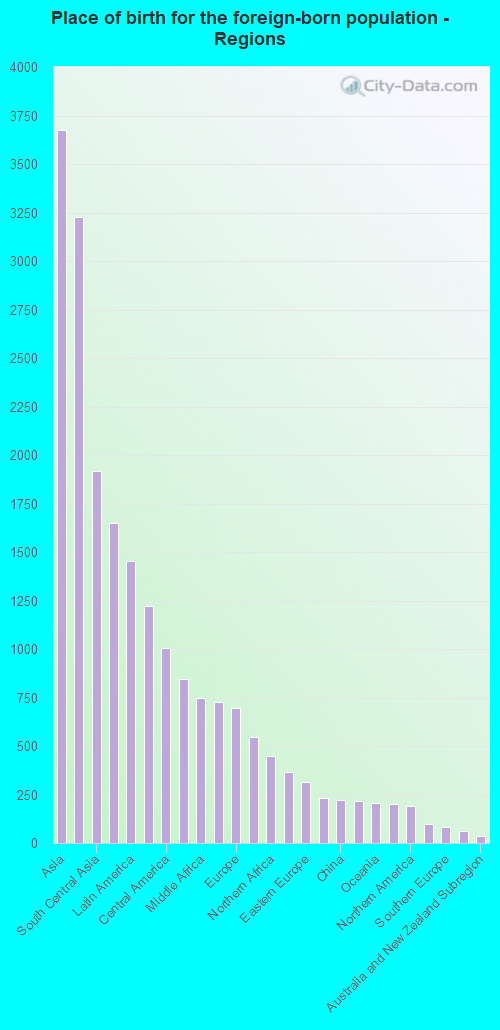
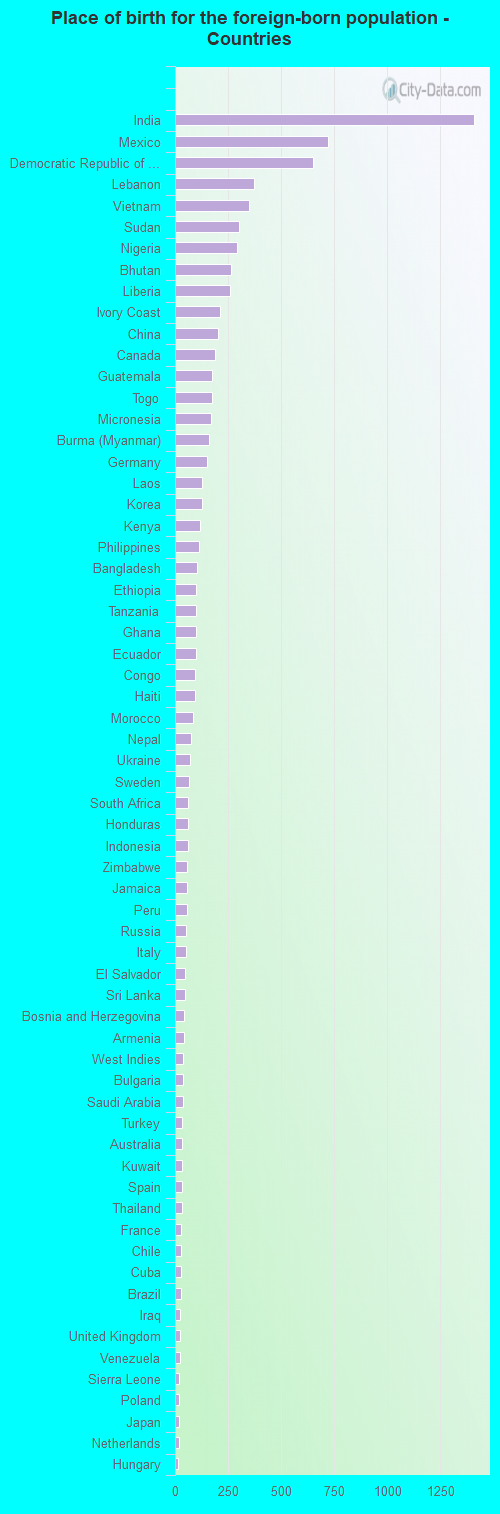
According to 2022 data, the most numerous races in Cedar Rapids, IA are White alone (106,403 residents), Hispanic (6,239 residents), and Black alone (11,884 residents). 91.8% of Cedar Rapids residents speak English at home. 6.9% of Cedar Rapids, IA residents are foreign-born (2.6% born in Asia, 2.3% born in Africa, 1.0% born in Latin America), which is 27.6% greater than the foreign-born rate of 5.0% across the entire state of Iowa.
Race distribution in Cedar Rapids
2000 2022
109,759 90.9% White alone 4,425 3.7% Black alone 2,121 1.8% Asian alone 2,065 1.7% Hispanic 1,887 1.6% Two or more races 279 0.2% American Indian alone 145 0.1% Other race alone 77 0.06% Native Hawaiian and Other
106,403 77.8% White alone 11,884 8.7% Black alone 7,941 5.8% Two or more races 6,239 4.6% Hispanic 3,885 2.8% Asian alone 1,381 1.0% Other race alone 383 0.3% Native Hawaiian and Other 272 0.2% American Indian alone
2000 2022
2,710,344 92.6% White alone 82,473 2.8% Hispanic 60,744 2.1% Black alone 36,345 1.2% Asian alone 25,472 0.9% Two or more races 7,955 0.3% American Indian alone 2,103 0.07% Other race alone 888 0.03% Native Hawaiian and Other
2,650,110 82.8% White alone 218,024 6.8% Hispanic 119,004 3.7% Black alone 115,286 3.6% Two or more races 74,892 2.3% Asian alone 9,260 0.3% Other race alone 8,595 0.3% Native Hawaiian and Other 5,346 0.2% American Indian alone
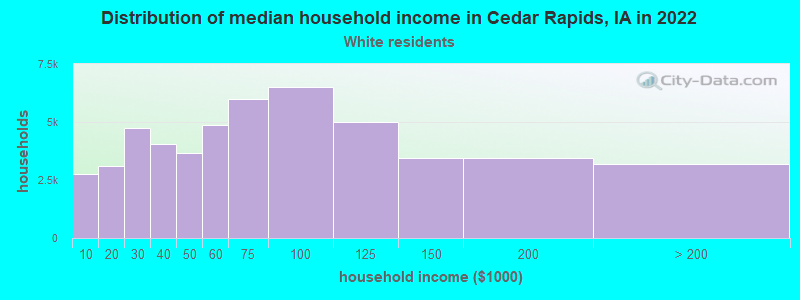
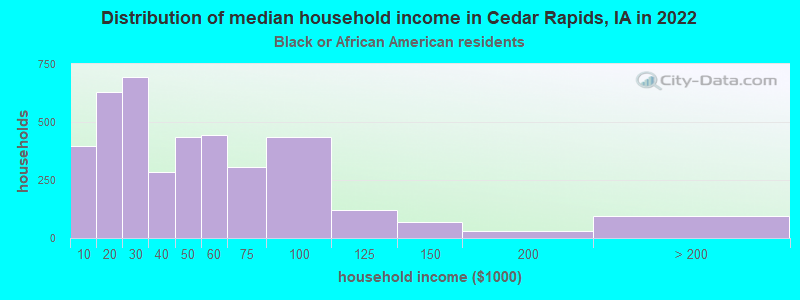
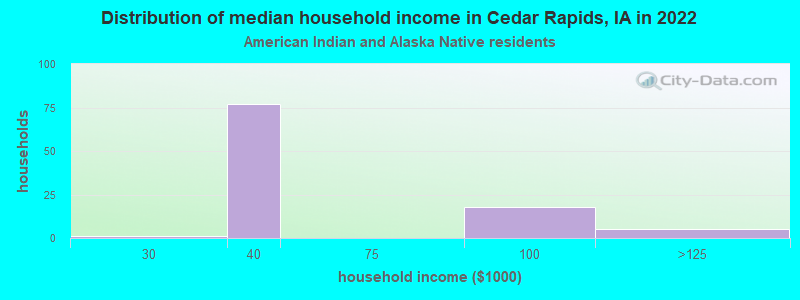
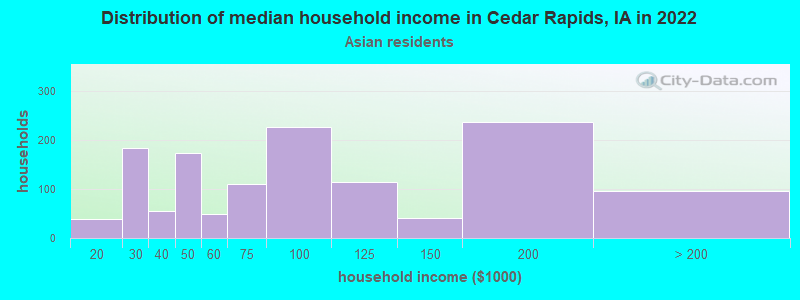
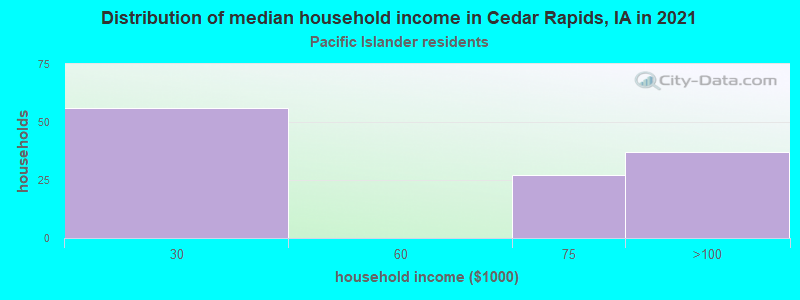
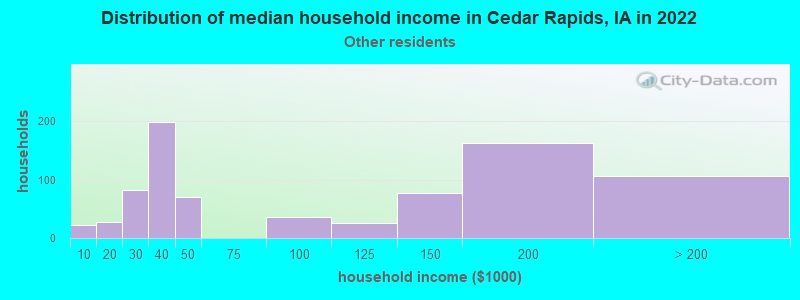
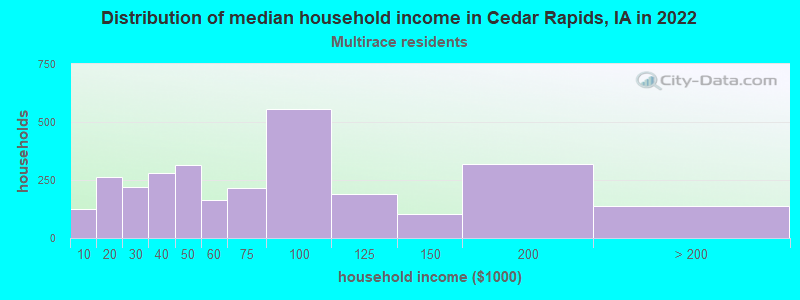
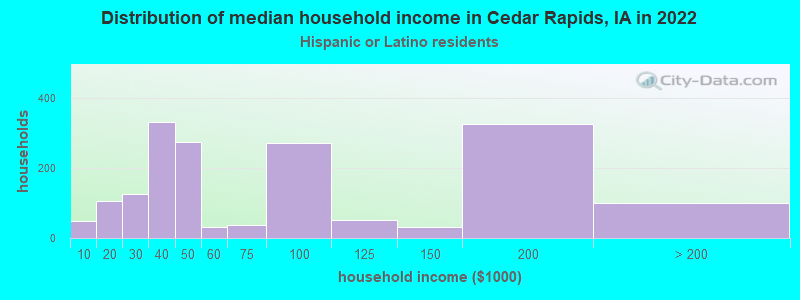
Income and house value in Cedar Rapids Median household income in 2022 $64,986 White non-Hispanic householders$43,226 Black householders$79,309 Asian householdersover $200,000 Some other race householders$92,506 Two or more races householders$51,352 Hispanic or Latino race householdersMedian 2022 house value $177,674 White Non-Hispanic householders$144,675 Black or African American householders$182,521 American Indian or Alaska Native householders $229,690 Asian householders$167,234 Some other race householders$165,183 Two or more races householders$171,149 Hispanic or Latino householders
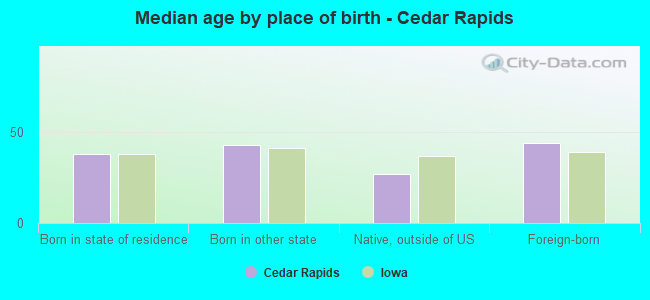
Median age by race in Cedar Rapids
41.9 Median age for White residents41.1 42.4 27.1 Median age for Black or African American residents28.8 26.7 50.1 Median age for American Indian / Alaska Native residents50.4 39.2 42.9 Median age for Asian residents42.5 45.9 -666,666,666.0 Median age for Native Hawaiian / Pacific Islander residents-666,666,666.0 -666,666,666.0 25.5 Median age for Other race residents24.0 43.5 20.6 Median age for Two or more races residents20.2 23.4 42.1 Median age for White alone residents41.0 42.8 23.8 Median age for Hispanic or Latino residents28.7 23.6
Owner/renter occupied households by race in Cedar Rapids
House owners and renters - White residents 37,721 74.2% Owner occupied13,098 25.8% Renter occupiedHouse owners and renters - Black or African American residents 717 21.1% Owner occupied2,674 78.9% Renter occupiedHouse owners and renters - American Indian / Alaska Native residents 13 12.9% Owner occupied90 87.1% Renter occupiedHouse owners and renters - Asian residents 817 49.3% Owner occupied840 50.7% Renter occupiedHouse owners and renters - Native Hawaiian / Pacific Islander residents 84 71.6% Owner occupied33 28.4% Renter occupiedHouse owners and renters - Other race residents 542 74.0% Owner occupied190 26.0% Renter occupiedHouse owners and renters - Two or more races residents 1,558 81.4% Owner occupied357 18.6% Renter occupiedHouse owners and renters - White alone residents 37,596 74.2% Owner occupied13,098 25.8% Renter occupiedHouse owners and renters - Hispanic or Latino residents 1,037 69.3% Owner occupied459 30.7% Renter occupied
Language usage in Cedar Rapids
English speakers - Total 91.8% of residents of Cedar Rapids speak English at home.
3.3% of residents speak Spanish at home 3,285 75.7% Speak English very well1,056 24.3% Speak English less than very well4.9% of residents speak other language at home 3,934 61.7% Speak English very well2,438 38.3% Speak English less than very well
English speakers - Born in the United States 92.5% of residents of Cedar Rapids speak English at home.
4.3% of residents speak Spanish at home 1,158 83.8% Speak English very well224 16.2% Speak English less than very well3.2% of residents speak other language at home 1,020 100.0% Speak English very well
English speakers - Native, born elsewhere 92.2% of residents of Cedar Rapids speak English at home.
7.8% of residents speak other language at home 105 100.0% Speak English very well
English speakers - Foreign-born 17.6% of residents of Cedar Rapids speak English at home.
21.8% of residents speak Spanish at home 1,068 64.3% Speak English very well593 35.7% Speak English less than very well60.5% of residents speak other language at home 2,443 53.1% Speak English very well2,159 46.9% Speak English less than very well
White (Caucasian) - Speak only English Native:
97.6% (101,208)Foreign-born:
25.0% (388)
White (Caucasian) - Speak another language Native:
2.4% (2,491)Foreign-born:
75.0% (1,167)
Black or African American - Speak only English Native:
97.1% (7,559)Foreign-born:
24.9% (621)
Black or African American - Speak another language Native:
2.9% (224)Foreign-born:
75.1% (1,875)
American Indian / Alaska Native - Speak another language Native:
37.0% (94)Foreign-born:
93.5% (15)
Asian - Speak only English Native:
39.4% (424)Foreign-born:
6.7% (186)
Asian - Speak another language Native:
61.6% (663)Foreign-born:
94.5% (2,616)
Native Hawaiian / Pacific Islander - Speak another language Native:
30.7% (100)Foreign-born:
93.3% (286)
Other race - Speak only English Native:
90.8% (1,241)Foreign-born:
10.1% (104)
Other race - Speak another language Native:
19.1% (261)Foreign-born:
87.1% (900)
Two or more races - Speak only English Native:
91.5% (7,885)Foreign-born:
26.6% (140)
Two or more races - Speak another language Native:
7.2% (623)Foreign-born:
75.4% (397)
White alone - Speak only English Native:
97.7% (100,580)Foreign-born:
34.2% (388)
White alone - Speak another language Native:
2.3% (2,373)Foreign-born:
65.8% (745)
Hispanic or Latino - Speak only English Native:
68.8% (2,899)Foreign-born:
11.1% (157)
Hispanic or Latino - Speak another language Native:
31.2% (1,317)Foreign-born:
88.9% (1,254)
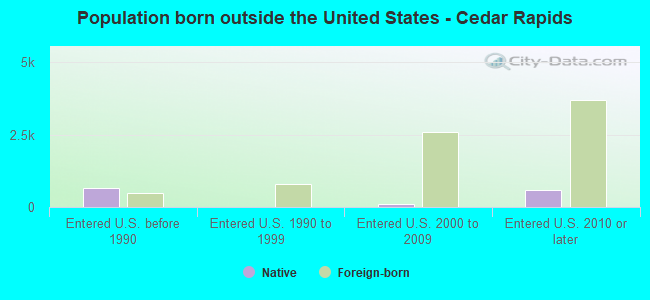
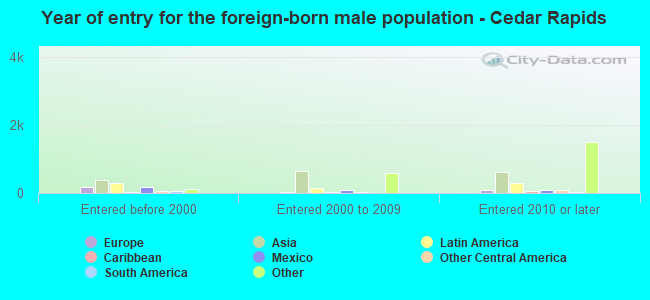
Foreign-born residents in Cedar Rapids 9,451 residents are foreign born (2.6% Asia , 2.3% Africa , 1.0% Latin America ).
Marital status for residents in Cedar Rapids Marital status - White (Caucasian) population 15 years and over
Males 38.9% Never married47.5% Now married1.6% Separated1.6% Widowed10.4% DivorcedFemales 35.5% Never married39.5% Now married1.0% Separated7.4% Widowed16.5% DivorcedWomen who gave birth in the past 12 months Now married:
67.1% (523)Unmarried:
32.9% (257)
Women who did not give birth in the past 12 months Now married:
31.7% (8,412)Unmarried:
68.3% (18,137)
Marital status - Black or African American population 15 years and over
Males 50.6% Never married36.0% Now married2.8% Separated0.4% Widowed10.1% DivorcedFemales 68.7% Never married22.7% Now married6.0% Separated0.0% Widowed2.6% DivorcedWomen who gave birth in the past 12 months Now married:
65.4% (228)Unmarried:
34.6% (120)
Women who did not give birth in the past 12 months Now married:
29.9% (694)Unmarried:
70.1% (1,626)
Marital status - American Indian / Alaska Native population 15 years and over
Males 62.5% Never married30.2% Now married0.0% Separated0.0% Widowed7.3% DivorcedFemales 47.6% Never married5.8% Now married9.7% Separated8.7% Widowed28.2% DivorcedWomen who did not give birth in the past 12 months Now married:
19.3% (17)Unmarried:
80.7% (70)
Marital status - Asian population 15 years and over
Males 22.9% Never married67.7% Now married0.0% Separated0.0% Widowed9.4% DivorcedFemales 17.5% Never married71.2% Now married0.0% Separated5.4% Widowed5.9% DivorcedWomen who gave birth in the past 12 months Now married:
82.7% (104)Unmarried:
17.3% (22)
Women who did not give birth in the past 12 months Now married:
70.3% (688)Unmarried:
29.7% (291)
Marital status - Native Hawaiian / Pacific Islander population 15 years and over
Males 100.0% Never married0.0% Now married0.0% Separated0.0% Widowed0.0% DivorcedFemales 78.3% Never married0.0% Now married0.0% Separated0.0% Widowed21.7% DivorcedWomen who did not give birth in the past 12 months Now married:
0.0% (0)Unmarried:
100.0% (187)
Marital status - Other race population 15 years and over
Males 35.4% Never married51.9% Now married3.5% Separated1.3% Widowed7.8% DivorcedFemales 26.4% Never married49.1% Now married8.7% Separated8.4% Widowed7.4% DivorcedWomen who gave birth in the past 12 months Now married:
78.4% (75)Unmarried:
21.6% (21)
Women who did not give birth in the past 12 months Now married:
61.2% (427)Unmarried:
38.8% (271)
Marital status - Two or more races population 15 years and over
Males 50.8% Never married44.5% Now married1.0% Separated1.0% Widowed2.7% DivorcedFemales 47.1% Never married45.3% Now married4.9% Separated2.4% Widowed0.3% DivorcedWomen who gave birth in the past 12 months Now married:
14.3% (22)Unmarried:
85.7% (134)
Women who did not give birth in the past 12 months Now married:
22.1% (782)Unmarried:
77.9% (2,760)
Marital status - White alone, not Hispanic / Latino population 15 years and over
Males 39.1% Never married47.1% Now married1.7% Separated1.6% Widowed10.5% DivorcedFemales 35.0% Never married39.8% Now married1.0% Separated7.5% Widowed16.6% DivorcedWomen who gave birth in the past 12 months Now married:
67.1% (523)Unmarried:
32.9% (257)
Women who did not give birth in the past 12 months Now married:
32.0% (8,356)Unmarried:
68.0% (17,719)
Marital status - Hispanic or Latino population 15 years and over
Males 47.2% Never married51.3% Now married1.5% Separated0.0% Widowed0.0% DivorcedFemales 42.6% Never married40.9% Now married12.1% Separated2.1% Widowed2.3% DivorcedWomen who gave birth in the past 12 months Now married:
20.5% (40)Unmarried:
79.5% (154)
Women who did not give birth in the past 12 months Now married:
50.5% (908)Unmarried:
49.5% (890)
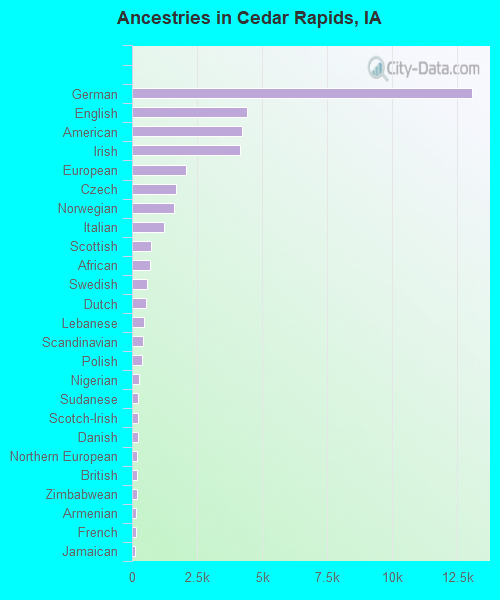
Ancestries in Cedar Rapids
13,063 23.0% German4,414 7.8% English4,242 7.5% American4,162 7.3% Irish2,076 3.7% European1,709 3.0% Czech1,631 2.9% Norwegian1,246 2.2% Italian725 1.3% Scottish682 1.2% African566 1.0% Swedish535 0.9% Dutch460 0.8% Lebanese436 0.8% Scandinavian372 0.7% Polish252 0.4% Nigerian245 0.4% Sudanese242 0.4% Scotch-Irish224 0.4% Danish209 0.4% Northern European206 0.4% British205 0.4% Zimbabwean170 0.3% Armenian142 0.3% French127 0.2% Jamaican107 0.2% Eastern European106 0.2% South African102 0.2% Canadian85 0.1% Ghanaian81 0.1% Czechoslovakian72 0.1% Haitian71 0.1% Moroccan60 0.1% Ukrainian59 0.1% Greek58 0.1% Welsh52 0.09% Belgian48 0.08% Turkish47 0.08% Russian45 0.08% Arab45 0.08% French Canadian43 0.08% Maltese40 0.07% Albanian38 0.07% Luxembourger36 0.06% Austrian34 0.06% Hungarian32 0.06% Yugoslavian32 0.06% Portuguese31 0.05% Swiss30 0.05% Slovene26 0.05% Liberian20 0.04% Celtic19 0.03% Egyptian17 0.03% Finnish15 0.03% Estonian15 0.03% Kenyan11 0.02% Brazilian9 0.02% Lithuanian8 0.01% Romanian8 0.01% Iranian7 0.01% Slovak6 0.01% Pennsylvania German
Geographical mobility in Cedar Rapids Same house 1 year ago 95,458 87.9% White (Caucasian)7,823 71.2% Black or African American260 91.4% American Indian / Alaska Native3,378 96.5% Asian412 100.0% Native Hawaiian / Pacific Islander1,540 63.8% Other race8,893 81.1% Two or more races94,437 88.0% White alone, not Hispanic / Latino4,424 72.7% Hispanic or LatinoMoved within same county 6,960 6.4% White / Caucasian1,093 9.9% Black or African American6 2.1% American Indian / Alaska Native67 1.9% Asian141 5.8% Other race1,512 13.8% Two or more races6,904 6.4% White alone, not Hispanic / Latino921 15.1% Hispanic or LatinoMoved within same state 4,441 4.1% White / Caucasian1,895 17.2% Black or African American19 6.7% American Indian / Alaska Native29 0.8% Asian32 1.3% Other race215 2.0% Two or more races4,292 4.0% White alone, not Hispanic / Latino197 3.2% Hispanic or LatinoMoved from different state 1,705 1.6% White / Caucasian182 1.7% Black or African American4 1.3% American Indian / Alaska Native7 0.2% Asian569 23.5% Other race196 1.8% Two or more races1,689 1.6% White alone, not Hispanic / Latino331 5.4% Hispanic or LatinoMoved from abroad 39 0.0% White35 1.0% Asian143 5.9% Other race108 1.0% Two or more races39 0.0% White alone, not Hispanic / Latino195 3.2% Hispanic or Latino
Children Nativity (place of birth) in Cedar Rapids
Children under 6 years - Living with two parents Both parents native 4,728 100.0% NativeBoth parents foreign-born 448 72.4% Native171 27.6% Foreign-bornOne native, one foreign-born parent 432 100.0% NativeChildren under 6 years - Living with one parent Native parent 3,385 100.0% NativeForeign-born parent 84 65.1% Native45 34.9% Foreign-bornChildren 6 to 17 years - Living with two parents Both parents native 9,366 99.0% Native95 1.0% Foreign-bornBoth parents foreign-born 1,153 82.9% Native238 17.1% Foreign-bornOne native, one foreign-born parent 633 97.4% Native17 2.6% Foreign-bornChildren 6 to 17 years - Living with one parent Native parent 5,806 100.0% NativeForeign-born parent 484 54.9% Native397 45.1% Foreign-born
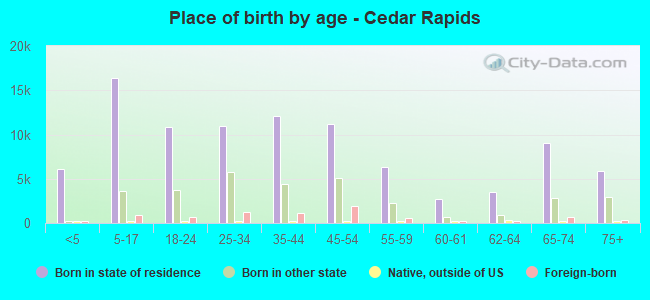
Place of birth for residents in Cedar Rapids
Grandparents responsible for own grandchildren in Cedar Rapids
Grandparents (30 to 59 years) White / Caucasian 118 28.6% Responsible for grandchildren296 71.4% Not responsible for grandchildrenBlack or African American 14 24.9% Responsible for grandchildren42 75.1% Not responsible for grandchildrenAsian 21 56.2% Responsible for grandchildren17 43.8% Not responsible for grandchildrenTwo or more races 52 45.7% Responsible for grandchildren62 54.3% Not responsible for grandchildrenWhite alone, not Hispanic / Latino 114 26.2% Responsible for grandchildren322 73.8% Not responsible for grandchildrenHispanic or Latino 10 52.6% Responsible for grandchildren9 47.4% Not responsible for grandchildrenGrandparents (60 years and over) White / Caucasian 114 19.8% Responsible for grandchildren464 80.2% Not responsible for grandchildrenBlack or African American 63 45.5% Responsible for grandchildren76 54.5% Not responsible for grandchildrenAsian 25 13.3% Responsible for grandchildren161 86.7% Not responsible for grandchildrenTwo or more races 37 100.0% Responsible for grandchildrenWhite alone, not Hispanic / Latino 115 19.5% Responsible for grandchildren474 80.5% Not responsible for grandchildrenHispanic or Latino 14 100.0% Not responsible for grandchildren
Zip codes: 52227 , 52228 , 52233 , 52302 , 52324 , 52328 , 52338 , 52401 , 52402 , 52404 , 52405 , 52411 .