Cinco Ranch, TX (Texas) Houses and Residents
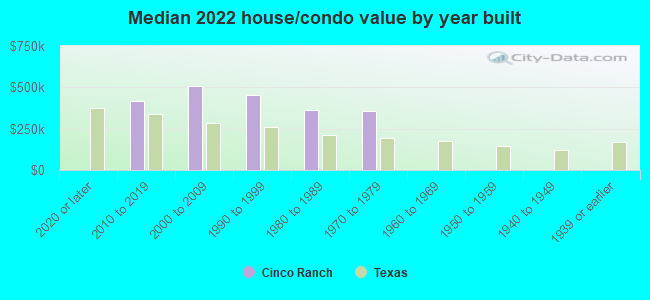
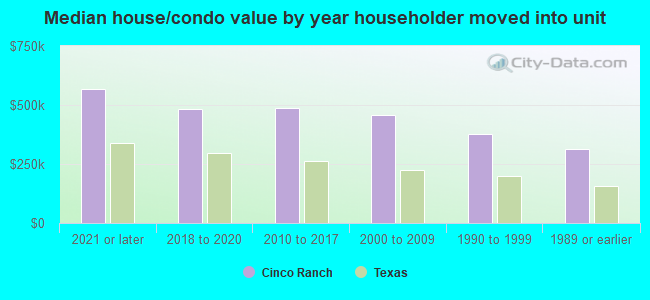
| Cinco Ranch: | $457,955 |
| Texas: | $275,400 |
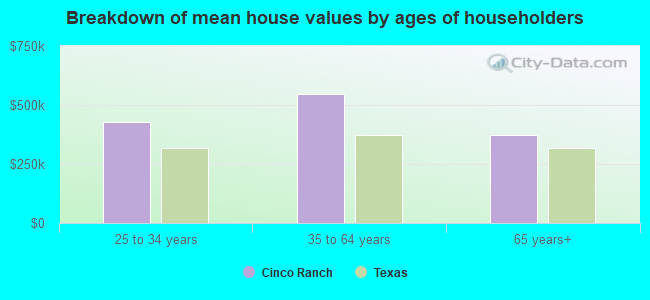
Mean price in 2022:
Detached houses: $493,993
Here: $493,993 State: $369,058
Total population: 18,274 (Urban population: 11,189, Rural population: 48 (all nonfarm))
Houses: 6,868 (6,672 occupied: 4,722 owner occupied, 2,007 renter occupied)
| % of renters here: | 30% |
| State: | 38% |
Housing density: 1,393 houses/condos per square mile
Median price asked for vacant for-sale houses and condos in 2022: $1,941,213.
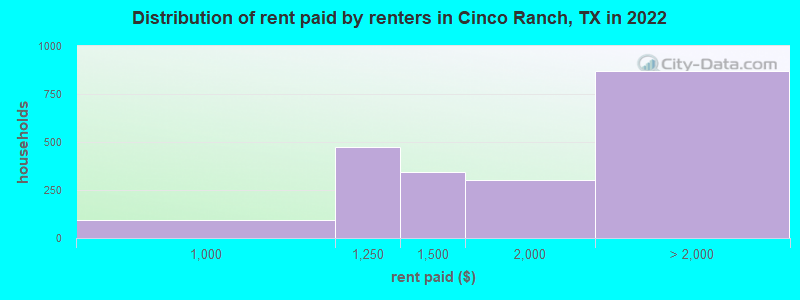
Median contract rent in 2022: $1,628 (lower quartile is $1,210, upper quartile is over $2,000)
Median rent asked for vacant for-rent units in 2022: $2,656
Median gross rent in Cinco Ranch, TX in 2022: $1,779
Housing units in Cinco Ranch with a mortgage: 2,645 (93 second mortgage, 8 home equity loan, 81 both second mortgage and home equity loan)
Houses without a mortgage: 34
Median household income for houses/condos with a mortgage: $187,215
Median household income for apartments without a mortgage: $140,398
Median monthly housing costs: $1,943
Compare current foreclosures near Cinco Ranch, TX:
| Photo | Address | Area | Beds / Baths | Price | Details |
|---|---|---|---|---|---|

|
#1
W Antone Cir
Houston, TX 77071
|
1,932 sq. feet
|
2 baths 4 beds |
$284,900
|
show details |

|
#2
Briarhurst Dr Apt 35
Houston, TX 77057
|
1,092 sq. feet
|
2 baths 2 beds |
$174,900
|
show details |

|
#3
Daffodil Rd
Missouri City, TX 77489
|
- sq. feet
|
2 baths 4 beds |
show details | |

|
#4
Hamilton Crest
Brookshire, TX 77423
|
- sq. feet
|
2 baths 4 beds |
show details | |

|
#5
Blue Water Bay Dr
Katy, TX 77494
|
2,553 sq. feet
|
2 baths 4 beds |
show details | |

|
#6
Kassikay Dr
Houston, TX 77084
|
1,739 sq. feet
|
2 baths 4 beds |
show details | |

|
#7
Aubergine Springs Ln
Katy, TX 77449
|
2,050 sq. feet
|
2 baths 3 beds |
show details | |

|
#8
Wild Berry Dr
Katy, TX 77449
|
2,935 sq. feet
|
2 baths 4 beds |
show details | |

|
#9
Canyon Chase Dr
Houston, TX 77095
|
3,783 sq. feet
|
3 baths 5 beds |
show details | |

|
#10
Evening Moon Ln
Katy, TX 77449
|
3,934 sq. feet
|
3 baths 5 beds |
show details |
| Photo | Address | Area | Beds / Baths | Price | Details |
|---|---|---|---|---|---|

|
#11
Modesto Dr
Houston, TX 77083
|
2,546 sq. feet
|
2 baths 4 beds |
show details | |

|
#12
Afton Ridge Ln
Houston, TX 77084
|
2,196 sq. feet
|
2 baths 4 beds |
show details | |

|
#13
Rose Summit Ln
Richmond, TX 77407
|
2,032 sq. feet
|
2 baths 4 beds |
show details | |

|
#14
Bering Dr
Houston, TX 77057
|
2,115 sq. feet
|
3 baths 3 beds |
show details | |

|
#15
Colony Chase Court
Richmond, TX 77407
|
2,790 sq. feet
|
2 baths 3 beds |
show details | |

|
#16
Bear Hunters Dr
Katy, TX 77449
|
- sq. feet
|
3 baths 4 beds |
show details | |

|
#17
Reign Wayman Ct
Katy, TX 77449
|
- sq. feet
|
2 baths 4 beds |
show details | |

|
#18
Nova Dr
Houston, TX 77077
|
1,921 sq. feet
|
2 baths 4 beds |
show details | |

|
#19
Settlers Village Dr
Katy, TX 77449
|
1,386 sq. feet
|
2 baths 3 beds |
show details | |

|
#20
Knightsbridge Blvd
Sugar Land, TX 77479
|
3,252 sq. feet
|
2 baths 4 beds |
show details |
| Photo | Address | Area | Beds / Baths | Price | Details |
|---|---|---|---|---|---|

|
#21
Bright Moon Ct
Katy, TX 77449
|
1,651 sq. feet
|
2 baths 3 beds |
show details | |

|
#22
Wakefield Meadow Ct
Richmond, TX 77407
|
3,448 sq. feet
|
4 baths 5 beds |
show details | |

|
#23
Epsom Downs Dr
Cypress, TX 77433
|
1,284 sq. feet
|
2 baths 3 beds |
show details | |

|
#24
Sunflower Chase Dr
Katy, TX 77449
|
2,221 sq. feet
|
2 baths 3 beds |
show details | |

|
#25
Braesridge Dr
Houston, TX 77071
|
3,217 sq. feet
|
3 baths 5 beds |
show details | |

|
#26
Walnut Ln
Brookshire, TX 77423
|
1,621 sq. feet
|
2 baths 3 beds |
show details | |

|
#27
Pinecreek Pass Ln
Katy, TX 77449
|
3,040 sq. feet
|
2 baths 4 beds |
show details | |

|
#28
Great Glen Dr
Houston, TX 77084
|
1,500 sq. feet
|
2 baths 3 beds |
show details | |

|
#29
Camden Heights Lane
Richmond, TX 77407
|
1,516 sq. feet
|
2 baths 3 beds |
show details | |

|
#30
Camellia Knoll Trl
Houston, TX 77084
|
2,486 sq. feet
|
3 baths 4 beds |
show details |
| Photo | Address | Area | Beds / Baths | Price | Details |
|---|---|---|---|---|---|

|
#31
Elizabeth Brook Dr
Richmond, TX 77406
|
1,652 sq. feet
|
2 baths 3 beds |
show details | |

|
#32
Windsor Ct
Missouri City, TX 77459
|
1,676 sq. feet
|
2 baths 3 beds |
show details | |

|
#33
Prairie Sky Lane
Katy, TX 77493
|
3,842 sq. feet
|
4 baths 5 beds |
show details | |

|
#34
Apache Lake Dr
Katy, TX 77449
|
1,788 sq. feet
|
2 baths 3 beds |
show details | |

|
#35
Prairie Grove Dr
Houston, TX 77077
|
1,480 sq. feet
|
2 baths 2 beds |
show details | |

|
#36
Rockcrest Dr
Houston, TX 77041
|
1,321 sq. feet
|
2 baths 3 beds |
show details | |

|
#37
Wickhollow Ln
Houston, TX 77043
|
2,153 sq. feet
|
2 baths 3 beds |
show details | |

|
#38
Appleberry Dr
Cypress, TX 77433
|
1,812 sq. feet
|
2 baths 3 beds |
show details | |

|
#39
Creek Bluff Ln
Cypress, TX 77433
|
3,073 sq. feet
|
3 baths 4 beds |
show details | |

|
#40
Bassett Hall Ln
Katy, TX 77493
|
2,100 sq. feet
|
2 baths 3 beds |
show details |
| Photo | Address | Area | Beds / Baths | Price | Details |
|---|---|---|---|---|---|

|
#41
W Savile Cir
Houston, TX 77065
|
1,490 sq. feet
|
2 baths 3 beds |
show details | |

|
#42
Pear Oak Dr
Houston, TX 77065
|
1,713 sq. feet
|
2 baths 3 beds |
show details | |

|
#43
Wrenwood Lks
Houston, TX 77043
|
2,710 sq. feet
|
3 baths 3 beds |
show details | |

|
#44
Baileywood Dr
Richmond, TX 77407
|
3,438 sq. feet
|
2 baths 4 beds |
show details | |

|
#45
Siebinthaler Ln
Houston, TX 77084
|
1,877 sq. feet
|
2 baths 3 beds |
show details | |

|
#46
Jamie Lee Ct
Houston, TX 77095
|
2,830 sq. feet
|
2 baths 4 beds |
show details | |

|
#47
Meadowhollow Dr
Stafford, TX 77477
|
1,884 sq. feet
|
2 baths 3 beds |
show details | |

|
#48
Taylan Ln
Rosenberg, TX 77471
|
1,816 sq. feet
|
2 baths 4 beds |
show details | |

|
#49
Pax Hill Ctkaty, Tx 77493
Katy, TX 77493
|
- sq. feet
|
2 baths 3 beds |
show details | |

|
Check over 1 million property listings on Foreclosure.com!
|
browse all offers | |||


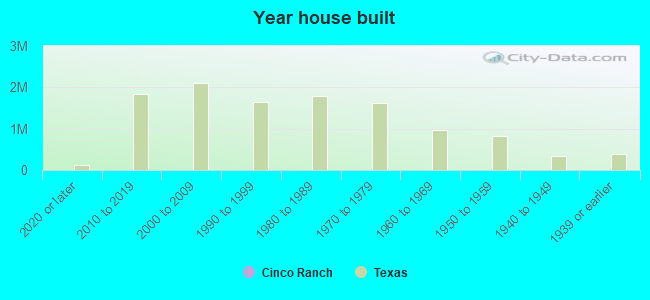
Median year apartment built: 2001
Household type by relationship:
Households: 20,136- Male householders: 4,408 (388 living alone), Female householders: 2,171 (397 living alone)
5,369 spouses (5,369 opposite-sex spouses), 56 unmarried partners, (56 opposite-sex unmarried partners), 7,247 children (6,882 natural, 214 adopted, 150 stepchildren), 195 grandchildren, 105 brothers or sisters, 426 parents, 0 foster children, 107 other relatives, 48 non-relatives
Size of family households: 1,756 2-persons, 1,887 3-persons, 1,334 4-persons, 627 5-persons, 165 6-persons, 17 7-or-more-persons.
Size of nonfamily households: 852 1-person, 70 2-persons.
5,222 married couples with children.
275 single-parent households (28 men, 247 women).
61.5% of residents of Cinco Ranch speak English at home.
20.3% of residents speak Spanish at home (57% speak English very well, 40% speak English well, 3% speak English not well, 1% don't speak English at all).
8.6% of residents speak other Indo-European language at home (62% speak English very well, 30% speak English well, 5% speak English not well, 3% don't speak English at all).
8.0% of residents speak Asian or Pacific Island language at home (58% speak English very well, 30% speak English well, 9% speak English not well, 2% don't speak English at all).
1.7% of residents speak other language at home (100% speak English very well).
Foreign born population: 7,173 (35.6%)
(39.0% of them are naturalized citizens)
| Here: | 9.7 |
| State: | 6.3 |
| Here: | 4.5 |
| State: | 4.0 |
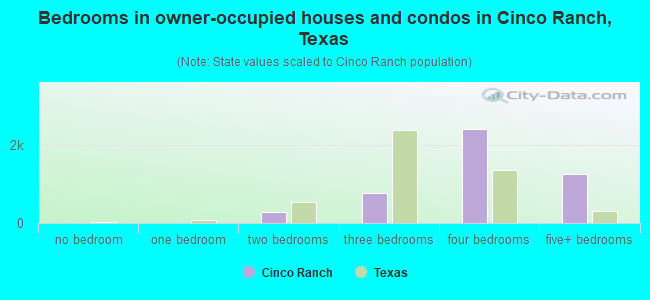
- Bedrooms in owner-occupied houses and condos in Cinco Ranch, Texas
- 7no bedroom
- 51 bedroom
- 2702 bedrooms
- 7663 bedrooms
- 2,4124 bedrooms
- 1,2635+ bedrooms
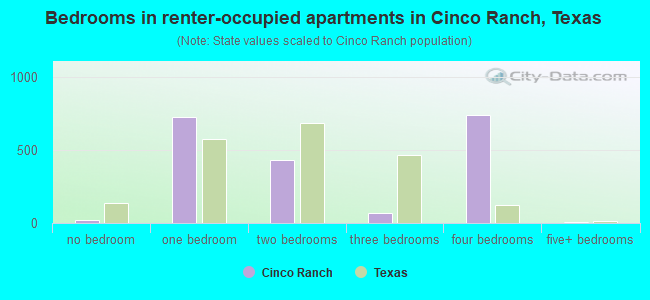
- Bedrooms in renter-occupied apartments in Cinco Ranch, Texas
- 24no bedroom
- 7311 bedroom
- 4312 bedrooms
- 693 bedrooms
- 7434 bedrooms
- 105+ bedrooms
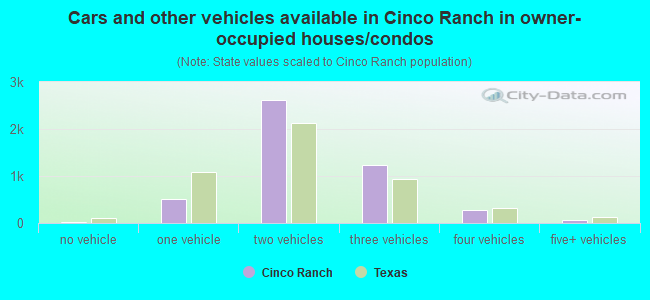
- Cars and other vehicles available in Cinco Ranch in owner-occupied houses/condos
- 31no vehicle
- 5101 vehicle
- 2,6202 vehicles
- 1,2263 vehicles
- 2774 vehicles
- 595+ vehicles
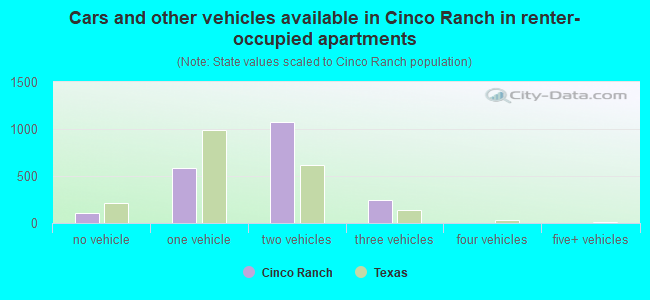
- Cars and other vehicles available in Cinco Ranch in renter-occupied apartments
- 110no vehicle
- 5821 vehicle
- 1,0742 vehicles
- 2413 vehicles
- 04 vehicles
- 05+ vehicles
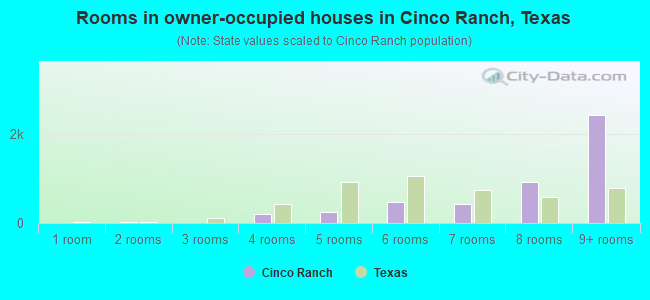
- Rooms in owner-occupied houses in Cinco Ranch, Texas
- 01 room
- 122 rooms
- 03 rooms
- 1964 rooms
- 2415 rooms
- 4766 rooms
- 4287 rooms
- 9328 rooms
- 2,4379+ rooms
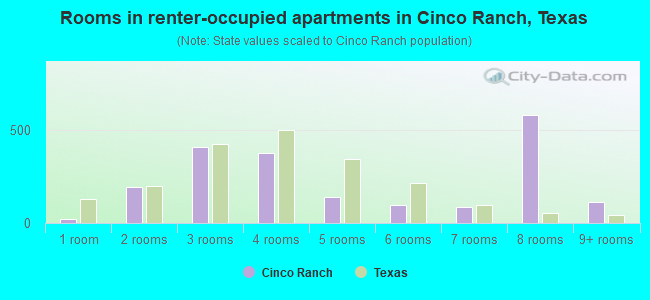
- Rooms in renter-occupied apartments in Cinco Ranch, Texas
- 241 room
- 1902 rooms
- 4073 rooms
- 3734 rooms
- 1405 rooms
- 996 rooms
- 837 rooms
- 5798 rooms
- 1139+ rooms
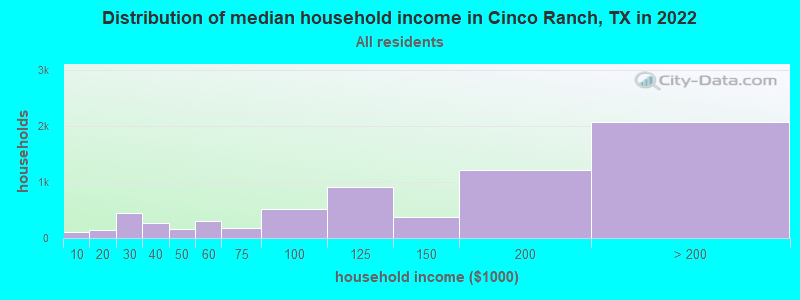
Cinco Ranch, TX household income distribution

- 110Less than $10,000
- 147$10,000 to $19,999
- 450$20,000 to $29,999
- 259$30,000 to $39,999
- 160$40,000 to $49,999
- 311$50,000 to $59,999
- 184$60,000 to $74,999
- 511$75,000 to $99,999
- 903$100,000 to $124,999
- 383$125,000 to $149,999
- 1,211$150,000 to $199,999
- 2,069$200,000 or more
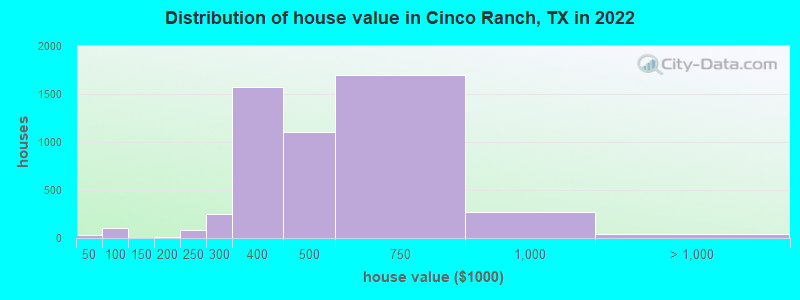
Home value of owner - occupied houses in 2022 in Cinco Ranch, TX
-
- 11$35,000 to $39,999
- 23$40,000 to $49,999
- 69$60,000 to $69,999
- 16$80,000 to $89,999
- 5$150,000 to $174,999
- 7$175,000 to $199,999
- 78$200,000 to $249,999
- 250$250,000 to $299,999
- 1,574$300,000 to $399,999
- 1,099$400,000 to $499,999
- 1,698$500,000 to $749,999
- 269$750,000 to $999,999
- 18$1,000,000 to $1,499,999
- 27$2,000,000 or more
Rent paid by renters in 2022 in Cinco Ranch, TX
-
- 95$900 to $999
- 472$1,000 to $1,249
- 344$1,250 to $1,499
- 302$1,500 to $1,999
- 633$2,000 to $2,499
- 208$2,500 to $2,999
- 9$3,000 to $3,499
- 19$3,500 or more
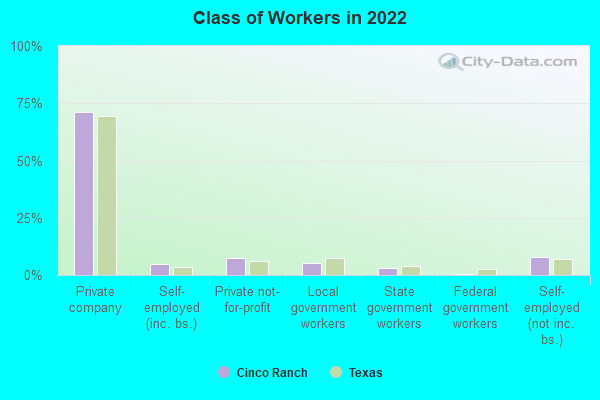
Percentage of workers working in this county: 55.0%
Number of people working at home: 2,362 (25.8% of all workers)
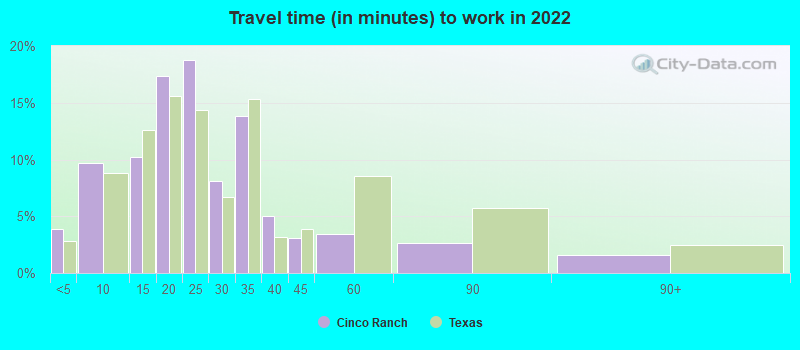
Travel time to work (commute)
- Less than 5 minutes: 207
- 5 to 9 minutes: 542
- 10 to 14 minutes: 661
- 15 to 19 minutes: 431
- 20 to 24 minutes: 575
- 25 to 29 minutes: 270
- 30 to 34 minutes: 1,427
- 35 to 39 minutes: 436
- 40 to 44 minutes: 259
- 45 to 59 minutes: 1,173
- 60 to 89 minutes: 659
- 90 or more minutes: 179
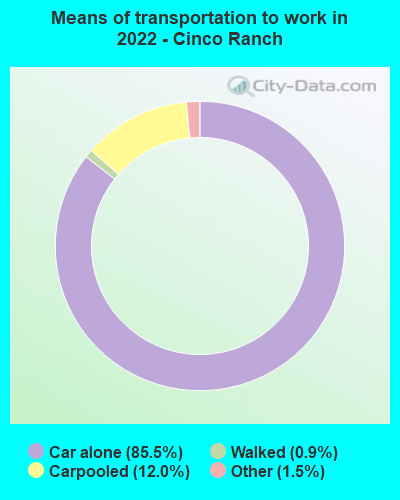
Means of transportation to work:
- Drove a car alone: 3,456 (53.9%)
- Carpooled: 572 (8.9%)
- Taxi: 74 (1.2%)
- Walked: 48 (0.7%)
- Worked at home: 2,362 (36.9%)
- Unemployment by race in 2022
- Unemployment rate for White non-Hispanic residents
- 3.0%Males
- 2.3%Females
- Unemployment rate for Asian residents
- 23.6%Males
- 1.2%Females
- Unemployment rate for other race residents
- 4.0%Females
- Unemployment rate for two or more race residents
- 3.6%Males
- 8.7%Females
- Unemployment rate for Hispanic or Latino residents
- 2.0%Males
- 8.6%Females
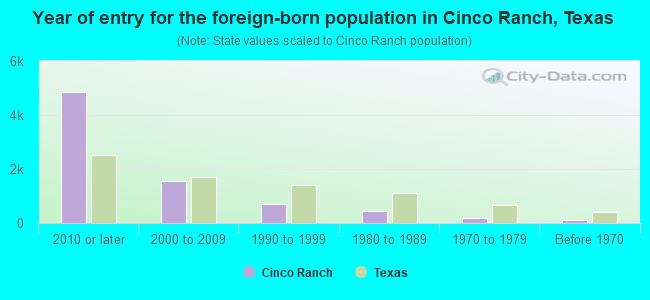
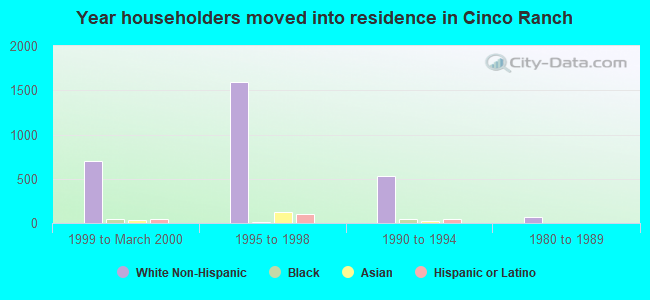
- Year of entry for the foreign-born population in Cinco Ranch, Texas
- 4,8382010 or later
- 1,5382000 to 2009
- 6941990 to 1999
- 4501980 to 1989
- 1991970 to 1979
- 113Before 1970
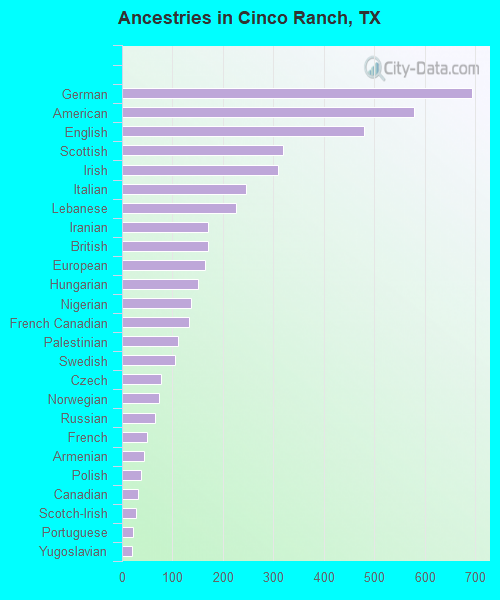
First ancestries reported:
- German: 693 (6.9%)
- American: 578 (5.8%)
- English: 480 (4.8%)
- Scottish: 319 (3.2%)
- Irish: 310 (3.1%)
- Italian: 246 (2.5%)
- Lebanese: 227 (2.3%)
- Iranian: 171 (1.7%)
- British: 170 (1.7%)
- European: 164 (1.6%)
- Hungarian: 150 (1.5%)
- Nigerian: 137 (1.4%)
- French Canadian: 133 (1.3%)
- Palestinian: 111 (1.1%)
- Swedish: 106 (1.1%)
- Czech: 78 (0.8%)
- Norwegian: 73 (0.7%)
- Russian: 65 (0.6%)
- French: 49 (0.5%)
- Armenian: 43 (0.4%)
- Polish: 37 (0.4%)
- Canadian: 31 (0.3%)
- Scotch-Irish: 28 (0.3%)
- Portuguese: 22 (0.2%)
- Yugoslavian: 20 (0.2%)
- Slavic: 19 (0.2%)
- Dutch: 18 (0.2%)
- Jordanian: 17 (0.2%)
- Welsh: 17 (0.2%)
- Ukrainian: 16 (0.2%)
- Romanian: 14 (0.1%)
- Danish: 13 (0.1%)
- Austrian: 7 (0.07%)
- Serbian: 6 (0.06%)
- African: 6 (0.06%)
Most common places of birth for foreign-born residents (%):
| Cinco Ranch: | 10.0% (693) |
| Texas: | 0.2% (9,236) |
| Cinco Ranch: | 9.7% (673) |
| Texas: | 6.1% (306,347) |
| Cinco Ranch: | 9.7% (672) |
| Texas: | 1.2% (61,555) |
| Cinco Ranch: | 7.9% (548) |
| Texas: | 2.3% (115,558) |
| Cinco Ranch: | 5.9% (409) |
| Texas: | 0.1% (5,793) |
| Cinco Ranch: | 5.5% (377) |
| Texas: | 48.4% (2,411,723) |
| Cinco Ranch: | 5.5% (377) |
| Texas: | 1.5% (72,413) |
| Cinco Ranch: | 4.4% (305) |
| Texas: | 3.0% (147,182) |
| Cinco Ranch: | 3.8% (264) |
| Texas: | 0.5% (26,969) |
| Cinco Ranch: | 3.0% (205) |
| Texas: | 0.1% (5,917) |
| Cinco Ranch: | 2.1% (146) |
| Texas: | 1.1% (55,371) |
| Cinco Ranch: | 2.1% (142) |
| Texas: | 0.4% (17,796) |
| Cinco Ranch: | 1.9% (132) |
| Texas: | 0.6% (28,963) |
| Cinco Ranch: | 1.9% (132) |
| Texas: | 1.3% (62,978) |
| Cinco Ranch: | 1.8% (123) |
| Texas: | 1.9% (96,110) |
| Cinco Ranch: | 1.8% (123) |
| Texas: | 0.2% (7,705) |
| Cinco Ranch: | 1.8% (122) |
| Texas: | 0.1% (5,523) |
| Cinco Ranch: | 1.7% (119) |
| Texas: | 0.1% (2,637) |
| Cinco Ranch: | 1.6% (111) |
| Texas: | 0.2% (9,332) |
| Cinco Ranch: | 1.5% (106) |
| Texas: | 3.7% (184,770) |
| Cinco Ranch: | 1.5% (106) |
| Texas: | 0.1% (4,638) |
Place of birth for U.S.-born residents:
- This state: 7,871
- Other state: 4,661
- Northeast: 677
- Midwest: 1,484
- South: 1,818
- West: 609
88.9% of Cinco Ranch residents lived in the same house 1 years ago.
Out of people who lived in different houses, 25.8% lived in this county.
Out of people who lived in different counties, 90.1% lived in Texas.
| Cinco Ranch: | 88.9% |
| State average: | 85.7% |
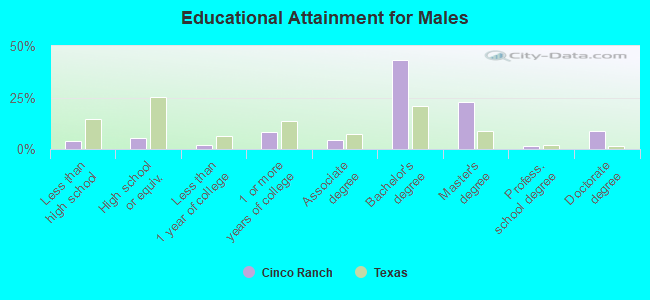
Education attainment for males 25 years and older:
- No schooling: 70
- Nursery to 4th grade: 13
- 5th and 6th grade: 0
- 7th and 8th grade: 94
- 9th grade: 0
- 10th grade: 0
- 11th grade: 0
- 12th grade, no diploma: 58
- High school graduate (or equivalency): 356
- Less than 1 year of college: 115
- Some college more than 1 year, no degree: 536
- Associate degree: 280
- Bachelor's degree: 2,751
- Master's degree: 1,455
- Professional school degree: 96
- Doctorate degree: 552
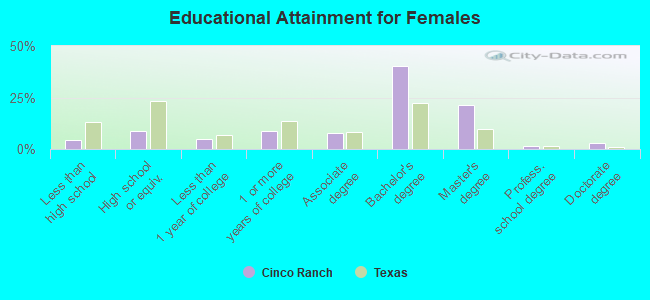
Education attainment for females 25 years and older:
- No schooling: 255
- Nursery to 4th grade: 9
- 5th and 6th grade: 12
- 7th and 8th grade: 0
- 9th grade: 0
- 10th grade: 13
- 11th grade: 0
- 12th grade, no diploma: 0
- High school graduate (or equivalency): 584
- Less than 1 year of college: 333
- Some college more than 1 year, no degree: 578
- Associate degree: 518
- Bachelor's degree: 2,712
- Master's degree: 1,442
- Professional school degree: 107
- Doctorate degree: 194


Housing units in structures:
- One, detached: 5,645
- One, attached: 20
- 3 or 4: 129
- 5 to 9: 163
- 10 to 19: 164
- 20 to 49: 227
- 50 or more: 517
Housing units lacking complete kitchen facilities in 2022: 0.9%
House/condo owner moved in on average 12 years ago
Renter moved in on average 1 years ago
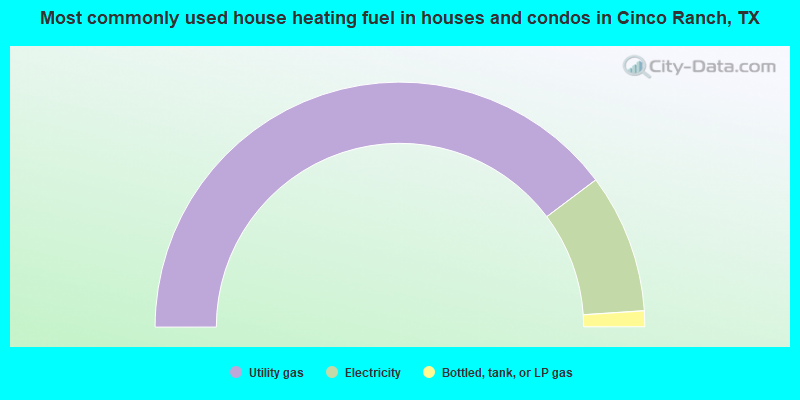
- 79.5%Utility gas
- 18.4%Electricity
- 2.1%Bottled, tank, or LP gas
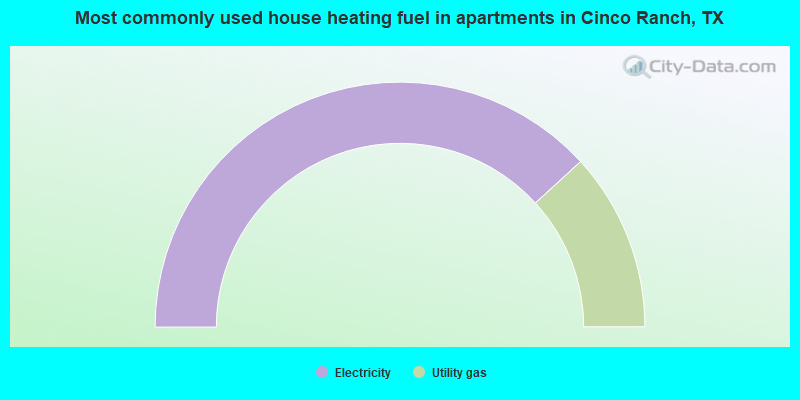
- 76.4%Electricity
- 23.6%Utility gas
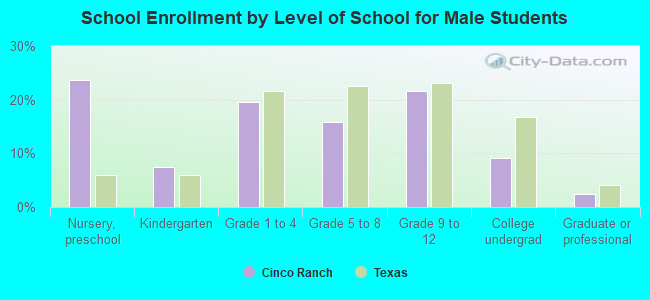
Private vs. public school enrollment:
| Here: | 3.4% |
| Texas: | 8.8% |
| Here: | 11.2% |
| Texas: | 8.0% |
| Here: | 21.4% |
| Texas: | 16.2% |