Clarksburg, WV (West Virginia) Houses and Residents
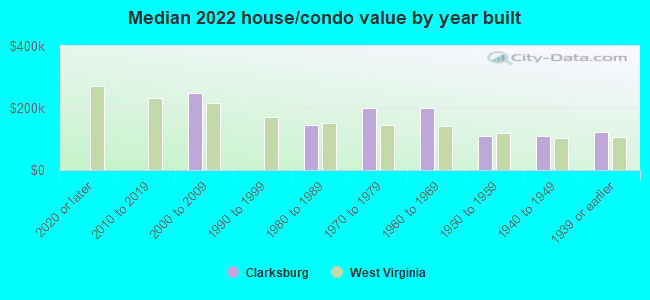
| Clarksburg: | $128,895 |
| West Virginia: | $155,100 |
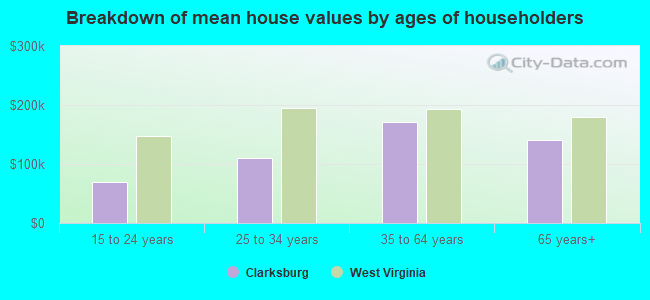
Mean price in 2022:
Detached houses: $149,804
Here: $149,804 State: $206,655 Townhouses or other attached units: $125,549
Here: $125,549 State: $205,683 In 2-unit structures: $87,534
Here: $87,534 State: $127,101 Mobile homes: $136,354
Here: $136,354 State: $63,963
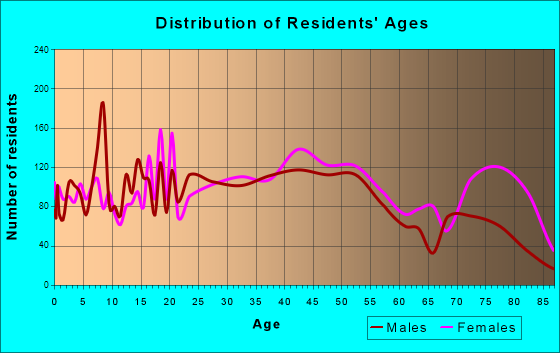
Total population: 16,242 (All urban)
Houses: 8,139 (6,642 occupied: 4,207 owner occupied, 2,468 renter occupied)
| % of renters here: | 37% |
| State: | 26% |
Housing density: 855 houses/condos per square mile
Median price asked for vacant for-sale houses and condos in 2022: $90,376.
Median contract rent in 2022: $620 (lower quartile is $414, upper quartile is $727)
Median rent asked for vacant for-rent units in 2022: $1,015
Median gross rent in Clarksburg, WV in 2022: $749
Housing units in Clarksburg with a mortgage: 1,963 (76 second mortgage, 0 home equity loan, 73 both second mortgage and home equity loan)
Houses without a mortgage: 74
Median household income for houses/condos with a mortgage: $84,508
Median household income for apartments without a mortgage: $45,814
Median monthly housing costs: $584
Compare current foreclosures near Clarksburg, WV:
| Photo | Address | Area | Beds / Baths | Price | Details |
|---|---|---|---|---|---|

|
#1
Ash St
Clarksburg, WV 26301
|
- sq. feet
|
1 baths 2 beds |
show details | |

|
#2
Vermont Ave
Clarksburg, WV 26301
|
1,141 sq. feet
|
2 baths 3 beds |
show details | |

|
#3
Lang Ave
Clarksburg, WV 26301
|
956 sq. feet
|
1 baths 4 beds |
show details | |

|
#4
Wilsonburg Rd
Clarksburg, WV 26301
|
- sq. feet
|
- baths - beds |
show details | |

|
#5
Buckhannon Ave
Clarksburg, WV 26301
|
- sq. feet
|
- baths - beds |
show details | |

|
#6
Country Club Rd
Clarksburg, WV 26301
|
- sq. feet
|
- baths - beds |
show details | |

|
#7
S 5th St
Clarksburg, WV 26301
|
- sq. feet
|
- baths - beds |
show details | |

|
#8
Locust Ave Apt 2
Clarksburg, WV 26301
|
- sq. feet
|
- baths - beds |
show details | |

|
#9
W Main St
Grafton, WV 26354
|
960 sq. feet
|
1 baths 3 beds |
$49,900
|
show details |

|
#10
Lambert Ave
Fairmont, WV 26554
|
1,406 sq. feet
|
1 baths 2 beds |
$44,500
|
show details |
| Photo | Address | Area | Beds / Baths | Price | Details |
|---|---|---|---|---|---|

|
#11
Hedge St
Clarksburg, WV 26301
|
- sq. feet
|
- baths - beds |
show details | |

|
#12
High St
Shinnston, WV 26431
|
1,165 sq. feet
|
1 baths 3 beds |
show details | |

|
#13
Bolyard Rd
Grafton, WV 26354
|
- sq. feet
|
- baths - beds |
$27,900
|
show details |

|
#14
George Washington Hwy
Bridgeport, WV 26330
|
2,430 sq. feet
|
1 baths 4 beds |
show details | |

|
#15
Anderson Hollow Rd
Mannington, WV 26582
|
1,832 sq. feet
|
1 baths 2 beds |
show details | |

|
#16
Walnut St
Grafton, WV 26354
|
1,956 sq. feet
|
1 baths 3 beds |
show details | |

|
#17
Peacock Ln
Fairmont, WV 26554
|
2,089 sq. feet
|
1 baths 4 beds |
show details | |

|
#18
Clifton Rd
Fairmont, WV 26554
|
1,000 sq. feet
|
2 baths 3 beds |
show details | |

|
#19
Drexel Pl
Fairmont, WV 26554
|
1,650 sq. feet
|
2 baths 3 beds |
show details | |

|
#20
Whispering Pines Dr
Fairmont, WV 26554
|
1,388 sq. feet
|
1 baths 3 beds |
show details |
| Photo | Address | Area | Beds / Baths | Price | Details |
|---|---|---|---|---|---|

|
#21
Matthew Dr
Fairmont, WV 26554
|
1,862 sq. feet
|
2 baths 3 beds |
show details | |

|
#22
Jones Run Rd
Lumberport, WV 26386
|
- sq. feet
|
- baths - beds |
show details | |

|
#23
Water St
Salem, WV 26426
|
- sq. feet
|
- baths - beds |
show details | |

|
#24
4b Trailer Ct
Weston, WV 26452
|
- sq. feet
|
- baths - beds |
show details | |

|
#25
Main Ave, Apt 1
Fairmont, WV 26554
|
- sq. feet
|
- baths - beds |
show details | |

|
#26
Rooting Creek Rd
Lost Creek, WV 26385
|
- sq. feet
|
- baths - beds |
show details | |

|
#27
Cherry Camp Rd
Salem, WV 26426
|
- sq. feet
|
- baths - beds |
show details | |

|
#28
Airport Rd # A
Fairmont, WV 26554
|
- sq. feet
|
- baths - beds |
show details | |

|
#29
Watercrest Ln
Fairmont, WV 26554
|
- sq. feet
|
- baths - beds |
show details | |

|
#30
Whites Carver Rd
Grafton, WV 26354
|
- sq. feet
|
- baths - beds |
show details |
| Photo | Address | Area | Beds / Baths | Price | Details |
|---|---|---|---|---|---|

|
#31
Turkey Run Rd
Salem, WV 26426
|
- sq. feet
|
- baths - beds |
show details | |

|
#32
Mayapple Ln
Fairmont, WV 26554
|
- sq. feet
|
- baths - beds |
show details | |

|
#33
Broadway St
Flemington, WV 26347
|
- sq. feet
|
- baths - beds |
show details | |

|
#34
Indian Run Rd
Salem, WV 26426
|
- sq. feet
|
- baths - beds |
show details | |

|
#35
Boothsville Rd
Bridgeport, WV 26330
|
- sq. feet
|
- baths - beds |
show details | |

|
#36
Hill View Ter
Enterprise, WV 26568
|
- sq. feet
|
- baths - beds |
show details | |

|
#37
Hawk Crest Dr
Mount Clare, WV 26408
|
- sq. feet
|
- baths - beds |
show details | |

|
#38
1 Box 41
Bridgeport, WV 26330
|
- sq. feet
|
- baths - beds |
show details | |

|
#39
Suds Run Rd
Mount Clare, WV 26408
|
- sq. feet
|
- baths - beds |
show details | |

|
#40
Robin Ln
Mount Clare, WV 26408
|
- sq. feet
|
- baths - beds |
show details |
| Photo | Address | Area | Beds / Baths | Price | Details |
|---|---|---|---|---|---|

|
#41
Buckhannon Pike
Mount Clare, WV 26408
|
- sq. feet
|
- baths - beds |
show details | |

|
#42
Buddys Hollow Rd
Wallace, WV 26448
|
- sq. feet
|
- baths - beds |
show details | |

|
#43
Tupelo Ln
Bridgeport, WV 26330
|
- sq. feet
|
- baths - beds |
show details | |

|
#44
Parkview Dr Apt 103
Bridgeport, WV 26330
|
- sq. feet
|
- baths - beds |
show details | |

|
#45
Union Camp Rd
Shinnston, WV 26431
|
- sq. feet
|
- baths - beds |
show details | |

|
#46
Jack Run Rd
Lumberport, WV 26386
|
- sq. feet
|
- baths - beds |
show details | |

|
#47
Kimberly Way
Lost Creek, WV 26385
|
- sq. feet
|
- baths - beds |
show details | |

|
#48
Lena Ln
Lost Creek, WV 26385
|
- sq. feet
|
- baths - beds |
show details | |

|
#49
Duck Creek Rd
Lost Creek, WV 26385
|
- sq. feet
|
- baths - beds |
show details | |

|
Check over 1 million property listings on Foreclosure.com!
|
browse all offers | |||

Latest news about housing in Clarksburg, WV collected exclusively by city-data.com from local newspapers, TV, and radio stations

 | Buying home in Clarksburg need honest opinion (2 replies) |
| Bridgeport/Fairmont safe apartments (2 replies) |
| Apartments near Bridgeport/Clarksburg (2 replies) |
| Apartments near Bridgeport/Clarksburg (0 replies) |
| Looking for house to Rent in Fairmont, Clarksburg, Bridgeport, WV area (1 reply) |
| Looking for a house to rent in Clarksburg area (0 replies) |
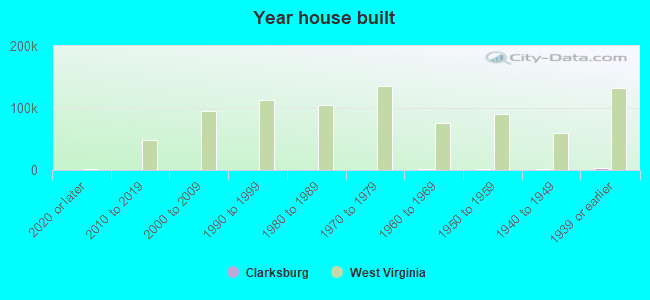
Median year apartment built: 1963
Household type by relationship:
Households: 15,747- Male householders: 2,967 (1,166 living alone), Female householders: 3,586 (1,631 living alone)
2,368 spouses (2,345 opposite-sex spouses), 388 unmarried partners, (341 opposite-sex unmarried partners), 4,624 children (4,290 natural, 187 adopted, 146 stepchildren), 514 grandchildren, 139 brothers or sisters, 217 parents, 0 foster children, 146 other relatives, 518 non-relatives
- In group quarters: 274
Size of family households: 1,588 2-persons, 839 3-persons, 617 4-persons, 354 5-persons, 124 6-persons, 25 7-or-more-persons.
Size of nonfamily households: 2,622 1-person, 465 2-persons, 15 3-persons.
2,257 married couples with children.
766 single-parent households (42 men, 724 women).
98.1% of residents of Clarksburg speak English at home.
0.3% of residents speak Spanish at home (31% speak English very well, 69% speak English not well).
1.1% of residents speak other Indo-European language at home (74% speak English very well, 26% speak English well).
0.3% of residents speak Asian or Pacific Island language at home (24% speak English very well, 76% speak English not well).
Foreign born population: 60 (0.4%)
(56.7% of them are naturalized citizens)
| Here: | 6.7 |
| State: | 6.5 |
| Here: | 4.1 |
| State: | 4.7 |
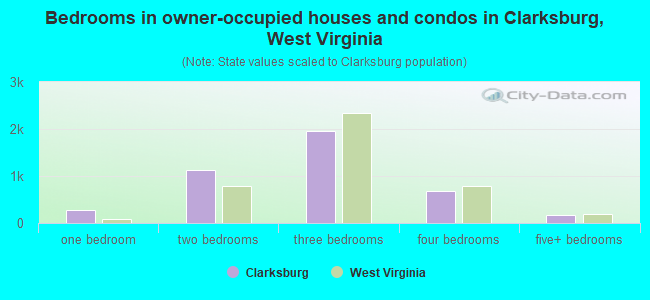
- Bedrooms in owner-occupied houses and condos in Clarksburg, West Virginia
- 0no bedroom
- 2701 bedroom
- 1,1252 bedrooms
- 1,9513 bedrooms
- 6874 bedrooms
- 1745+ bedrooms
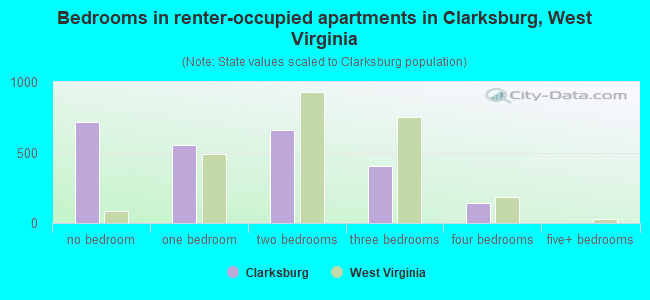
- Bedrooms in renter-occupied apartments in Clarksburg, West Virginia
- 716no bedroom
- 5541 bedroom
- 6582 bedrooms
- 4023 bedrooms
- 1404 bedrooms
- 05+ bedrooms
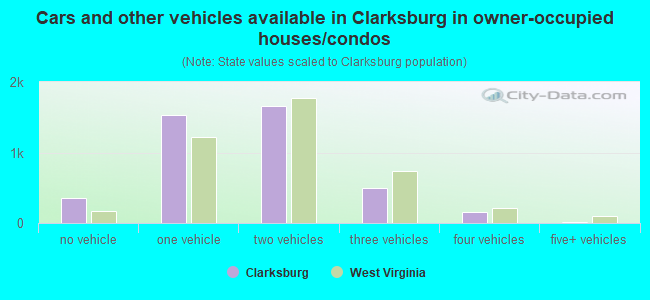
- Cars and other vehicles available in Clarksburg in owner-occupied houses/condos
- 348no vehicle
- 1,5251 vehicle
- 1,6622 vehicles
- 5023 vehicles
- 1514 vehicles
- 195+ vehicles
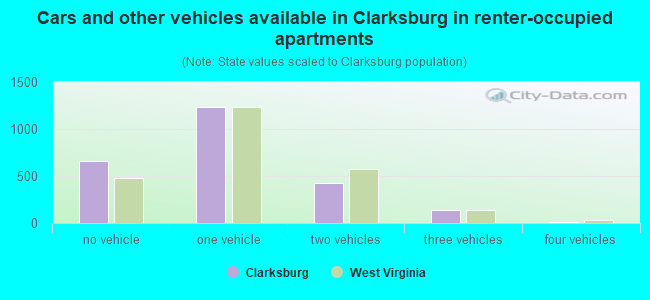
- Cars and other vehicles available in Clarksburg in renter-occupied apartments
- 660no vehicle
- 1,2381 vehicle
- 4212 vehicles
- 1363 vehicles
- 154 vehicles
- 05+ vehicles
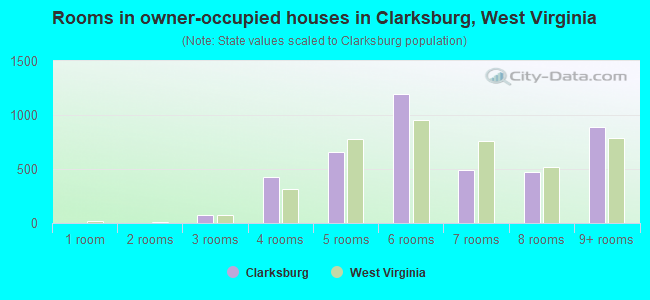
- Rooms in owner-occupied houses in Clarksburg, West Virginia
- 01 room
- 02 rooms
- 703 rooms
- 4234 rooms
- 6585 rooms
- 1,1976 rooms
- 4947 rooms
- 4758 rooms
- 8919+ rooms
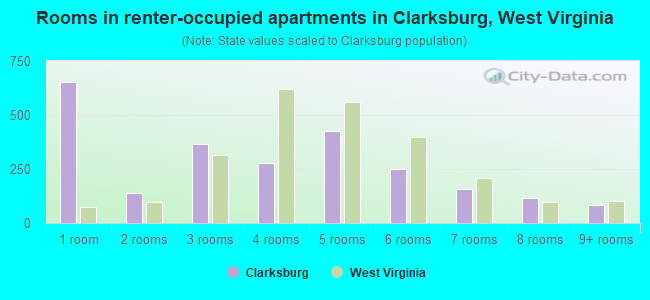
- Rooms in renter-occupied apartments in Clarksburg, West Virginia
- 6541 room
- 1412 rooms
- 3683 rooms
- 2764 rooms
- 4275 rooms
- 2486 rooms
- 1567 rooms
- 1158 rooms
- 839+ rooms
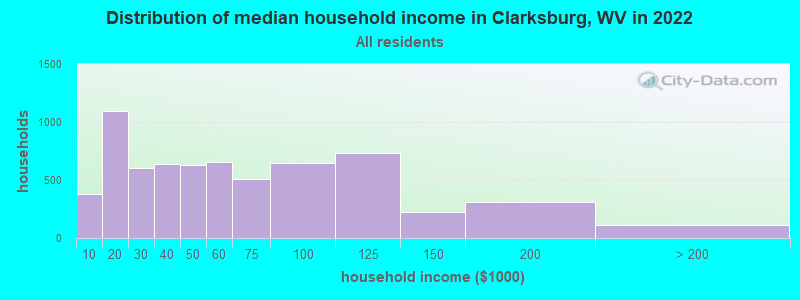
Clarksburg, WV household income distribution

- 376Less than $10,000
- 1,098$10,000 to $19,999
- 602$20,000 to $29,999
- 641$30,000 to $39,999
- 632$40,000 to $49,999
- 651$50,000 to $59,999
- 512$60,000 to $74,999
- 648$75,000 to $99,999
- 737$100,000 to $124,999
- 225$125,000 to $149,999
- 309$150,000 to $199,999
- 114$200,000 or more
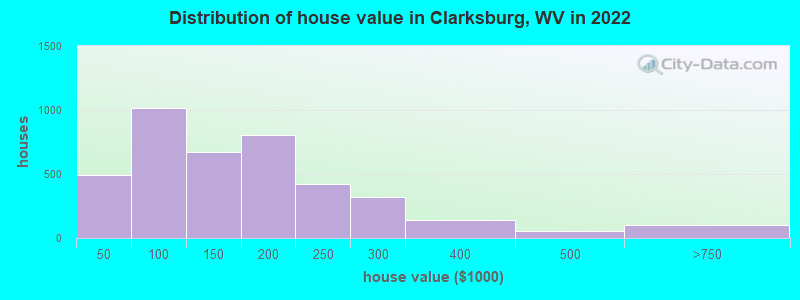
Home value of owner - occupied houses in 2022 in Clarksburg, WV
-
- 19Less than $10,000
- 30$10,000 to $14,999
- 14$15,000 to $19,999
- 213$20,000 to $24,999
- 62$25,000 to $29,999
- 30$30,000 to $34,999
- 23$35,000 to $39,999
- 96$40,000 to $49,999
- 139$50,000 to $59,999
- 133$60,000 to $69,999
- 115$70,000 to $79,999
- 351$80,000 to $89,999
- 182$90,000 to $99,999
- 376$100,000 to $124,999
- 296$125,000 to $149,999
- 629$150,000 to $174,999
- 173$175,000 to $199,999
- 425$200,000 to $249,999
- 316$250,000 to $299,999
- 144$300,000 to $399,999
- 51$400,000 to $499,999
- 99$500,000 to $749,999
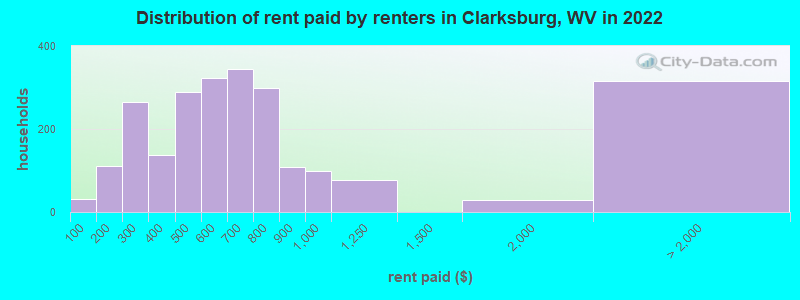
Rent paid by renters in 2022 in Clarksburg, WV
-
- 32Less than $100
- 111$150 to $199
- 123$200 to $249
- 141$250 to $299
- 46$300 to $349
- 90$350 to $399
- 102$400 to $449
- 185$450 to $499
- 171$500 to $549
- 152$550 to $599
- 108$600 to $649
- 235$650 to $699
- 161$700 to $749
- 138$750 to $799
- 107$800 to $899
- 99$900 to $999
- 76$1,000 to $1,249
- 28$1,500 to $1,999
- 315No cash rent
Percentage of workers working in this county: 81.0%
Number of people working at home: 517 (8.3% of all workers)
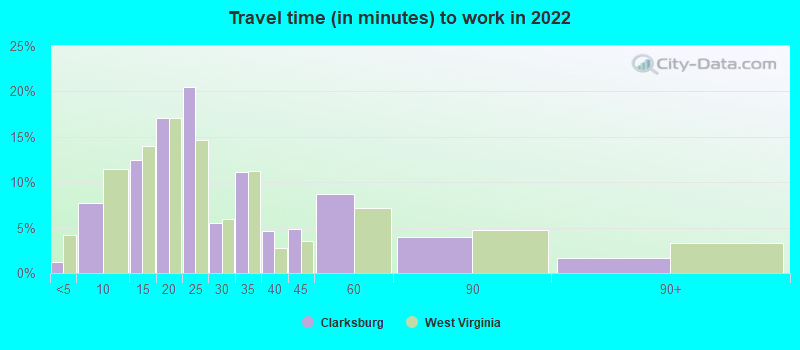
Travel time to work (commute)
- Less than 5 minutes: 137
- 5 to 9 minutes: 870
- 10 to 14 minutes: 1,213
- 15 to 19 minutes: 1,150
- 20 to 24 minutes: 1,032
- 25 to 29 minutes: 276
- 30 to 34 minutes: 199
- 35 to 39 minutes: 163
- 40 to 44 minutes: 236
- 45 to 59 minutes: 196
- 60 to 89 minutes: 149
- 90 or more minutes: 177
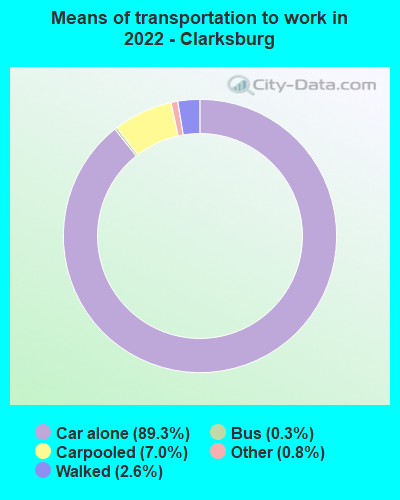
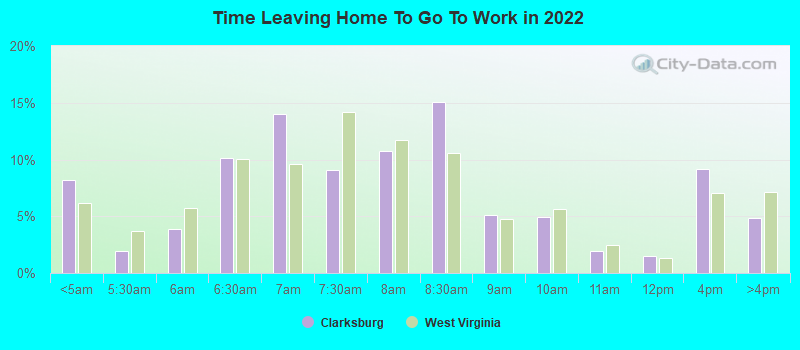
Means of transportation to work:
- Drove a car alone: 10,845 (84.6%)
- Carpooled: 850 (6.6%)
- Bus: 36 (0.3%)
- Taxi: 115 (0.9%)
- Walked: 292 (2.3%)
- Worked at home: 517 (4.0%)
- Unemployment by race in 2022
- Unemployment rate for White non-Hispanic residents
- 5.9%Males
- 5.1%Females
- Unemployment rate for Black residents
- 22.3%Males
- 3.9%Females
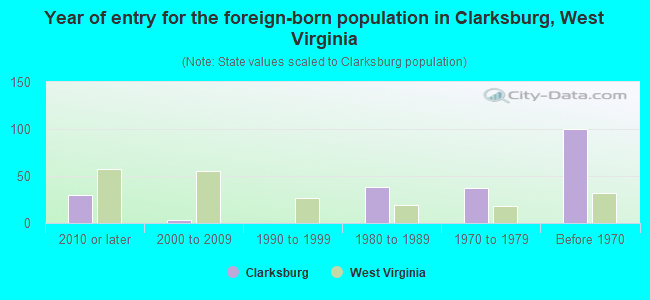
- Year of entry for the foreign-born population in Clarksburg, West Virginia
- 302010 or later
- 32000 to 2009
- 01990 to 1999
- 381980 to 1989
- 371970 to 1979
- 100Before 1970
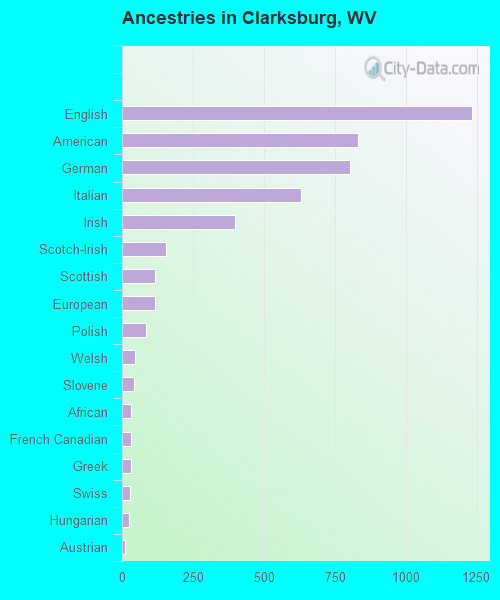
First ancestries reported:
- English: 1,232 (23.4%)
- American: 833 (15.9%)
- German: 803 (15.3%)
- Italian: 631 (12.0%)
- Irish: 400 (7.6%)
- Scotch-Irish: 156 (3.0%)
- Scottish: 116 (2.2%)
- European: 115 (2.2%)
- Polish: 85 (1.6%)
- Welsh: 47 (0.9%)
- Slovene: 42 (0.8%)
- African: 32 (0.6%)
- French Canadian: 30 (0.6%)
- Greek: 30 (0.6%)
- Swiss: 28 (0.5%)
- Hungarian: 26 (0.5%)
- Austrian: 12 (0.2%)
- Norwegian: 11 (0.2%)
- Russian: 11 (0.2%)
- Slovak: 11 (0.2%)
- French: 9 (0.2%)
- Swedish: 9 (0.2%)
- Northern European: 8 (0.2%)
- Eastern European: 7 (0.1%)
Most common places of birth for foreign-born residents (%):
| Clarksburg: | 26.6% (17) |
| West Virginia: | 2.1% (604) |
| Clarksburg: | 15.6% (10) |
| West Virginia: | 7.2% (2,098) |
| Clarksburg: | 15.6% (10) |
| West Virginia: | 2.6% (758) |
| Clarksburg: | 12.5% (8) |
| West Virginia: | 1.5% (442) |
| Clarksburg: | 9.4% (6) |
| West Virginia: | 6.2% (1,798) |
| Clarksburg: | 6.2% (4) |
| West Virginia: | 5.8% (1,673) |
| Clarksburg: | 4.7% (3) |
| West Virginia: | 0.1% (28) |
Place of birth for U.S.-born residents:
- This state: 11,521
- Other state: 4,344
- Northeast: 689
- Midwest: 896
- South: 2,534
- West: 175
90.8% of Clarksburg residents lived in the same house 1 years ago.
Out of people who lived in different houses, 35.1% lived in this county.
Out of people who lived in different counties, 68.1% lived in West Virginia.
| Clarksburg: | 90.8% |
| State average: | 89.6% |
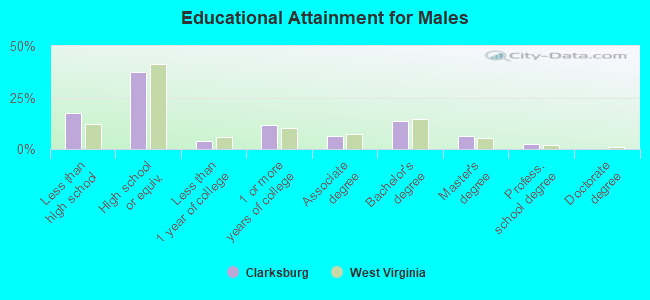
Education attainment for males 25 years and older:
- No schooling: 54
- Nursery to 4th grade: 0
- 5th and 6th grade: 44
- 7th and 8th grade: 62
- 9th grade: 133
- 10th grade: 129
- 11th grade: 272
- 12th grade, no diploma: 218
- High school graduate (or equivalency): 1,951
- Less than 1 year of college: 207
- Some college more than 1 year, no degree: 594
- Associate degree: 340
- Bachelor's degree: 714
- Master's degree: 323
- Professional school degree: 137
- Doctorate degree: 11
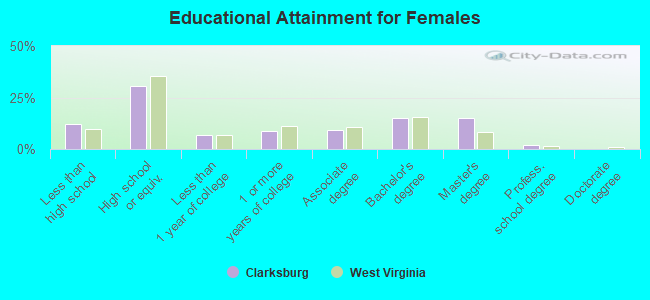
Education attainment for females 25 years and older:
- No schooling: 30
- Nursery to 4th grade: 0
- 5th and 6th grade: 0
- 7th and 8th grade: 43
- 9th grade: 181
- 10th grade: 79
- 11th grade: 217
- 12th grade, no diploma: 154
- High school graduate (or equivalency): 1,772
- Less than 1 year of college: 404
- Some college more than 1 year, no degree: 507
- Associate degree: 531
- Bachelor's degree: 862
- Master's degree: 878
- Professional school degree: 104
- Doctorate degree: 8
Housing units in structures:
- One, detached: 5,825
- One, attached: 146
- Two: 630
- 3 or 4: 441
- 5 to 9: 377
- 10 to 19: 65
- 20 to 49: 219
- 50 or more: 333
- Mobile homes: 98
Housing units lacking complete kitchen facilities in 2022: 3.5%
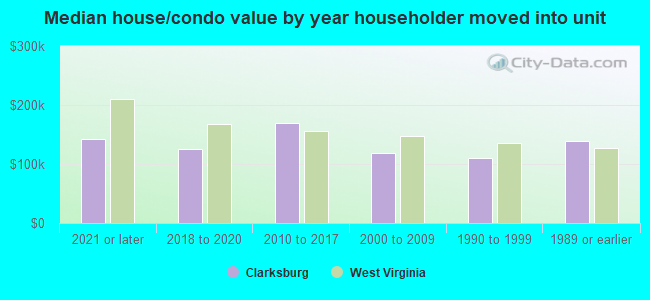
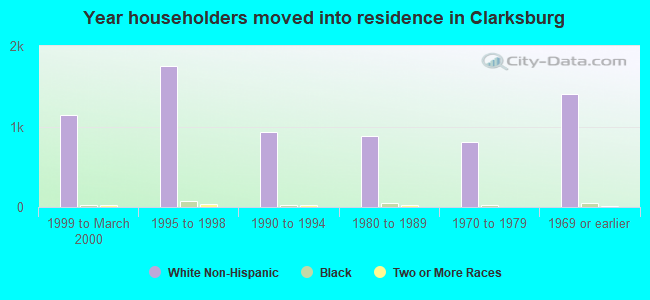
House/condo owner moved in on average 17 years ago
Renter moved in on average 6 years ago
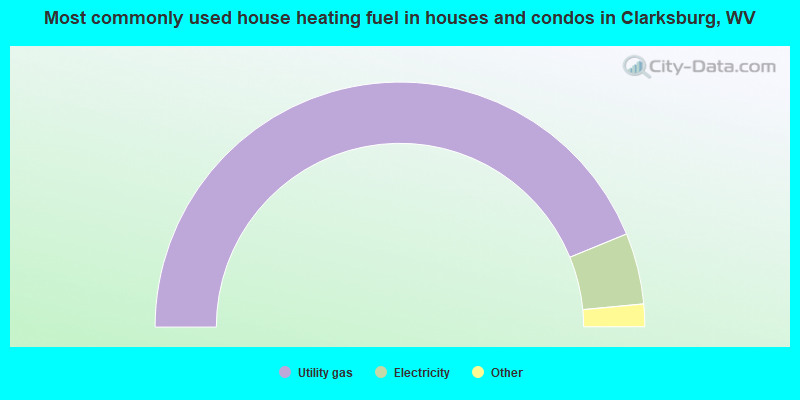
- 87.7%Utility gas
- 9.4%Electricity
- 2.1%Bottled, tank, or LP gas
- 0.6%Coal or coke
- 0.2%Wood
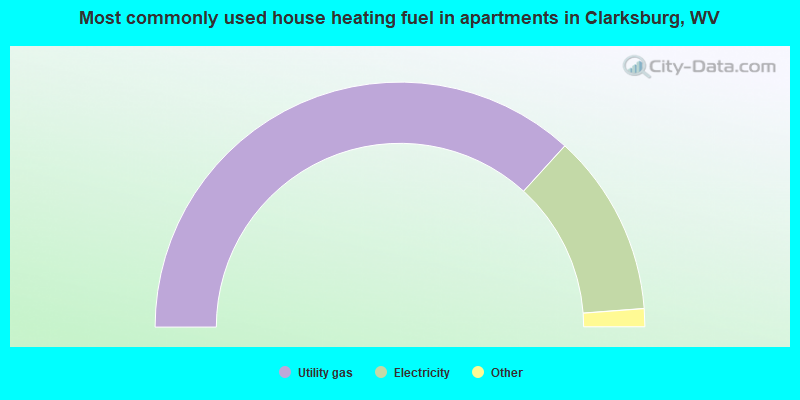
- 73.6%Utility gas
- 24.1%Electricity
- 1.1%No fuel used
- 1.0%Other fuel
- 0.2%Bottled, tank, or LP gas
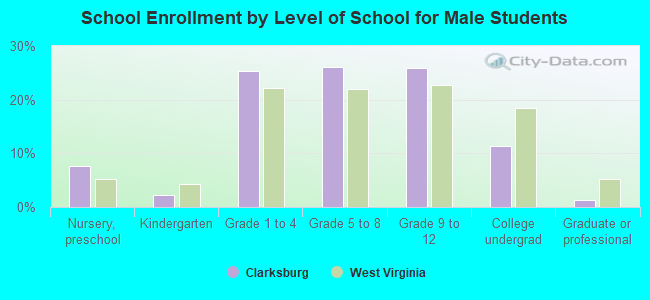
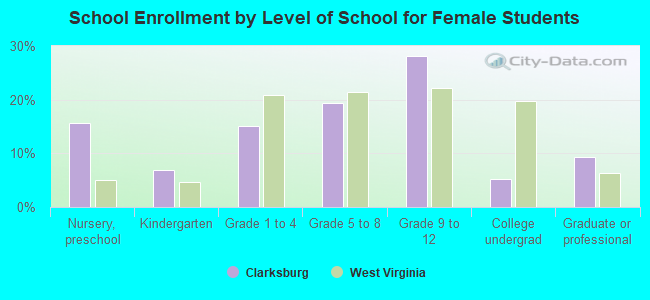
Private vs. public school enrollment:
| Here: | 5.2% |
| West Virginia: | 12.2% |
| Here: | 12.3% |
| West Virginia: | 8.8% |
| Here: | 46.2% |
| West Virginia: | 17.3% |