Collingswood, NJ (New Jersey) Houses and Residents
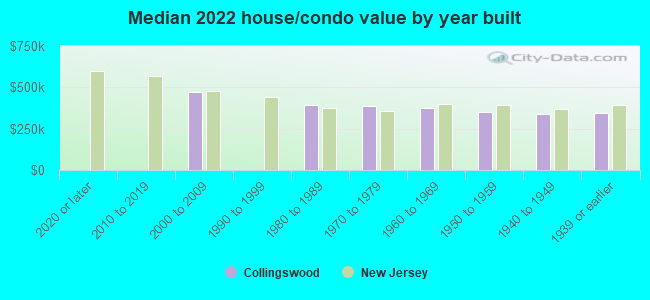
| Collingswood: | $350,790 |
| New Jersey: | $428,900 |
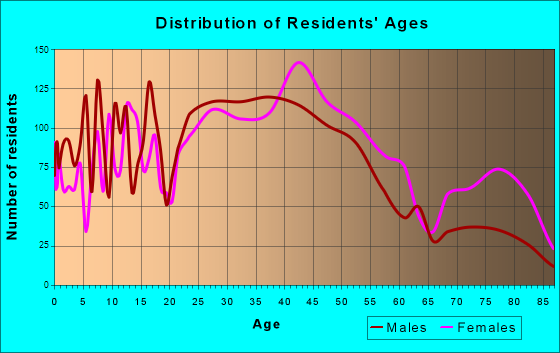
Total population: 13,962 (All urban)
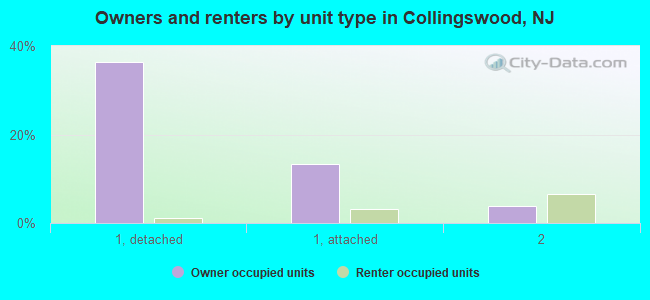
Houses: 7,123 (6,739 occupied: 3,643 owner occupied, 3,215 renter occupied)
| % of renters here: | 47% |
| State: | 35% |
Housing density: 3,896 houses/condos per square mile
Median price asked for vacant for-sale houses and condos in 2022: $308,177.
Median contract rent in 2022: $1,190 (lower quartile is $910, upper quartile is $1,523)
Median rent asked for vacant for-rent units in 2022: $1,222
Median gross rent in Collingswood, NJ in 2022: $1,250
Housing units in Collingswood with a mortgage: 2,495 (328 second mortgage, 0 home equity loan, 312 both second mortgage and home equity loan)
Houses without a mortgage: 85
Median household income for houses/condos with a mortgage: $146,911
Median household income for apartments without a mortgage: $86,483
Median monthly housing costs: $1,472
Compare current foreclosures near Collingswood, NJ:
| Photo | Address | Area | Beds / Baths | Price | Details |
|---|---|---|---|---|---|

|
#1
Strawbridge Ave
Collingswood, NJ 08108
|
1,820 sq. feet
|
- baths - beds |
show details | |

|
#2
Washington Ave Apt 605
Collingswood, NJ 08108
|
- sq. feet
|
- baths - beds |
show details | |

|
#3
E Walnut Ave
Collingswood, NJ 08108
|
1,383 sq. feet
|
- baths - beds |
show details | |

|
#4
Penn Ave
Collingswood, NJ 08108
|
- sq. feet
|
- baths - beds |
show details | |

|
#5
Belmont Ave
Collingswood, NJ 08108
|
- sq. feet
|
- baths - beds |
show details | |

|
#6
New Jersey Ave
Collingswood, NJ 08108
|
1,702 sq. feet
|
- baths - beds |
show details | |

|
#7
Emerald Ave
Collingswood, NJ 08108
|
1,192 sq. feet
|
- baths - beds |
show details | |

|
#8
Lawnside Ave
Collingswood, NJ 08108
|
1,416 sq. feet
|
- baths - beds |
show details | |

|
#9
W Madison Ave
Collingswood, NJ 08108
|
1,854 sq. feet
|
- baths - beds |
show details | |

|
#10
Linwood Ave
Collingswood, NJ 08108
|
1,368 sq. feet
|
- baths - beds |
show details |
| Photo | Address | Area | Beds / Baths | Price | Details |
|---|---|---|---|---|---|

|
#11
Park Ave
Collingswood, NJ 08108
|
1,892 sq. feet
|
- baths - beds |
show details | |

|
#12
Washington Ave Apt 806
Collingswood, NJ 08108
|
- sq. feet
|
- baths - beds |
show details | |

|
#13
Ogden Ave
Collingswood, NJ 08108
|
1,436 sq. feet
|
- baths - beds |
show details | |

|
#14
E Summerfield Ave
Collingswood, NJ 08108
|
1,547 sq. feet
|
- baths - beds |
show details | |

|
#15
W Browning Rd Apt 30a
Collingswood, NJ 08108
|
- sq. feet
|
- baths - beds |
show details | |

|
#16
W Crescent Blvd
Collingswood, NJ 08108
|
1,181 sq. feet
|
- baths - beds |
show details | |

|
#17
Ardmore Ter
Collingswood, NJ 08108
|
1,315 sq. feet
|
- baths - beds |
show details | |

|
#18
Haddon Ave # 2
Collingswood, NJ 08108
|
- sq. feet
|
- baths - beds |
show details | |

|
#19
Lincoln Ave
Collingswood, NJ 08108
|
1,230 sq. feet
|
- baths - beds |
show details | |

|
#20
Haddon Ave
Collingswood, NJ 08108
|
- sq. feet
|
- baths - beds |
show details |
| Photo | Address | Area | Beds / Baths | Price | Details |
|---|---|---|---|---|---|

|
#21
Garfield Ave Apt C
Collingswood, NJ 08108
|
- sq. feet
|
- baths - beds |
show details | |

|
#22
Fern Ave
Collingswood, NJ 08108
|
1,644 sq. feet
|
- baths - beds |
show details | |

|
#23
Hillcrest Ave
Collingswood, NJ 08108
|
1,296 sq. feet
|
- baths - beds |
show details | |

|
#24
Edwards Ave
Barrington, NJ 08007
|
1,112 sq. feet
|
1 baths 3 beds |
$325,500
|
show details |

|
#25
Yeadon Ave
Lansdowne, PA 19050
|
1,388 sq. feet
|
1 baths 3 beds |
$273,000
|
show details |

|
#26
N 59th St
Philadelphia, PA 19151
|
1,244 sq. feet
|
1 baths 3 beds |
$241,500
|
show details |

|
#27
S Alden St
Philadelphia, PA 19143
|
1,185 sq. feet
|
1 baths 3 beds |
$74,900
|
show details |

|
#28
Ashbourne Rd
Elkins Park, PA 19027
|
3,104 sq. feet
|
3 baths 6 beds |
$154,500
|
show details |

|
#29
W Oakdale Street
Philadelphia, PA 19132
|
1,152 sq. feet
|
2 baths 3 beds |
$108,900
|
show details |

|
#30
Manchester Rd
Elkins Park, PA 19027
|
3,444 sq. feet
|
2 baths 3 beds |
$559,900
|
show details |
| Photo | Address | Area | Beds / Baths | Price | Details |
|---|---|---|---|---|---|

|
#31
N Forklanding Rd
Maple Shade, NJ 08052
|
1,450 sq. feet
|
1 baths 3 beds |
$259,900
|
show details |

|
#32
Covered Bridge Rd
Cherry Hill, NJ 08034
|
1,343 sq. feet
|
1 baths 3 beds |
$465,000
|
show details |

|
#33
Browning Rd
Merchantville, NJ 08109
|
2,376 sq. feet
|
3 baths 5 beds |
$489,900
|
show details |

|
#34
S 8th St
Philadelphia, PA 19148
|
1,170 sq. feet
|
1 baths 3 beds |
$178,500
|
show details |

|
#35
Harvey Ave
Pennsauken, NJ 08110
|
1,555 sq. feet
|
2 baths 4 beds |
$429,900
|
show details |

|
#36
Beechwood Rd
Clifton Heights, PA 19018
|
2,888 sq. feet
|
2 baths 4 beds |
$472,500
|
show details |

|
#37
N Front St Apt B
Philadelphia, PA 19123
|
2,491 sq. feet
|
2 baths 3 beds |
$659,500
|
show details |

|
#38
Broadway
Westville, NJ 08093
|
1,548 sq. feet
|
1 baths 3 beds |
$259,900
|
show details |

|
#39
N 5th St
Philadelphia, PA 19126
|
1,420 sq. feet
|
2 baths 3 beds |
$313,900
|
show details |

|
#40
Cooper St
Woodbury, NJ 08096
|
936 sq. feet
|
1 baths 3 beds |
$255,000
|
show details |
| Photo | Address | Area | Beds / Baths | Price | Details |
|---|---|---|---|---|---|

|
#41
Foxglove Dr
Riverside, NJ 08075
|
840 sq. feet
|
1 baths 2 beds |
$113,683
|
show details |

|
#42
Kershaw St
Philadelphia, PA 19131
|
1,284 sq. feet
|
1 baths 3 beds |
$139,900
|
show details |

|
#43
Jessamine Ave
Oaklyn, NJ 08107
|
864 sq. feet
|
2 baths 5 beds |
$399,900
|
show details |

|
#44
Princeton Ave
Philadelphia, PA 19149
|
1,224 sq. feet
|
1 baths 3 beds |
$215,000
|
show details |

|
#45
Watson Blvd
Clementon, NJ 08021
|
1,268 sq. feet
|
1 baths 3 beds |
$289,900
|
show details |

|
#46
Christian St
Philadelphia, PA 19146
|
1,612 sq. feet
|
2 baths 5 beds |
$449,900
|
show details |

|
#47
Edgewood Ave
Audubon, NJ 08106
|
1,250 sq. feet
|
1 baths 4 beds |
$375,000
|
show details |

|
#48
E Crystal Lake Ave
Collingswood, NJ 08108
|
- sq. feet
|
- baths - beds |
show details | |

|
#49
Strawbridge Ave
Collingswood, NJ 08108
|
- sq. feet
|
- baths - beds |
show details | |

|
Check over 1 million property listings on Foreclosure.com!
|
browse all offers | |||

Latest news about housing in Collingswood, NJ collected exclusively by city-data.com from local newspapers, TV, and radio stations


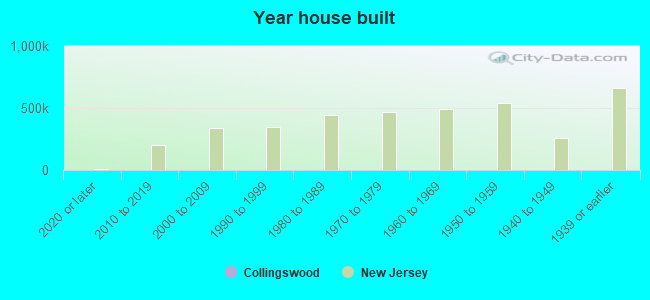
Median year apartment built: 1955
Household type by relationship:
Households: 14,197- Male householders: 3,056 (1,153 living alone), Female householders: 3,671 (1,449 living alone)
2,724 spouses (2,536 opposite-sex spouses), 530 unmarried partners, (478 opposite-sex unmarried partners), 3,184 children (2,951 natural, 61 adopted, 171 stepchildren), 229 grandchildren, 49 brothers or sisters, 81 parents, 42 foster children, 131 other relatives, 433 non-relatives
- In group quarters: 64
Size of family households: 1,798 2-persons, 827 3-persons, 654 4-persons, 121 5-persons, 50 6-persons, 27 7-or-more-persons.
Size of nonfamily households: 2,635 1-person, 691 2-persons, 26 3-persons, 25 4-persons.
1,590 married couples with children.
493 single-parent households (137 men, 356 women).
86.7% of residents of Collingswood speak English at home.
7.0% of residents speak Spanish at home (67% speak English very well, 19% speak English well, 14% speak English not well).
3.1% of residents speak other Indo-European language at home (75% speak English very well, 2% speak English well, 23% speak English not well).
0.7% of residents speak Asian or Pacific Island language at home (60% speak English very well, 30% speak English well, 10% speak English not well).
2.2% of residents speak other language at home (30% speak English very well, 46% speak English well, 24% speak English not well).
Foreign born population: 846 (6.0%)
(42.3% of them are naturalized citizens)
| Here: | 7.1 |
| State: | 6.8 |
| Here: | 3.4 |
| State: | 3.9 |
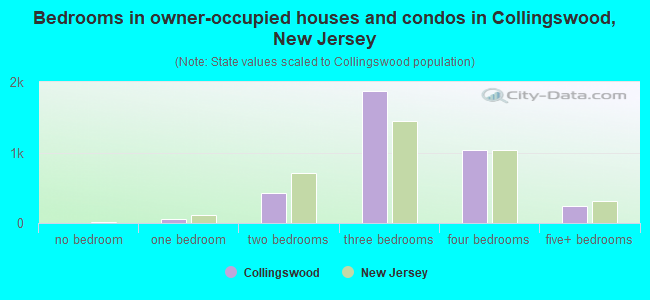
- Bedrooms in owner-occupied houses and condos in Collingswood, New Jersey
- 0no bedroom
- 621 bedroom
- 4192 bedrooms
- 1,8783 bedrooms
- 1,0424 bedrooms
- 2425+ bedrooms
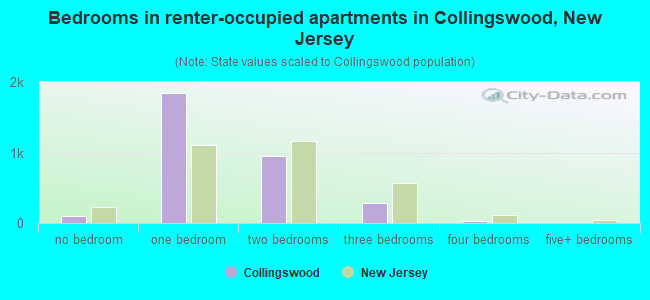
- Bedrooms in renter-occupied apartments in Collingswood, New Jersey
- 105no bedroom
- 1,8491 bedroom
- 9562 bedrooms
- 2783 bedrooms
- 274 bedrooms
- 05+ bedrooms
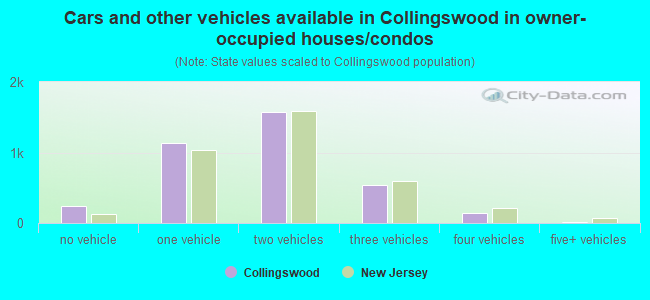
- Cars and other vehicles available in Collingswood in owner-occupied houses/condos
- 238no vehicle
- 1,1351 vehicle
- 1,5712 vehicles
- 5363 vehicles
- 1454 vehicles
- 195+ vehicles
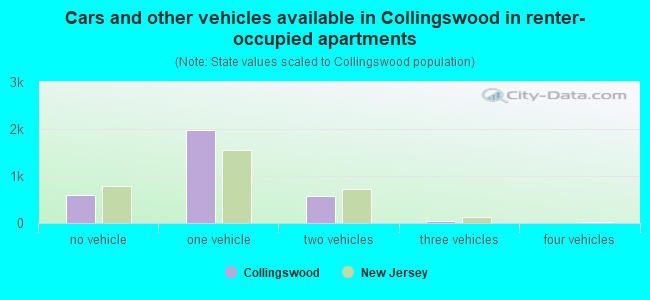
- Cars and other vehicles available in Collingswood in renter-occupied apartments
- 605no vehicle
- 1,9791 vehicle
- 5792 vehicles
- 383 vehicles
- 04 vehicles
- 145+ vehicles
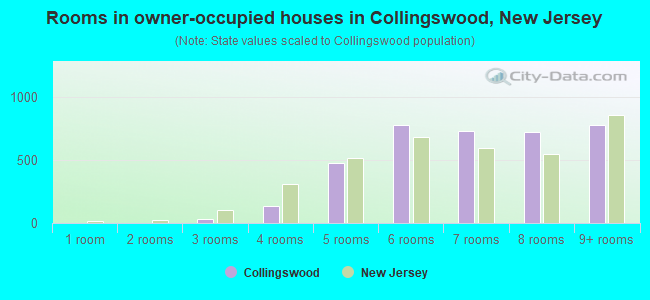
- Rooms in owner-occupied houses in Collingswood, New Jersey
- 01 room
- 02 rooms
- 353 rooms
- 1324 rooms
- 4755 rooms
- 7796 rooms
- 7257 rooms
- 7228 rooms
- 7759+ rooms
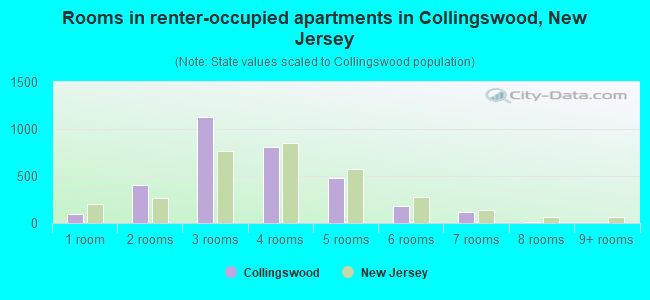
- Rooms in renter-occupied apartments in Collingswood, New Jersey
- 961 room
- 4012 rooms
- 1,1313 rooms
- 8074 rooms
- 4745 rooms
- 1796 rooms
- 1207 rooms
- 78 rooms
- 09+ rooms
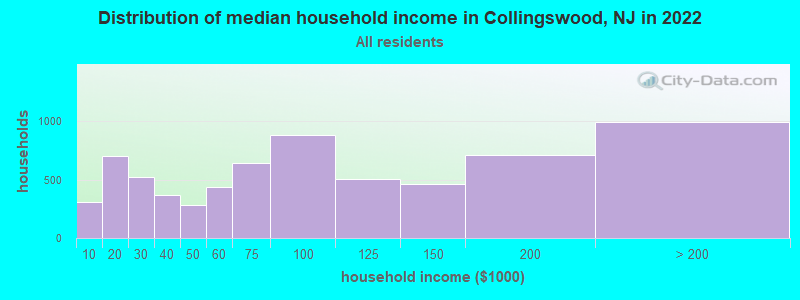
Collingswood, NJ household income distribution

- 306Less than $10,000
- 705$10,000 to $19,999
- 518$20,000 to $29,999
- 368$30,000 to $39,999
- 284$40,000 to $49,999
- 440$50,000 to $59,999
- 645$60,000 to $74,999
- 879$75,000 to $99,999
- 506$100,000 to $124,999
- 466$125,000 to $149,999
- 710$150,000 to $199,999
- 992$200,000 or more
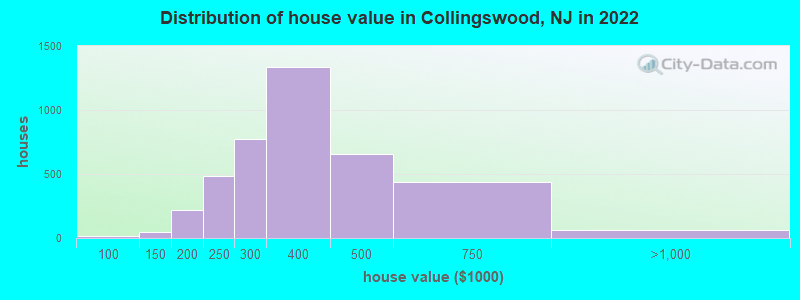
Home value of owner - occupied houses in 2022 in Collingswood, NJ
-
- 5$20,000 to $24,999
- 4$25,000 to $29,999
- 7$60,000 to $69,999
- 8$90,000 to $99,999
- 18$100,000 to $124,999
- 25$125,000 to $149,999
- 108$150,000 to $174,999
- 109$175,000 to $199,999
- 483$200,000 to $249,999
- 774$250,000 to $299,999
- 1,338$300,000 to $399,999
- 654$400,000 to $499,999
- 433$500,000 to $749,999
- 59$750,000 to $999,999
- 6$1,000,000 to $1,499,999
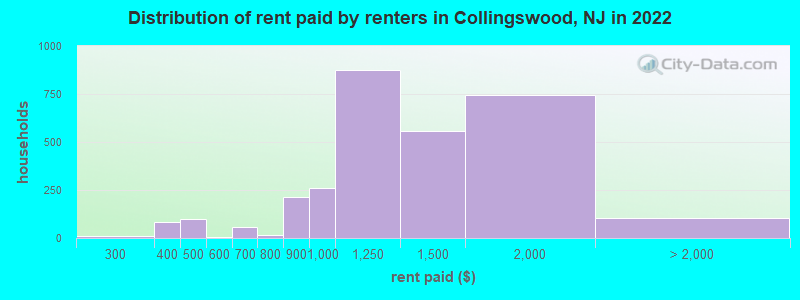
Rent paid by renters in 2022 in Collingswood, NJ
-
- 8$250 to $299
- 12$300 to $349
- 69$350 to $399
- 99$400 to $449
- 5$550 to $599
- 24$600 to $649
- 34$650 to $699
- 15$750 to $799
- 211$800 to $899
- 262$900 to $999
- 876$1,000 to $1,249
- 557$1,250 to $1,499
- 743$1,500 to $1,999
- 62$2,000 to $2,499
- 40No cash rent
Percentage of workers working in this county: 58.5%
Number of people working at home: 1,905 (23.9% of all workers)
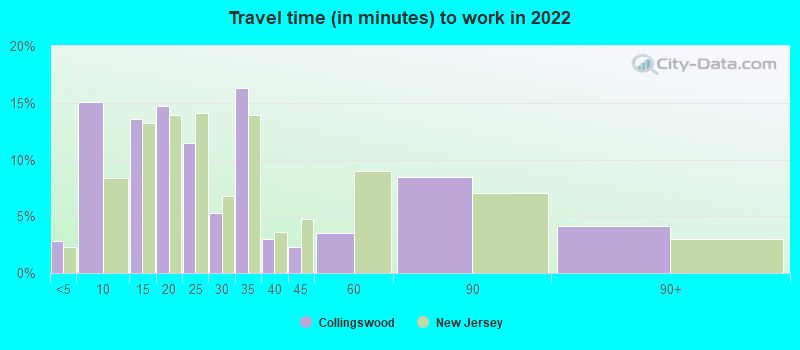
Travel time to work (commute)
- Less than 5 minutes: 125
- 5 to 9 minutes: 445
- 10 to 14 minutes: 727
- 15 to 19 minutes: 916
- 20 to 24 minutes: 894
- 25 to 29 minutes: 605
- 30 to 34 minutes: 879
- 35 to 39 minutes: 524
- 40 to 44 minutes: 270
- 45 to 59 minutes: 519
- 60 to 89 minutes: 300
- 90 or more minutes: 76
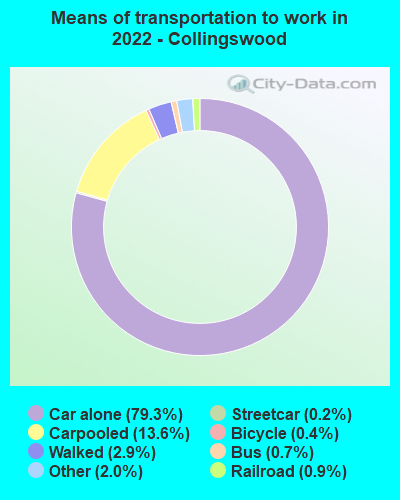
Means of transportation to work:
- Drove a car alone: 2,965 (52.7%)
- Carpooled: 672 (11.9%)
- Bus: 33 (0.6%)
- Subway or elevated rail: 7 (0.1%)
- Light rail, streetcar or trolley: 33 (0.6%)
- Taxi: 114 (2.0%)
- Bicycle: 14 (0.2%)
- Walked: 154 (2.7%)
- Worked at home: 1,905 (33.8%)
- Unemployment by race in 2022
- Unemployment rate for White non-Hispanic residents
- 8.8%Males
- 4.6%Females
- Unemployment rate for Black residents
- 15.4%Males
- Unemployment rate for other race residents
- 39.6%Males
- Unemployment rate for two or more race residents
- 0.9%Females
- Unemployment rate for Hispanic or Latino residents
- 10.9%Males
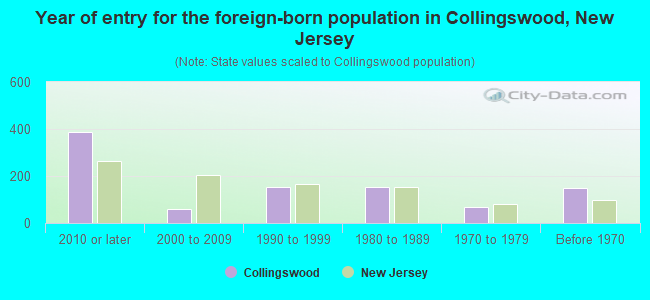
- Year of entry for the foreign-born population in Collingswood, New Jersey
- 3872010 or later
- 602000 to 2009
- 1521990 to 1999
- 1521980 to 1989
- 681970 to 1979
- 150Before 1970
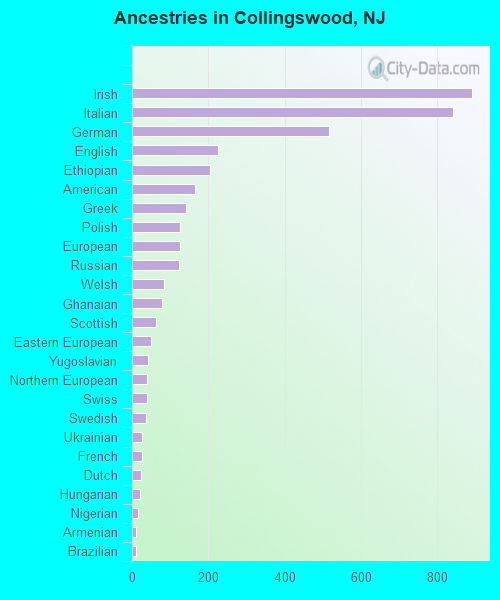
First ancestries reported:
- Irish: 891 (15.6%)
- Italian: 842 (14.8%)
- German: 516 (9.0%)
- English: 226 (4.0%)
- Ethiopian: 204 (3.6%)
- American: 164 (2.9%)
- Greek: 142 (2.5%)
- Polish: 126 (2.2%)
- European: 125 (2.2%)
- Russian: 122 (2.1%)
- Welsh: 84 (1.5%)
- Ghanaian: 78 (1.4%)
- Scottish: 64 (1.1%)
- Eastern European: 50 (0.9%)
- Yugoslavian: 41 (0.7%)
- Northern European: 40 (0.7%)
- Swiss: 39 (0.7%)
- Swedish: 37 (0.6%)
- Ukrainian: 27 (0.5%)
- French: 25 (0.4%)
- Dutch: 24 (0.4%)
- Hungarian: 22 (0.4%)
- Nigerian: 17 (0.3%)
- Armenian: 10 (0.2%)
- Brazilian: 10 (0.2%)
- Syrian: 8 (0.1%)
- Lithuanian: 8 (0.1%)
- Norwegian: 7 (0.1%)
- Romanian: 7 (0.1%)
- Scandinavian: 7 (0.1%)
- British: 7 (0.1%)
- Scotch-Irish: 6 (0.1%)
- Palestinian: 5 (0.09%)
- Celtic: 5 (0.09%)
Most common places of birth for foreign-born residents (%):
| Collingswood: | 16.7% (138) |
| New Jersey: | 0.1% (2,083) |
| Collingswood: | 7.2% (60) |
| New Jersey: | 0.8% (17,949) |
| Collingswood: | 7.0% (58) |
| New Jersey: | 0.1% (1,406) |
| Collingswood: | 6.8% (56) |
| New Jersey: | 9.7% (209,055) |
| Collingswood: | 5.4% (45) |
| New Jersey: | 0.6% (12,793) |
| Collingswood: | 5.4% (45) |
| New Jersey: | 0.9% (18,317) |
| Collingswood: | 4.2% (35) |
| New Jersey: | 0.3% (5,500) |
| Collingswood: | 3.5% (29) |
| New Jersey: | 0.1% (1,396) |
| Collingswood: | 3.4% (28) |
| New Jersey: | 0.7% (15,644) |
| Collingswood: | 3.4% (28) |
| New Jersey: | 3.7% (78,969) |
| Collingswood: | 2.9% (24) |
| New Jersey: | 2.3% (48,811) |
| Collingswood: | 2.5% (21) |
| New Jersey: | 4.0% (85,934) |
| Collingswood: | 2.5% (21) |
| New Jersey: | 4.4% (95,275) |
| Collingswood: | 2.4% (20) |
| New Jersey: | 1.5% (33,198) |
| Collingswood: | 2.1% (17) |
| New Jersey: | 0.5% (10,246) |
| Collingswood: | 1.9% (16) |
| New Jersey: | 0.5% (10,886) |
| Collingswood: | 1.8% (15) |
| New Jersey: | 0.1% (2,616) |
| Collingswood: | 1.7% (14) |
| New Jersey: | 0.0% (1,054) |
| Collingswood: | 1.6% (13) |
| New Jersey: | 0.4% (7,791) |
| Collingswood: | 1.6% (13) |
| New Jersey: | 0.3% (6,882) |
| Collingswood: | 1.6% (13) |
| New Jersey: | 0.8% (17,217) |
Place of birth for U.S.-born residents:
- This state: 6,836
- Other state: 6,228
- Northeast: 4,609
- Midwest: 539
- South: 757
- West: 306
91.9% of Collingswood residents lived in the same house 1 years ago.
Out of people who lived in different houses, 24.3% lived in this county.
Out of people who lived in different counties, 14.0% lived in New Jersey.
| Collingswood: | 91.9% |
| State average: | 90.4% |
Education attainment for males 25 years and older:
- No schooling: 11
- Nursery to 4th grade: 0
- 5th and 6th grade: 0
- 7th and 8th grade: 2
- 9th grade: 0
- 10th grade: 36
- 11th grade: 14
- 12th grade, no diploma: 13
- High school graduate (or equivalency): 1,182
- Less than 1 year of college: 233
- Some college more than 1 year, no degree: 607
- Associate degree: 393
- Bachelor's degree: 1,506
- Master's degree: 688
- Professional school degree: 213
- Doctorate degree: 339

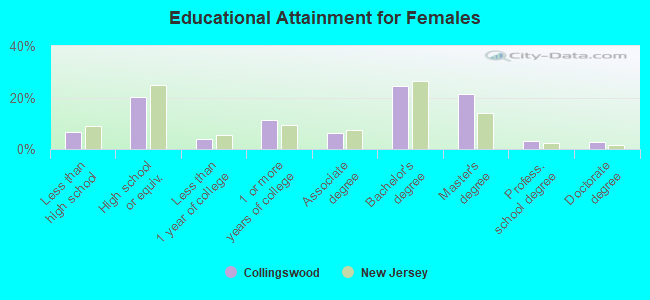
Education attainment for females 25 years and older:
- No schooling: 45
- Nursery to 4th grade: 7
- 5th and 6th grade: 0
- 7th and 8th grade: 94
- 9th grade: 77
- 10th grade: 41
- 11th grade: 61
- 12th grade, no diploma: 44
- High school graduate (or equivalency): 1,136
- Less than 1 year of college: 222
- Some college more than 1 year, no degree: 640
- Associate degree: 354
- Bachelor's degree: 1,362
- Master's degree: 1,188
- Professional school degree: 179
- Doctorate degree: 158


Housing units in structures:
- One, detached: 2,606
- One, attached: 1,121
- Two: 694
- 3 or 4: 324
- 5 to 9: 145
- 10 to 19: 432
- 20 to 49: 259
- 50 or more: 1,538
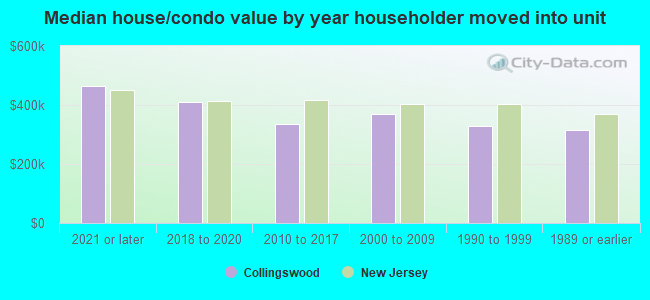
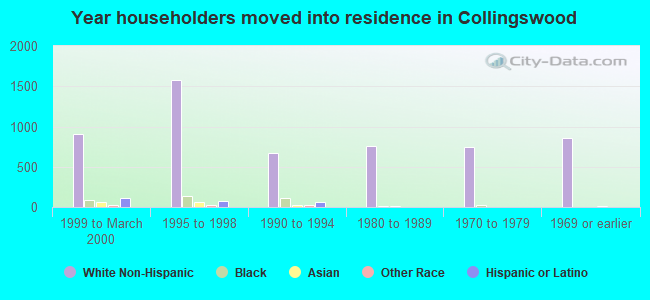
House/condo owner moved in on average 13 years ago
Renter moved in on average 2 years ago
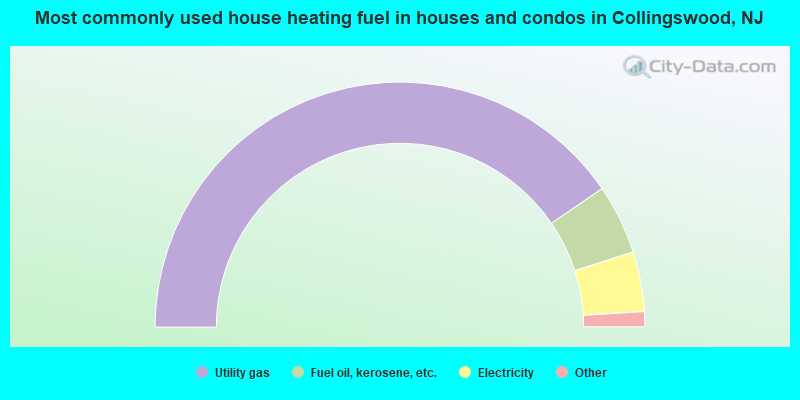
- 80.9%Utility gas
- 9.2%Fuel oil, kerosene, etc.
- 7.9%Electricity
- 1.0%No fuel used
- 0.6%Bottled, tank, or LP gas
- 0.2%Solar energy
- 0.2%Other fuel
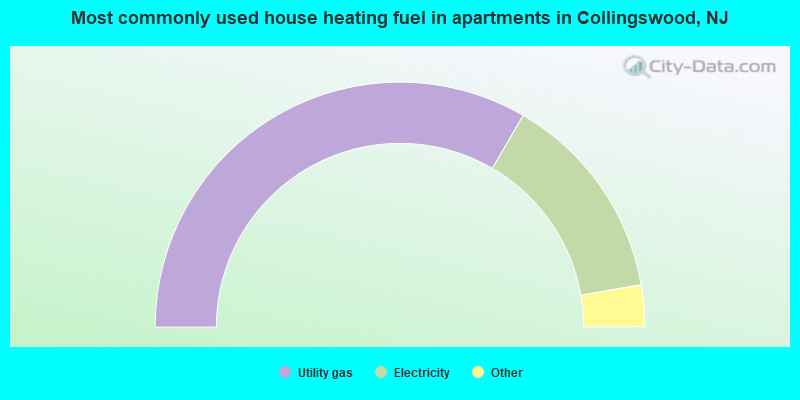
- 66.8%Utility gas
- 27.7%Electricity
- 2.4%Fuel oil, kerosene, etc.
- 1.7%No fuel used
- 0.9%Bottled, tank, or LP gas
- 0.5%Other fuel
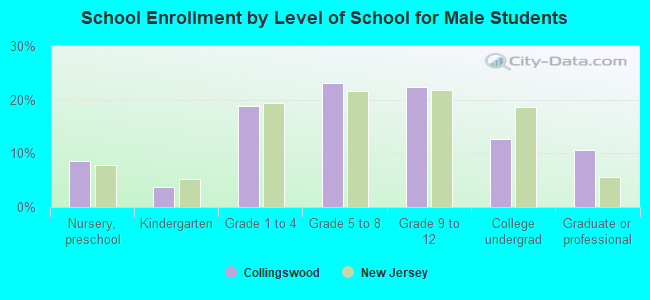
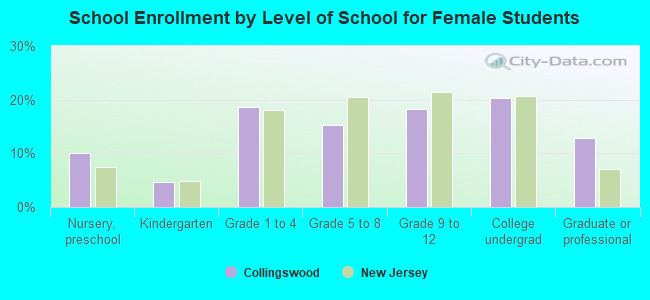
Private vs. public school enrollment:
| Here: | 2.1% |
| New Jersey: | 12.3% |
| Here: | 1.4% |
| New Jersey: | 13.1% |
| Here: | 11.9% |
| New Jersey: | 33.2% |