Colonial Park, PA (Pennsylvania) Houses and Residents
Estimated median house or condo value in 2022: $212,388 (it was $104,200 in 2000 )
Colonial Park:
$212,388Pennsylvania:
$245,500
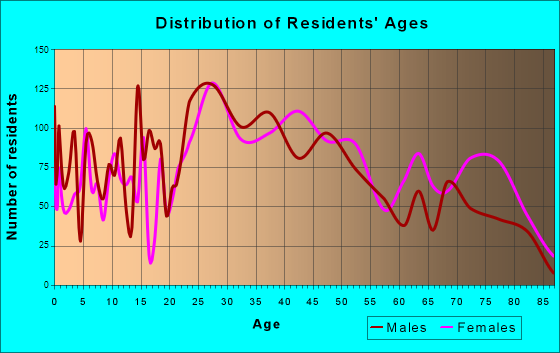
Lower value quartile - upper value quartile: $165,694 - $268,956Total population: 13,229 (Urban population: 13,147, Rural population: 0)
Houses: 7,179 (6,809 occupied: 3,537 owner occupied, 3,465 renter occupied )
% of renters here:
49%State:
31%
Housing density: 1,530 houses/condos per square mile
Median price asked for vacant for-sale houses and condos in 2022 in this county: $184,437.
Median contract rent in 2022: $1,090 (lower quartile is $968, upper quartile is $1,257)
Median rent asked for vacant for-rent units in 2022: $857
Median gross rent in Colonial Park, PA in 2022: $1,229
Housing units in Colonial Park with a mortgage: 2,036 (255 second mortgage, 14 home equity loan, 256 both second mortgage and home equity loan )Houses without a mortgage: 138
Median household income for houses/condos with a mortgage: $84,527
Median household income for apartments without a mortgage: $68,885
Median monthly housing costs: $1,164
Data:
Median house or condo value ($)
Median house or condo value ($ change since 2000)
Median house or condo value ($) - White
Median house or condo value ($) - Black or African American
Median house or condo value ($) - Asian
Median house or condo value ($) - Hispanic or Latino
Median house or condo value ($) - American Indian and Alaska Native
Median house or condo value ($) - Multirace
Median house or condo value ($) - Other Race
Median price asked for mobile homes ($)
Household density (households per square mile)
Mean house or condo value by units in structure - 1, detached ($)
Mean house or condo value by units in structure - 1, attached ($)
Mean house or condo value by units in structure - 2 ($)
Mean house or condo value by units in structure by units in structure - 3 or 4 ($)
Mean house or condo value by units in structure - 5 or more ($)
Mean house or condo value by units in structure - Boat, RV, van, etc. ($)
Mean house or condo value by units in structure - Mobile home ($)
Median contract rent ($)
Median contract rent - Lower quartile ($)
Median contract rent - Upper quartile ($)
Median gross rent ($)
Urban houses (%)
Rural houses (%)
Houses occupied (%)
Houses occupied (% change since 2000)
Houses owner occupied (%)
Houses owner occupied (% change since 2000)
Houses renter occupied (%)
Houses renter occupied (% change since 2000)
Vacant housing units - For rent (%)
Vacant housing units - For rent (% change since 2000)
Vacant housing units - For sale only (%)
Vacant housing units - For sale only (% change since 2000)
Vacant housing units - Rented or sold, not occupied (%)
Vacant housing units - Rented or sold, not occupied (% change since 2000)
Vacant housing units - For seasonal, recreational, or occasional use (%)
Vacant housing units - For seasonal, recreational, or occasional use (% change since 2000)
Vacant housing units - For migrant workers (%)
Vacant housing units - For migrant workers (% change since 2000)
Vacant housing units - Other vacant (%)
Vacant housing units - Other vacant (% change since 2000)
Median monthly housing costs ($)
Median household income for houses/condos with a mortgage ($)
Median household income for houses/condos without a mortgage ($)
Median household income ($)
Median household income ($) - White
Median household income ($) - Black or African American
Median household income ($) - Asian
Median household income ($) - Hispanic or Latino
Median household income ($) - American Indian and Alaska Native
Median household income ($) - Multirace
Median household income ($) - Other Race
Mortgage status - with mortgage (%)
Mortgage status - with second mortgage (%)
Mortgage status - with home equity loan (%)
Mortgage status - with both second mortgage and home equity loan (%)
Mortgage status - without a mortgage (%)
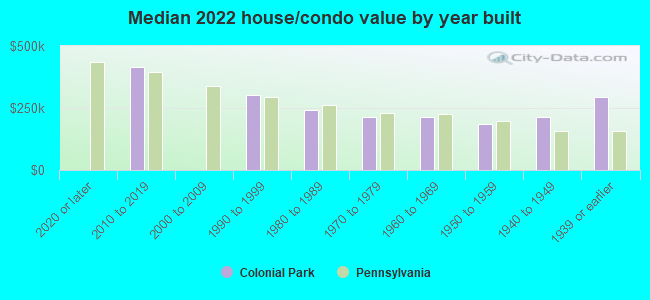
Median year house/condo built
Median year apartment built
Household type by relationship - Male householder living alone (%)
Household type by relationship - Male householder not living alone (%)
Household type by relationship - Female householder living alone (%)
Household type by relationship - Female householder not living alone (%)
Household type by relationship - Opposite-Sex spouse (%)
Household type by relationship - Same-Sex spouse (%)
Household type by relationship - Opposite-Sex unmarried partner (%)
Household type by relationship - Same-Sex unmarried partner (%)
Household type by relationship - In group quarters (%)
Size of family households - 2-person household (%)
Size of family households - 3-person household (%)
Size of family households - 4-person household (%)
Size of family households - 5-person household (%)
Size of family households - 6-person household (%)
Size of family households - 7-or-more-person household (%)
Size of nonfamily households - 1-person household (%)
Size of nonfamily households - 2-person household (%)
Size of nonfamily households - 3-person household (%)
Size of nonfamily households - 4-person household (%)
Size of nonfamily households - 5-person household (%)
Size of nonfamily households - 6-person household (%)
Size of nonfamily households - 7-or-moreperson household (%)
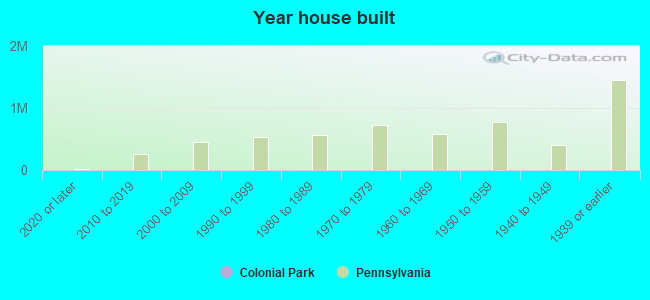
Year house built - Built 2010 or later (%)
Year house built - Built 2000 to 2009 (%)
Year house built - Built 1990 to 1999 (%)
Year house built - Built 1980 to 1989 (%)
Year house built - Built 1970 to 1979 (%)
Year house built - Built 1960 to 1969 (%)
Year house built - Built 1950 to 1959 (%)
Year house built - Built 1940 to 1949 (%)
Year house built - Built 1939 or earlier (%)
Median number of rooms in houses and condos
Median number of rooms in apartments
Median number of bedrooms in owner occupied houses
Mean number of bedrooms in owner occupied houses
Median number of bedrooms in renter occupied houses
Mean number of bedrooms in renter occupied houses
Median number of vehichles in owner occupied houses
Mean number of vehichles in owner occupied houses
Median number of vehichles in renter occupied houses
Mean number of vehichles in renter occupied houses
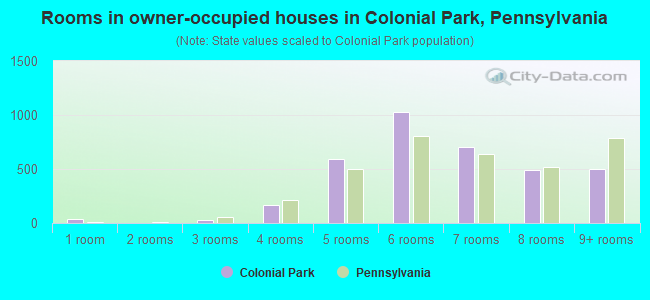
Rooms in owner-occupied houses - 1 room (%)
Rooms in owner-occupied houses - 2 rooms (%)
Rooms in owner-occupied houses - 3 rooms (%)
Rooms in owner-occupied houses - 4 rooms (%)
Rooms in owner-occupied houses - 5 rooms (%)
Rooms in owner-occupied houses - 6 rooms (%)
Rooms in owner-occupied houses - 7 rooms (%)
Rooms in owner-occupied houses - 8 rooms (%)
Rooms in owner-occupied houses - 9+ rooms (%)
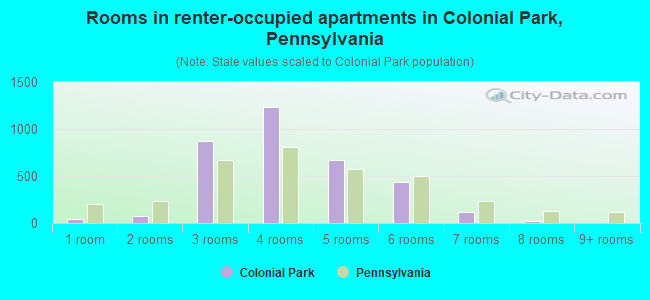
Rooms in renter-occupied houses - 1 room (%)
Rooms in renter-occupied houses - 2 rooms (%)
Rooms in renter-occupied houses - 3 rooms (%)
Rooms in renter-occupied houses - 4 rooms (%)
Rooms in renter-occupied houses - 5 rooms (%)
Rooms in renter-occupied houses - 6 rooms (%)
Rooms in renter-occupied houses - 7 rooms (%)
Rooms in renter-occupied houses - 8 rooms (%)
Rooms in renter-occupied houses - 9+ rooms (%)
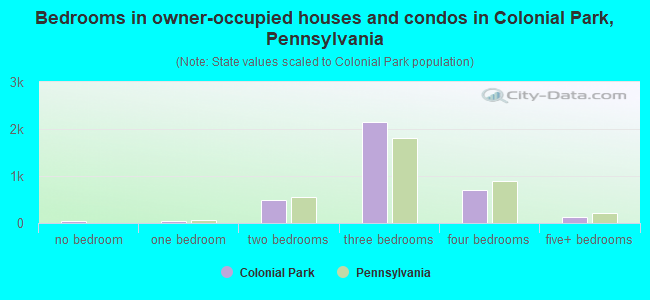
Bedrooms in owner-occupied houses - no bedrooms (%)
Bedrooms in owner-occupied houses - 1 bedroom (%)
Bedrooms in owner-occupied houses - 2 bedrooms (%)
Bedrooms in owner-occupied houses - 3 bedrooms (%)
Bedrooms in owner-occupied houses - 4 bedrooms (%)
Bedrooms in owner-occupied houses - 5+ bedrooms (%)
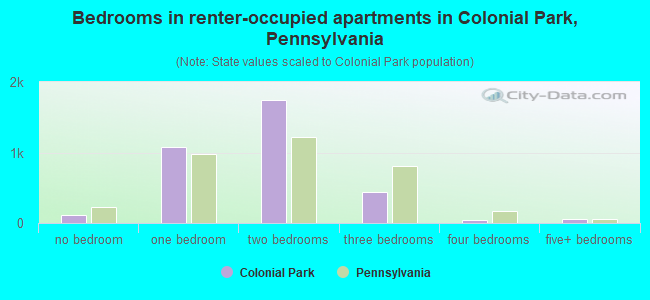
Bedrooms in renter-occupied houses - no bedrooms (%)
Bedrooms in renter-occupied houses - 1 bedroom (%)
Bedrooms in renter-occupied houses - 2 bedrooms (%)
Bedrooms in renter-occupied houses - 3 bedrooms (%)
Bedrooms in renter-occupied houses - 4 bedrooms (%)
Bedrooms in renter-occupied houses - 5+ bedrooms (%)
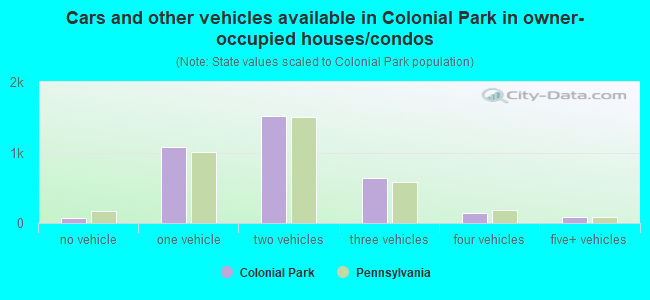
Vehicles available in owner-occupied houses - no vehicle available (%)
Vehicles available in owner-occupied houses - 1 vehicle available(%)
Vehicles available in owner-occupied houses - 2 Vehicles available (%)
Vehicles available in owner-occupied houses - 3 Vehicles available (%)
Vehicles available in owner-occupied houses - 4 Vehicles available (%)
Vehicles available in owner-occupied houses - 5+ Vehicles available (%)
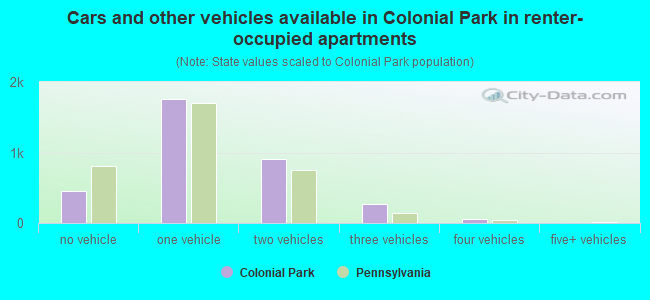
Vehicles available in renter-occupied houses - no vehicle available (%)
Vehicles available in renter-occupied houses - 1 vehicle available (%)
Vehicles available in renter-occupied houses - 2 Vehicles available (%)
Vehicles available in renter-occupied houses - 3 Vehicles available (%)
Vehicles available in renter-occupied houses - 4 Vehicles available (%)
Vehicles available in renter-occupied houses - 5+ Vehicles available (%)
Housing units in structures - 1, detached (%)
Housing units in structures - 1, attached (%)
Housing units in structures - 2 (%)
Housing units in structures - 3 or 4 (%)
Housing units in structures - 5 to 9 (%)
Housing units in structures - 10 to 19 (%)
Housing units in structures - 20 to 49 (%)
Housing units in structures - 50 or more (%)
Housing units in structures - Mobile home (%)
Housing units in structures - Boat, RV, van, etc. (%)
Housing units in structures - Owners - 1, detached (%)
Housing units in structures - Owners - 1, attached (%)
Housing units in structures - Owners - 2 (%)
Housing units in structures - Owners - 3 or 4 (%)
Housing units in structures - Owners - 5 to 9 (%)
Housing units in structures - Owners - 10 to 19 (%)
Housing units in structures - Owners - 20 to 49 (%)
Housing units in structures - Owners - 50 or more (%)
Housing units in structures - Owners - Mobile home (%)
Housing units in structures - Owners - Boat, RV, van, etc. (%)
Housing units in structures - Renters - 1, detached (%)
Housing units in structures - Renters - 1, attached (%)
Housing units in structures - Renters - 2 (%)
Housing units in structures - Renters - 3 or 4 (%)
Housing units in structures - Renters - 5 to 9 (%)
Housing units in structures - Renters - 10 to 19 (%)
Housing units in structures - Renters - 20 to 49 (%)
Housing units in structures - Renters - 50 or more (%)
Housing units in structures - Renters - Mobile home (%)
Housing units in structures - Renters - Boat, RV, van, etc. (%)
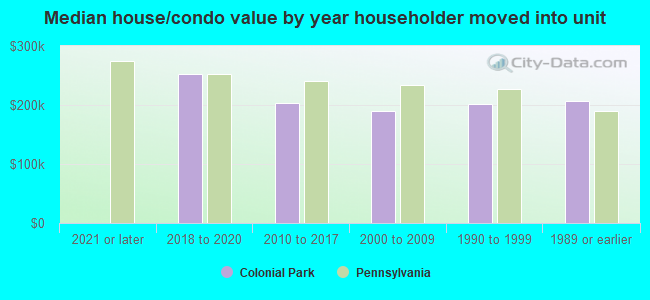
House/condo owner moved in on average (years ago)
Renter moved in on average (years ago)
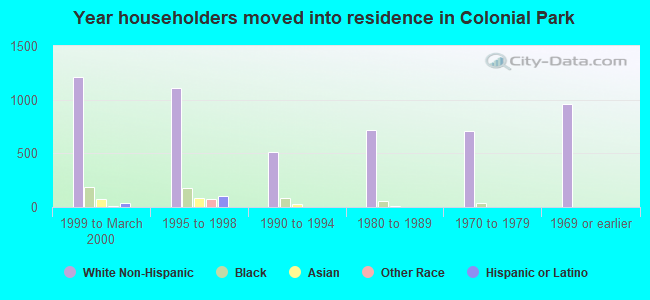
Year householder moved into unit - Moved in 1999 to March 2000 (%)
Year householder moved into unit - Moved in 1999 to March 2000 (%) - White
Year householder moved into unit - Moved in 1999 to March 2000 (%) - Black or African American
Year householder moved into unit - Moved in 1999 to March 2000 (%) - Asian
Year householder moved into unit - Moved in 1999 to March 2000 (%) - Hispanic or Latino
Year householder moved into unit - Moved in 1999 to March 2000 (%) - American Indian and Alaska Native
Year householder moved into unit - Moved in 1999 to March 2000 (%) - Multirace
Year householder moved into unit - Moved in 1999 to March 2000 (%) - Other Race
Year householder moved into unit - Moved in 1995 to 1998 (%)
Year householder moved into unit - Moved in 1995 to 1998 (%) - White
Year householder moved into unit - Moved in 1995 to 1998 (%) - Black or African American
Year householder moved into unit - Moved in 1995 to 1998 (%) - Asian
Year householder moved into unit - Moved in 1995 to 1998 (%) - Hispanic or Latino
Year householder moved into unit - Moved in 1995 to 1998 (%) - American Indian and Alaska Native
Year householder moved into unit - Moved in 1995 to 1998 (%) - Multirace
Year householder moved into unit - Moved in 1995 to 1998 (%) - Other Race
Year householder moved into unit - Moved in 1990 to 1994 (%)
Year householder moved into unit - Moved in 1990 to 1994 (%) - White
Year householder moved into unit - Moved in 1990 to 1994 (%) - Black or African American
Year householder moved into unit - Moved in 1990 to 1994 (%) - Asian
Year householder moved into unit - Moved in 1990 to 1994 (%) - Hispanic or Latino
Year householder moved into unit - Moved in 1990 to 1994 (%) - American Indian and Alaska Native
Year householder moved into unit - Moved in 1990 to 1994 (%) - Multirace
Year householder moved into unit - Moved in 1990 to 1994 (%) - Other Race
Year householder moved into unit - Moved in 1980 to 1989 (%)
Year householder moved into unit - Moved in 1980 to 1989 (%) - White
Year householder moved into unit - Moved in 1980 to 1989 (%) - Black or African American
Year householder moved into unit - Moved in 1980 to 1989 (%) - Asian
Year householder moved into unit - Moved in 1980 to 1989 (%) - Hispanic or Latino
Year householder moved into unit - Moved in 1980 to 1989 (%) - American Indian and Alaska Native
Year householder moved into unit - Moved in 1980 to 1989 (%) - Multirace
Year householder moved into unit - Moved in 1980 to 1989 (%) - Other Race
Year householder moved into unit - Moved in 1970 to 1979 (%)
Year householder moved into unit - Moved in 1970 to 1979 (%) - White
Year householder moved into unit - Moved in 1970 to 1979 (%) - Black or African American
Year householder moved into unit - Moved in 1970 to 1979 (%) - Asian
Year householder moved into unit - Moved in 1970 to 1979 (%) - Hispanic or Latino
Year householder moved into unit - Moved in 1970 to 1979 (%) - American Indian and Alaska Native
Year householder moved into unit - Moved in 1970 to 1979 (%) - Multirace
Year householder moved into unit - Moved in 1970 to 1979 (%) - Other Race
Year householder moved into unit - Moved in 1969 or earlier (%)
Year householder moved into unit - Moved in 1969 or earlier (%) - White
Year householder moved into unit - Moved in 1969 or earlier (%) - Black or African American
Year householder moved into unit - Moved in 1969 or earlier (%) - Asian
Year householder moved into unit - Moved in 1969 or earlier (%) - Hispanic or Latino
Year householder moved into unit - Moved in 1969 or earlier (%) - American Indian and Alaska Native
Year householder moved into unit - Moved in 1969 or earlier (%) - Multirace
Year householder moved into unit - Moved in 1969 or earlier (%) - Other Race
Housing units lacking complete plumbing facilities (%)
Housing units lacking complete kitchen facilities (%)
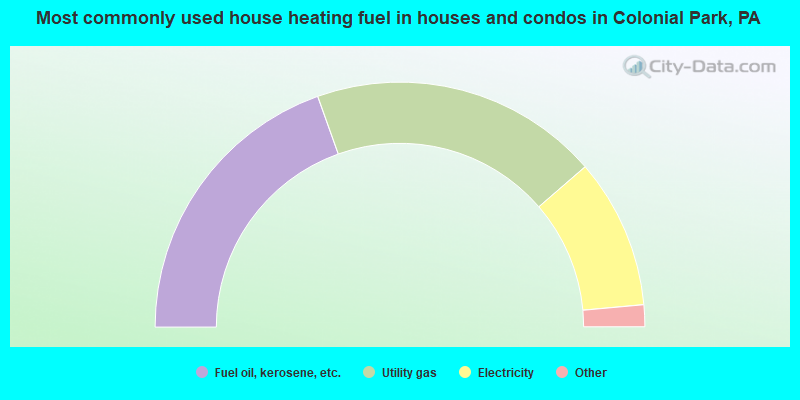
House heating fuel used in houses and condos - Utility gas (%)
House heating fuel used in houses and condos - Bottled, tank, or LP gas (%)
House heating fuel used in houses and condos - Electricity (%)
House heating fuel used in houses and condos - Fuel oil, kerosene, etc. (%)
House heating fuel used in houses and condos - Coal or coke (%)
House heating fuel used in houses and condos - Wood (%)
House heating fuel used in houses and condos - Solar energy (%)
House heating fuel used in houses and condos - Other fuel (%)
House heating fuel used in houses and condos - No fuel used (%)
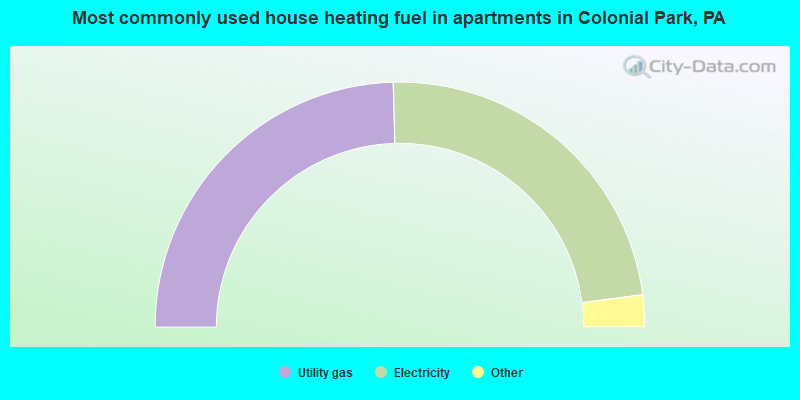
House heating fuel used in apartments - Utility gas (%)
House heating fuel used in apartments - Bottled, tank, or LP gas (%)
House heating fuel used in apartments - Electricity (%)
House heating fuel used in apartments - Fuel oil, kerosene, etc. (%)
House heating fuel used in apartments - Coal or coke (%)
House heating fuel used in apartments - Wood (%)
House heating fuel used in apartments - Solar energy (%)
House heating fuel used in apartments - Other fuel (%)
House heating fuel used in apartments - No fuel used (%)
Median year house/condo built: 1960Median year apartment built: 1976Household type by relationship:
Households: 17,049
Male householders: 3,113 (842 living alone ), Female householders: 3,696 (1,236 living alone )3,086 spouses (2,949 opposite-sex spouses ), 488 unmarried partners , (447 opposite-sex unmarried partners ), 4,574 children (4,223 natural , 223 adopted , 128 stepchildren ), 521 grandchildren , 205 brothers or sisters , 470 parents , 0 foster children , 194 other relatives , 483 non-relatives In group quarters: 213
Size of family households: 2,157 2-persons , 622 3-persons , 638 4-persons , 552 5-persons , 118 6-persons , 42 7-or-more-persons .
Size of nonfamily households: 2,136 1-person , 775 2-persons , 41 3-persons .
2,643 married couples with children. single-parent households (281 men , 489 women ).
82.5% of residents of Colonial Park speak English at home. of residents speak Spanish at home (55% speak English very well , 11% speak English well , 22% speak English not well , 12% don't speak English at all ).of residents speak other Indo-European language at home (52% speak English very well , 25% speak English well , 14% speak English not well , 9% don't speak English at all ).of residents speak Asian or Pacific Island language at home (22% speak English very well , 21% speak English well , 42% speak English not well , 16% don't speak English at all ).of residents speak other language at home (48% speak English very well , 44% speak English well , 8% speak English not well ).
Foreign born population: 3,494 (20.5%)of them are naturalized citizens )
Median number of rooms in houses and condos:
Median number of rooms in apartments
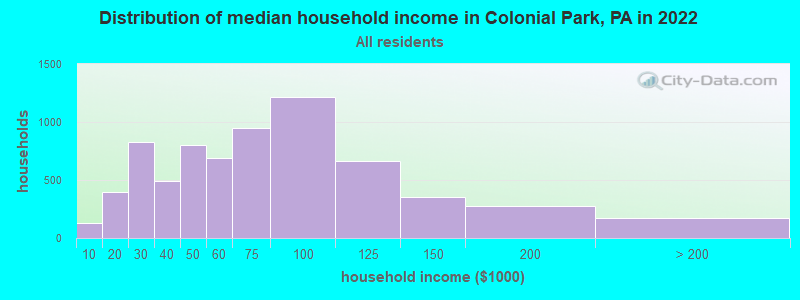
Colonial Park, PA household income distribution 132 Less than $10,000400 $10,000 to $19,999826 $20,000 to $29,999494 $30,000 to $39,999798 $40,000 to $49,999691 $50,000 to $59,999946 $60,000 to $74,9991,213 $75,000 to $99,999665 $100,000 to $124,999352 $125,000 to $149,999277 $150,000 to $199,999172 $200,000 or more
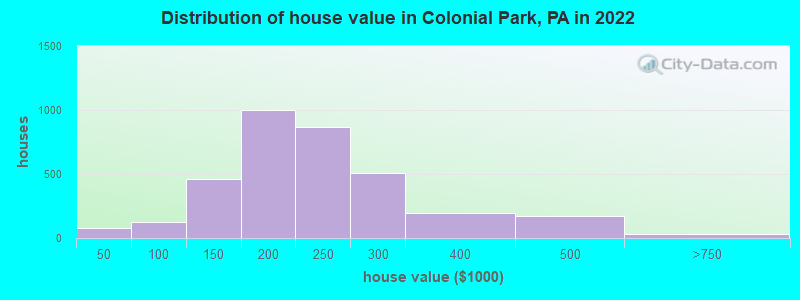
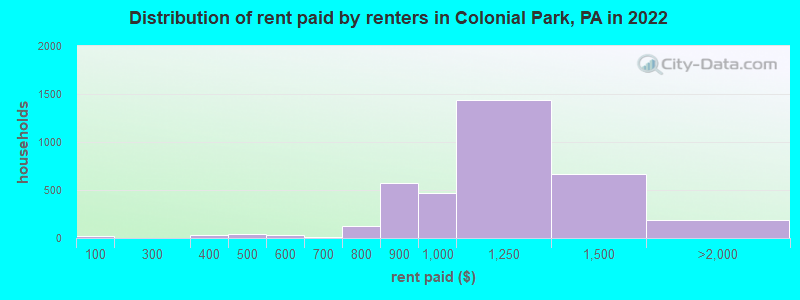
Home value of owner - occupied houses in 2022 in Colonial Park, PA 60 Less than $10,00015 $10,000 to $14,99943 $80,000 to $89,99981 $90,000 to $99,999249 $100,000 to $124,999212 $125,000 to $149,999626 $150,000 to $174,999374 $175,000 to $199,999865 $200,000 to $249,999508 $250,000 to $299,999195 $300,000 to $399,999170 $400,000 to $499,99929 $500,000 to $749,999Rent paid by renters in 2022 in Colonial Park, PA 19 Less than $10027 $300 to $3494 $400 to $44940 $450 to $49915 $500 to $54915 $550 to $59914 $600 to $64940 $700 to $74988 $750 to $799572 $800 to $899463 $900 to $9991,439 $1,000 to $1,249663 $1,250 to $1,499170 $1,500 to $1,99919 No cash rent
Percentage of workers working in this county: 75.6%Number of people working at home: 1,409 (16.7% of all workers )
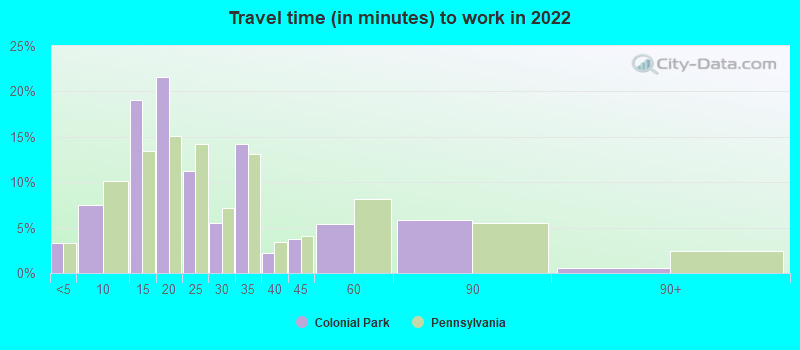
Travel time to work (commute)
Less than 5 minutes: 1735 to 9 minutes: 64710 to 14 minutes: 1,14015 to 19 minutes: 1,25920 to 24 minutes: 76325 to 29 minutes: 80430 to 34 minutes: 1,13935 to 39 minutes: 14340 to 44 minutes: 55245 to 59 minutes: 36660 to 89 minutes: 4290 or more minutes: 108
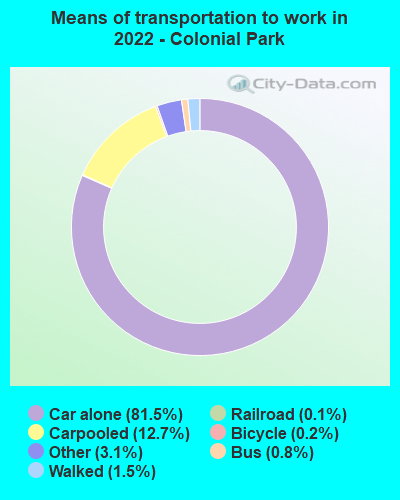
Means of transportation to work:
Drove a car alone: 5,717 (68.8%)Carpooled: 770 (9.3%)Bus : 59 (0.7%)Light rail, streetcar or trolley : 9 (0.1%)Taxi: 302 (3.6%)Bicycle: 11 (0.1%)Walked: 112 (1.3%)Worked at home: 1,409 (17.0%)
Unemployment by race in 2022
Unemployment rate for White non-Hispanic residents 3.6% Males3.3% FemalesUnemployment rate for Black residents 8.4% Males16.4% FemalesUnemployment rate for Asian residents 10.1% FemalesUnemployment rate for other race residents 13.8% MalesUnemployment rate for two or more race residents 4.9% Males
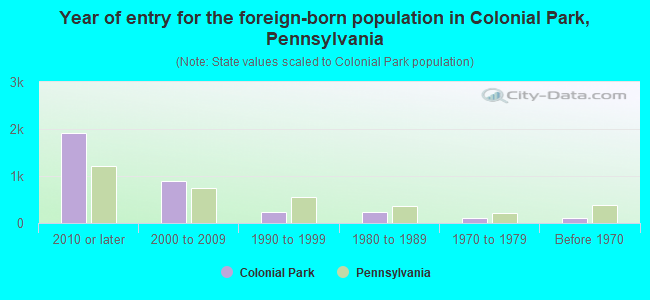
Year of entry for the foreign-born population in Colonial Park, Pennsylvania
1,914 2010 or later 883 2000 to 2009 234 1990 to 1999 224 1980 to 1989 104 1970 to 1979 112 Before 1970
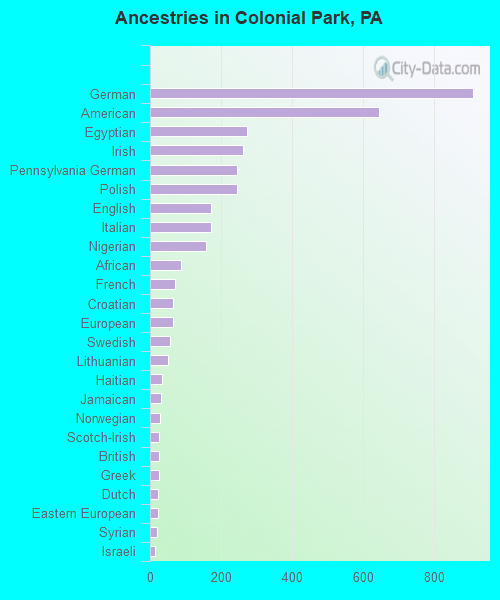
First ancestries reported:
German: 910 (10.9%)
American: 645 (7.7%)
Egyptian: 272 (3.2%)
Irish: 261 (3.1%)
Pennsylvania German: 246 (2.9%)
Polish: 244 (2.9%)
English: 171 (2.0%)
Italian: 171 (2.0%)
Nigerian: 158 (1.9%)
African: 86 (1.0%)
French: 71 (0.8%)
Croatian: 64 (0.8%)
European: 64 (0.8%)
Swedish: 57 (0.7%)
Lithuanian: 52 (0.6%)
Haitian: 33 (0.4%)
Jamaican: 30 (0.4%)
Norwegian: 29 (0.3%)
Scotch-Irish: 25 (0.3%)
British: 24 (0.3%)
Greek: 24 (0.3%)
Dutch: 23 (0.3%)
Eastern European: 22 (0.3%)
Syrian: 21 (0.3%)
Israeli: 15 (0.2%)
Ukrainian: 15 (0.2%)
Brazilian: 12 (0.1%)
Slavic: 11 (0.1%)
Czechoslovakian: 9 (0.1%)
Serbian: 9 (0.1%) Most common places of birth for foreign-born residents (%): Vietnam Colonial Park:
15.5% (464)Pennsylvania:
3.3% (31,542)
India Colonial Park:
10.9% (327)Pennsylvania:
10.7% (100,596)
Bhutan Colonial Park:
10.6% (317)Pennsylvania:
0.8% (7,882)
Nepal Colonial Park:
10.3% (309)Pennsylvania:
0.7% (6,855)
Dominican Republic Colonial Park:
9.0% (269)Pennsylvania:
9.2% (86,544)
Egypt Colonial Park:
8.4% (251)Pennsylvania:
0.8% (7,272)
Other Western Africa Colonial Park:
3.7% (111)Pennsylvania:
0.5% (5,099)
Nigeria Colonial Park:
3.7% (110)Pennsylvania:
1.1% (10,709)
Bangladesh Colonial Park:
3.2% (97)Pennsylvania:
0.9% (8,772)
China, excluding Hong Kong and Taiwan Colonial Park:
3.0% (89)Pennsylvania:
7.2% (67,704)
Africa, n.e.c. Colonial Park:
2.3% (69)Pennsylvania:
0.6% (5,479)
Philippines Colonial Park:
2.0% (61)Pennsylvania:
2.2% (21,039)
Mexico Colonial Park:
2.0% (59)Pennsylvania:
5.8% (54,190)
Place of birth for U.S.-born residents:
This state: 10,721Other state: 2,739Northeast: 900Midwest: 463South: 1,213West: 183 81.9% of Colonial Park residents lived in the same house 1 years ago.
Out of people who lived in different houses, 37.4% lived in this county.
Out of people who lived in different counties, 57.9% lived in Pennsylvania.
Colonial Park:
81.9%State average:
89.3%
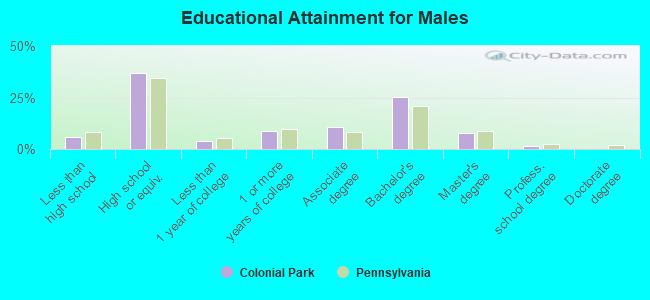
Education attainment for males 25 years and older:
No schooling: 33Nursery to 4th grade: 05th and 6th grade: 07th and 8th grade: 319th grade: 010th grade: 10511th grade: 4912th grade, no diploma: 87High school graduate (or equivalency): 1,949Less than 1 year of college: 206Some college more than 1 year, no degree: 454Associate degree: 556Bachelor's degree: 1,324Master's degree: 410Professional school degree: 78Doctorate degree: 0
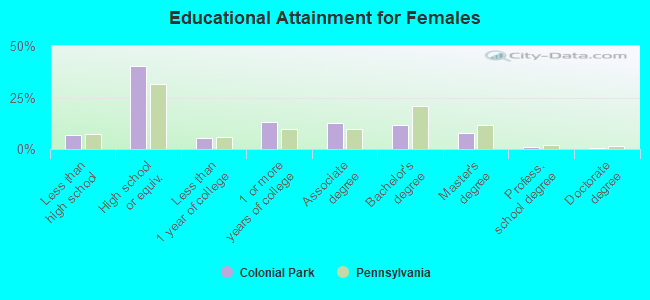
Education attainment for females 25 years and older:
No schooling: 95Nursery to 4th grade: 265th and 6th grade: 117th and 8th grade: 199th grade: 9410th grade: 4911th grade: 4312th grade, no diploma: 99High school graduate (or equivalency): 2,542Less than 1 year of college: 348Some college more than 1 year, no degree: 821Associate degree: 804Bachelor's degree: 741Master's degree: 483Professional school degree: 74Doctorate degree: 24
Housing units in structures:
One, detached: 3,588One, attached: 260Two: 1633 or 4: 4745 to 9: 1,11910 to 19: 1,16120 to 49: 19250 or more: 201Mobile homes: 16Housing units lacking complete kitchen facilities in 2022: 0.6%House/condo owner moved in on average 17 years ago
Renter moved in on average 2 years ago
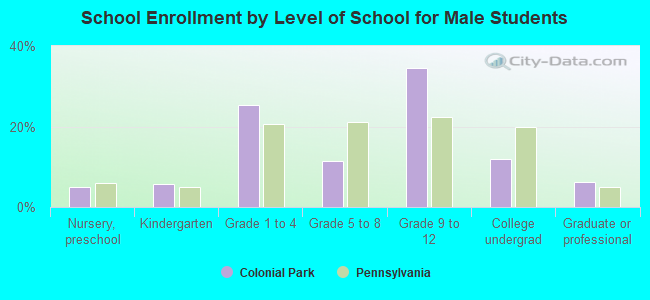
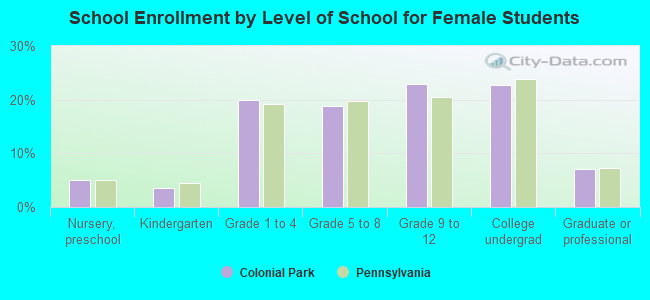
Private vs. public school enrollment:
Students in private schools in grades 1 to 8 (elementary and middle school): 159 Here:
11.8%Pennsylvania:
15.7%
Students in private schools in grades 9 to 12 (high school): 270 Here:
24.5%Pennsylvania:
13.4%
Students in private undergraduate colleges: 163 Here:
26.0%Pennsylvania:
39.8%