Columbia, MD (Maryland) Houses and Residents
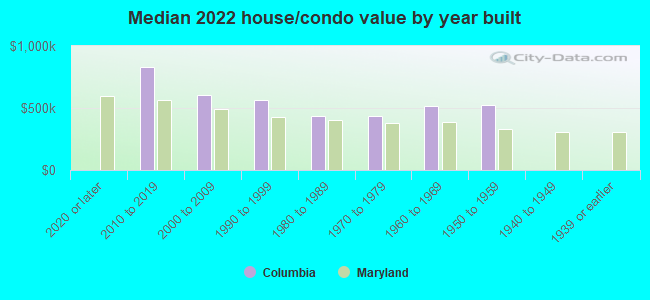
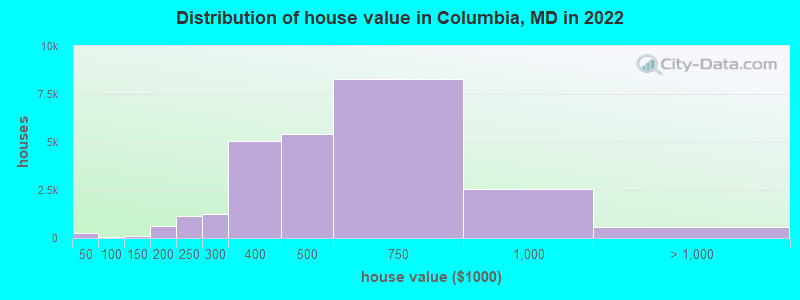
Estimated median house or condo value in 2022: $478,000 (it was $172,700 in 2000 )
Columbia:
$478,000Maryland:
$398,100
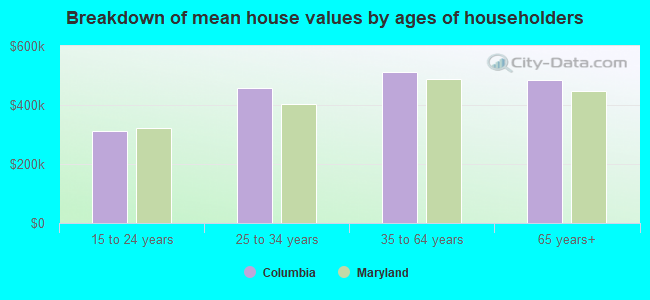
Lower value quartile - upper value quartile: $354,800 - $652,300Mean price in 2022: Detached houses: $570,668 Here:
$570,668State:
$526,819
Townhouses or other attached units: $408,256 Here:
$408,256State:
$328,305
In 3-to-4-unit structures: $187,212 Here:
$187,212State:
$295,378
In 5-or-more-unit structures: $287,982 Here:
$287,982State:
$350,378
Total population: 99,615 (Urban population: 88,291, Rural population: 100 (all nonfarm) )
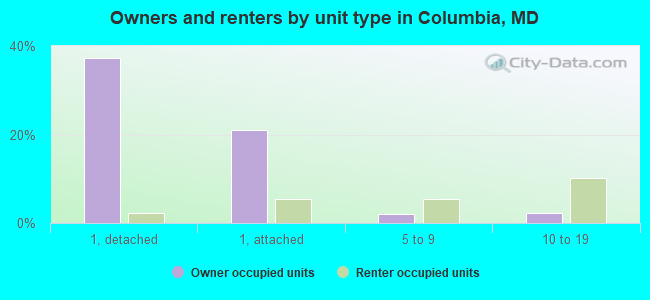
Houses: 43,238 (40,689 occupied: 25,091 owner occupied, 15,598 renter occupied )
% of renters here:
38%State:
32%
Housing density: 1,569 houses/condos per square mile
Median price asked for vacant for-sale houses and condos in 2022: $356,591.
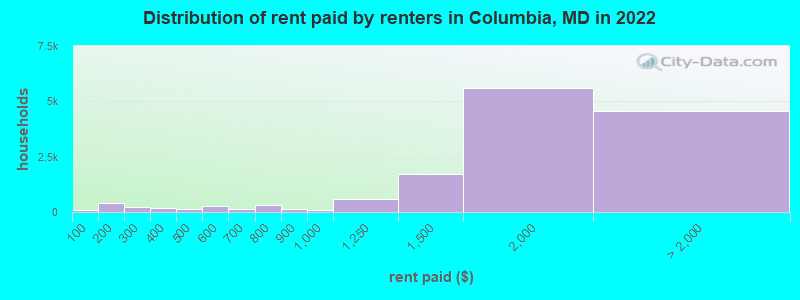
Median contract rent in 2022: $1,750 (lower quartile is $1,393, upper quartile is over $2,000)
Median rent asked for vacant for-rent units in 2022: $1,650
Median gross rent in Columbia, MD in 2022: $1,885
Housing units in Columbia with a mortgage: 18,013 (2,148 second mortgage, 0 home equity loan, 1,926 both second mortgage and home equity loan )Houses without a mortgage: 388
Median household income for houses/condos with a mortgage: $154,506
Median household income for apartments without a mortgage: $125,050
Median monthly housing costs: $1,931
Data:
Median house or condo value ($)
Median house or condo value ($ change since 2000)
Median house or condo value ($) - White
Median house or condo value ($) - Black or African American
Median house or condo value ($) - Asian
Median house or condo value ($) - Hispanic or Latino
Median house or condo value ($) - American Indian and Alaska Native
Median house or condo value ($) - Multirace
Median house or condo value ($) - Other Race
Median price asked for mobile homes ($)
Household density (households per square mile)
Mean house or condo value by units in structure - 1, detached ($)
Mean house or condo value by units in structure - 1, attached ($)
Mean house or condo value by units in structure - 2 ($)
Mean house or condo value by units in structure by units in structure - 3 or 4 ($)
Mean house or condo value by units in structure - 5 or more ($)
Mean house or condo value by units in structure - Boat, RV, van, etc. ($)
Mean house or condo value by units in structure - Mobile home ($)
Median contract rent ($)
Median contract rent - Lower quartile ($)
Median contract rent - Upper quartile ($)
Median gross rent ($)
Urban houses (%)
Rural houses (%)
Houses occupied (%)
Houses occupied (% change since 2000)
Houses owner occupied (%)
Houses owner occupied (% change since 2000)
Houses renter occupied (%)
Houses renter occupied (% change since 2000)
Vacant housing units - For rent (%)
Vacant housing units - For rent (% change since 2000)
Vacant housing units - For sale only (%)
Vacant housing units - For sale only (% change since 2000)
Vacant housing units - Rented or sold, not occupied (%)
Vacant housing units - Rented or sold, not occupied (% change since 2000)
Vacant housing units - For seasonal, recreational, or occasional use (%)
Vacant housing units - For seasonal, recreational, or occasional use (% change since 2000)
Vacant housing units - For migrant workers (%)
Vacant housing units - For migrant workers (% change since 2000)
Vacant housing units - Other vacant (%)
Vacant housing units - Other vacant (% change since 2000)
Median monthly housing costs ($)
Median household income for houses/condos with a mortgage ($)
Median household income for houses/condos without a mortgage ($)
Median household income ($)
Median household income ($) - White
Median household income ($) - Black or African American
Median household income ($) - Asian
Median household income ($) - Hispanic or Latino
Median household income ($) - American Indian and Alaska Native
Median household income ($) - Multirace
Median household income ($) - Other Race
Mortgage status - with mortgage (%)
Mortgage status - with second mortgage (%)
Mortgage status - with home equity loan (%)
Mortgage status - with both second mortgage and home equity loan (%)
Mortgage status - without a mortgage (%)
Median year house/condo built
Median year apartment built
Household type by relationship - Male householder living alone (%)
Household type by relationship - Male householder not living alone (%)
Household type by relationship - Female householder living alone (%)
Household type by relationship - Female householder not living alone (%)
Household type by relationship - Opposite-Sex spouse (%)
Household type by relationship - Same-Sex spouse (%)
Household type by relationship - Opposite-Sex unmarried partner (%)
Household type by relationship - Same-Sex unmarried partner (%)
Household type by relationship - In group quarters (%)
Size of family households - 2-person household (%)
Size of family households - 3-person household (%)
Size of family households - 4-person household (%)
Size of family households - 5-person household (%)
Size of family households - 6-person household (%)
Size of family households - 7-or-more-person household (%)
Size of nonfamily households - 1-person household (%)
Size of nonfamily households - 2-person household (%)
Size of nonfamily households - 3-person household (%)
Size of nonfamily households - 4-person household (%)
Size of nonfamily households - 5-person household (%)
Size of nonfamily households - 6-person household (%)
Size of nonfamily households - 7-or-moreperson household (%)
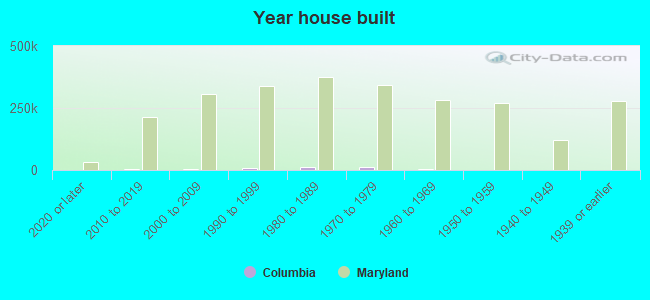
Year house built - Built 2010 or later (%)
Year house built - Built 2000 to 2009 (%)
Year house built - Built 1990 to 1999 (%)
Year house built - Built 1980 to 1989 (%)
Year house built - Built 1970 to 1979 (%)
Year house built - Built 1960 to 1969 (%)
Year house built - Built 1950 to 1959 (%)
Year house built - Built 1940 to 1949 (%)
Year house built - Built 1939 or earlier (%)
Median number of rooms in houses and condos
Median number of rooms in apartments
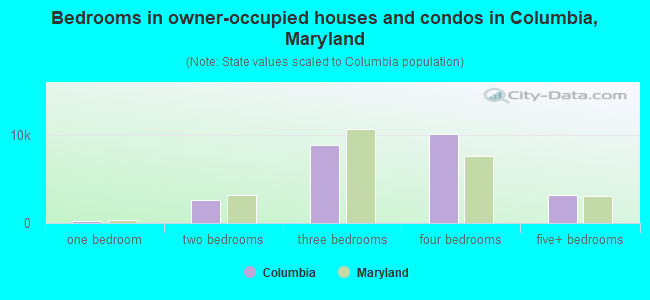
Median number of bedrooms in owner occupied houses
Mean number of bedrooms in owner occupied houses
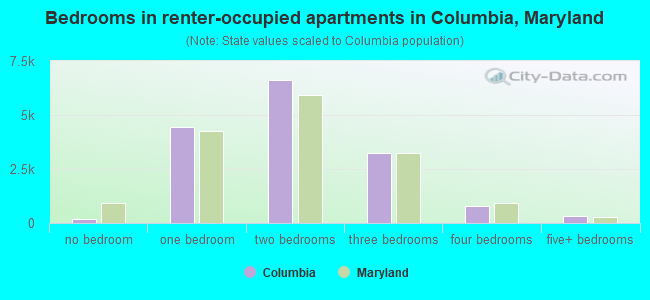
Median number of bedrooms in renter occupied houses
Mean number of bedrooms in renter occupied houses
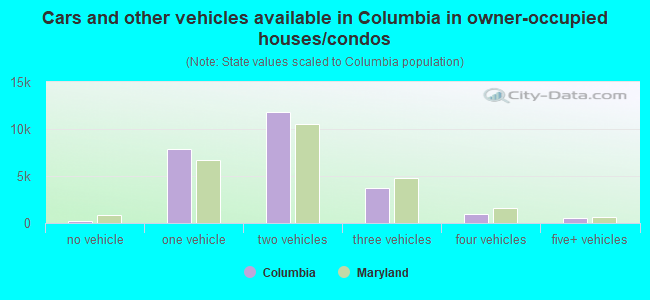
Median number of vehichles in owner occupied houses
Mean number of vehichles in owner occupied houses
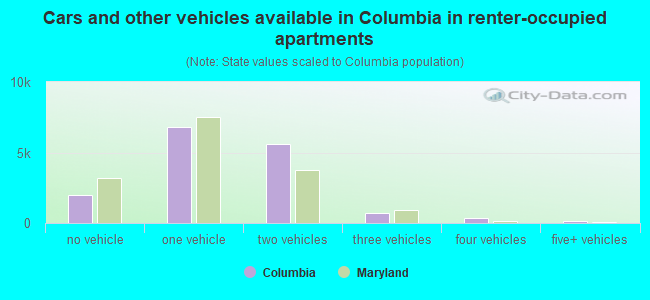
Median number of vehichles in renter occupied houses
Mean number of vehichles in renter occupied houses
Rooms in owner-occupied houses - 1 room (%)
Rooms in owner-occupied houses - 2 rooms (%)
Rooms in owner-occupied houses - 3 rooms (%)
Rooms in owner-occupied houses - 4 rooms (%)
Rooms in owner-occupied houses - 5 rooms (%)
Rooms in owner-occupied houses - 6 rooms (%)
Rooms in owner-occupied houses - 7 rooms (%)
Rooms in owner-occupied houses - 8 rooms (%)
Rooms in owner-occupied houses - 9+ rooms (%)
Rooms in renter-occupied houses - 1 room (%)
Rooms in renter-occupied houses - 2 rooms (%)
Rooms in renter-occupied houses - 3 rooms (%)
Rooms in renter-occupied houses - 4 rooms (%)
Rooms in renter-occupied houses - 5 rooms (%)
Rooms in renter-occupied houses - 6 rooms (%)
Rooms in renter-occupied houses - 7 rooms (%)
Rooms in renter-occupied houses - 8 rooms (%)
Rooms in renter-occupied houses - 9+ rooms (%)
Bedrooms in owner-occupied houses - no bedrooms (%)
Bedrooms in owner-occupied houses - 1 bedroom (%)
Bedrooms in owner-occupied houses - 2 bedrooms (%)
Bedrooms in owner-occupied houses - 3 bedrooms (%)
Bedrooms in owner-occupied houses - 4 bedrooms (%)
Bedrooms in owner-occupied houses - 5+ bedrooms (%)
Bedrooms in renter-occupied houses - no bedrooms (%)
Bedrooms in renter-occupied houses - 1 bedroom (%)
Bedrooms in renter-occupied houses - 2 bedrooms (%)
Bedrooms in renter-occupied houses - 3 bedrooms (%)
Bedrooms in renter-occupied houses - 4 bedrooms (%)
Bedrooms in renter-occupied houses - 5+ bedrooms (%)
Vehicles available in owner-occupied houses - no vehicle available (%)
Vehicles available in owner-occupied houses - 1 vehicle available(%)
Vehicles available in owner-occupied houses - 2 Vehicles available (%)
Vehicles available in owner-occupied houses - 3 Vehicles available (%)
Vehicles available in owner-occupied houses - 4 Vehicles available (%)
Vehicles available in owner-occupied houses - 5+ Vehicles available (%)
Vehicles available in renter-occupied houses - no vehicle available (%)
Vehicles available in renter-occupied houses - 1 vehicle available (%)
Vehicles available in renter-occupied houses - 2 Vehicles available (%)
Vehicles available in renter-occupied houses - 3 Vehicles available (%)
Vehicles available in renter-occupied houses - 4 Vehicles available (%)
Vehicles available in renter-occupied houses - 5+ Vehicles available (%)
Housing units in structures - 1, detached (%)
Housing units in structures - 1, attached (%)
Housing units in structures - 2 (%)
Housing units in structures - 3 or 4 (%)
Housing units in structures - 5 to 9 (%)
Housing units in structures - 10 to 19 (%)
Housing units in structures - 20 to 49 (%)
Housing units in structures - 50 or more (%)
Housing units in structures - Mobile home (%)
Housing units in structures - Boat, RV, van, etc. (%)
Housing units in structures - Owners - 1, detached (%)
Housing units in structures - Owners - 1, attached (%)
Housing units in structures - Owners - 2 (%)
Housing units in structures - Owners - 3 or 4 (%)
Housing units in structures - Owners - 5 to 9 (%)
Housing units in structures - Owners - 10 to 19 (%)
Housing units in structures - Owners - 20 to 49 (%)
Housing units in structures - Owners - 50 or more (%)
Housing units in structures - Owners - Mobile home (%)
Housing units in structures - Owners - Boat, RV, van, etc. (%)
Housing units in structures - Renters - 1, detached (%)
Housing units in structures - Renters - 1, attached (%)
Housing units in structures - Renters - 2 (%)
Housing units in structures - Renters - 3 or 4 (%)
Housing units in structures - Renters - 5 to 9 (%)
Housing units in structures - Renters - 10 to 19 (%)
Housing units in structures - Renters - 20 to 49 (%)
Housing units in structures - Renters - 50 or more (%)
Housing units in structures - Renters - Mobile home (%)
Housing units in structures - Renters - Boat, RV, van, etc. (%)
House/condo owner moved in on average (years ago)
Renter moved in on average (years ago)
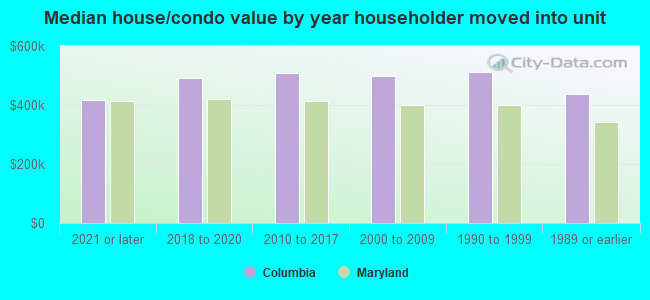
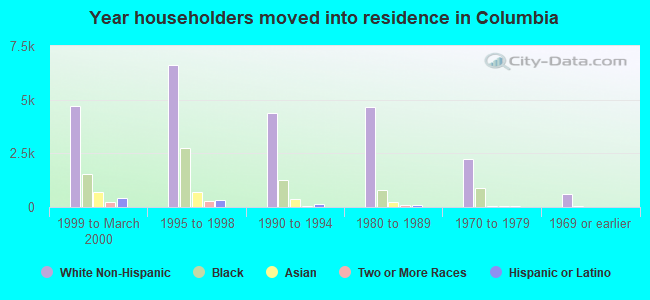
Year householder moved into unit - Moved in 1999 to March 2000 (%)
Year householder moved into unit - Moved in 1999 to March 2000 (%) - White
Year householder moved into unit - Moved in 1999 to March 2000 (%) - Black or African American
Year householder moved into unit - Moved in 1999 to March 2000 (%) - Asian
Year householder moved into unit - Moved in 1999 to March 2000 (%) - Hispanic or Latino
Year householder moved into unit - Moved in 1999 to March 2000 (%) - American Indian and Alaska Native
Year householder moved into unit - Moved in 1999 to March 2000 (%) - Multirace
Year householder moved into unit - Moved in 1999 to March 2000 (%) - Other Race
Year householder moved into unit - Moved in 1995 to 1998 (%)
Year householder moved into unit - Moved in 1995 to 1998 (%) - White
Year householder moved into unit - Moved in 1995 to 1998 (%) - Black or African American
Year householder moved into unit - Moved in 1995 to 1998 (%) - Asian
Year householder moved into unit - Moved in 1995 to 1998 (%) - Hispanic or Latino
Year householder moved into unit - Moved in 1995 to 1998 (%) - American Indian and Alaska Native
Year householder moved into unit - Moved in 1995 to 1998 (%) - Multirace
Year householder moved into unit - Moved in 1995 to 1998 (%) - Other Race
Year householder moved into unit - Moved in 1990 to 1994 (%)
Year householder moved into unit - Moved in 1990 to 1994 (%) - White
Year householder moved into unit - Moved in 1990 to 1994 (%) - Black or African American
Year householder moved into unit - Moved in 1990 to 1994 (%) - Asian
Year householder moved into unit - Moved in 1990 to 1994 (%) - Hispanic or Latino
Year householder moved into unit - Moved in 1990 to 1994 (%) - American Indian and Alaska Native
Year householder moved into unit - Moved in 1990 to 1994 (%) - Multirace
Year householder moved into unit - Moved in 1990 to 1994 (%) - Other Race
Year householder moved into unit - Moved in 1980 to 1989 (%)
Year householder moved into unit - Moved in 1980 to 1989 (%) - White
Year householder moved into unit - Moved in 1980 to 1989 (%) - Black or African American
Year householder moved into unit - Moved in 1980 to 1989 (%) - Asian
Year householder moved into unit - Moved in 1980 to 1989 (%) - Hispanic or Latino
Year householder moved into unit - Moved in 1980 to 1989 (%) - American Indian and Alaska Native
Year householder moved into unit - Moved in 1980 to 1989 (%) - Multirace
Year householder moved into unit - Moved in 1980 to 1989 (%) - Other Race
Year householder moved into unit - Moved in 1970 to 1979 (%)
Year householder moved into unit - Moved in 1970 to 1979 (%) - White
Year householder moved into unit - Moved in 1970 to 1979 (%) - Black or African American
Year householder moved into unit - Moved in 1970 to 1979 (%) - Asian
Year householder moved into unit - Moved in 1970 to 1979 (%) - Hispanic or Latino
Year householder moved into unit - Moved in 1970 to 1979 (%) - American Indian and Alaska Native
Year householder moved into unit - Moved in 1970 to 1979 (%) - Multirace
Year householder moved into unit - Moved in 1970 to 1979 (%) - Other Race
Year householder moved into unit - Moved in 1969 or earlier (%)
Year householder moved into unit - Moved in 1969 or earlier (%) - White
Year householder moved into unit - Moved in 1969 or earlier (%) - Black or African American
Year householder moved into unit - Moved in 1969 or earlier (%) - Asian
Year householder moved into unit - Moved in 1969 or earlier (%) - Hispanic or Latino
Year householder moved into unit - Moved in 1969 or earlier (%) - American Indian and Alaska Native
Year householder moved into unit - Moved in 1969 or earlier (%) - Multirace
Year householder moved into unit - Moved in 1969 or earlier (%) - Other Race
Housing units lacking complete plumbing facilities (%)
Housing units lacking complete kitchen facilities (%)
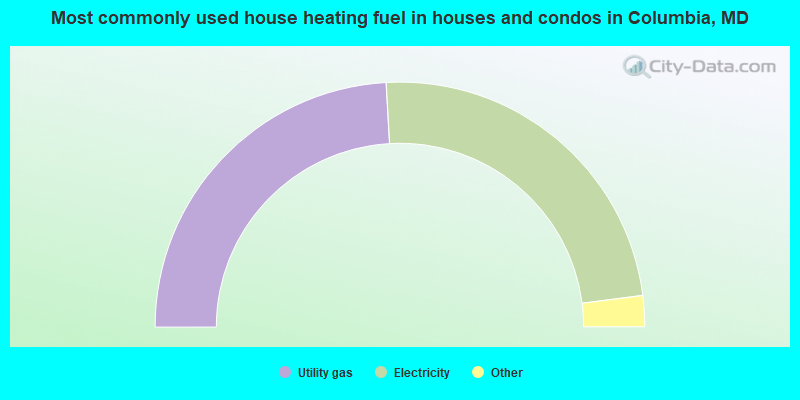
House heating fuel used in houses and condos - Utility gas (%)
House heating fuel used in houses and condos - Bottled, tank, or LP gas (%)
House heating fuel used in houses and condos - Electricity (%)
House heating fuel used in houses and condos - Fuel oil, kerosene, etc. (%)
House heating fuel used in houses and condos - Coal or coke (%)
House heating fuel used in houses and condos - Wood (%)
House heating fuel used in houses and condos - Solar energy (%)
House heating fuel used in houses and condos - Other fuel (%)
House heating fuel used in houses and condos - No fuel used (%)
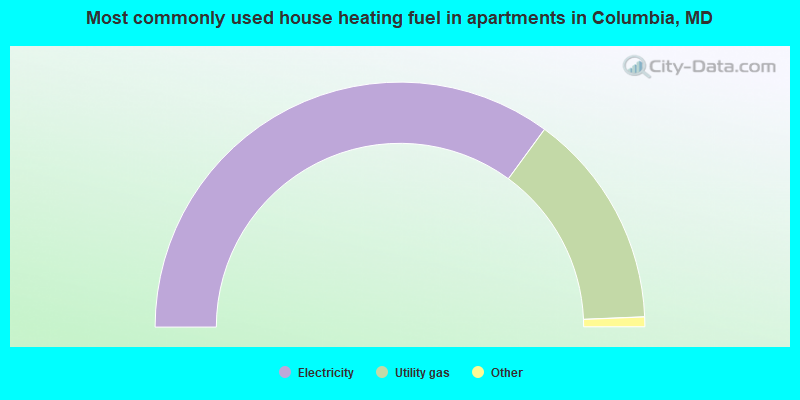
House heating fuel used in apartments - Utility gas (%)
House heating fuel used in apartments - Bottled, tank, or LP gas (%)
House heating fuel used in apartments - Electricity (%)
House heating fuel used in apartments - Fuel oil, kerosene, etc. (%)
House heating fuel used in apartments - Coal or coke (%)
House heating fuel used in apartments - Wood (%)
House heating fuel used in apartments - Solar energy (%)
House heating fuel used in apartments - Other fuel (%)
House heating fuel used in apartments - No fuel used (%)
Latest news about housing in Columbia, MD collected exclusively by city-data.com from local newspapers, TV, and radio stations
Median year house/condo built: 1982Median year apartment built: 1984Household type by relationship:
Households: 101,734
Male householders: 19,784 (3,720 living alone ), Female householders: 20,905 (6,962 living alone )19,875 spouses (19,716 opposite-sex spouses ), 2,891 unmarried partners , (2,708 opposite-sex unmarried partners ), 27,491 children (25,666 natural , 1,010 adopted , 815 stepchildren ), 2,405 grandchildren , 1,329 brothers or sisters , 2,463 parents , 0 foster children , 758 other relatives , 3,270 non-relatives In group quarters: 563
Size of family households: 12,274 2-persons , 5,933 3-persons , 5,646 4-persons , 1,467 5-persons , 790 6-persons , 368 7-or-more-persons .
Size of nonfamily households: 10,682 1-person , 3,044 2-persons , 349 3-persons , 136 4-persons .
13,868 married couples with children. single-parent households (1,122 men , 2,747 women ).
74.7% of residents of Columbia speak English at home. of residents speak Spanish at home (68% speak English very well , 19% speak English well , 11% speak English not well , 2% don't speak English at all ).of residents speak other Indo-European language at home (73% speak English very well , 18% speak English well , 6% speak English not well , 2% don't speak English at all ).of residents speak Asian or Pacific Island language at home (50% speak English very well , 18% speak English well , 28% speak English not well , 4% don't speak English at all ).of residents speak other language at home (77% speak English very well , 16% speak English well , 7% speak English not well , 1% don't speak English at all ).
Foreign born population: 22,340 (22.0%)of them are naturalized citizens )
Median number of rooms in houses and condos:
Median number of rooms in apartments
Owner-occupied Renter-occupied
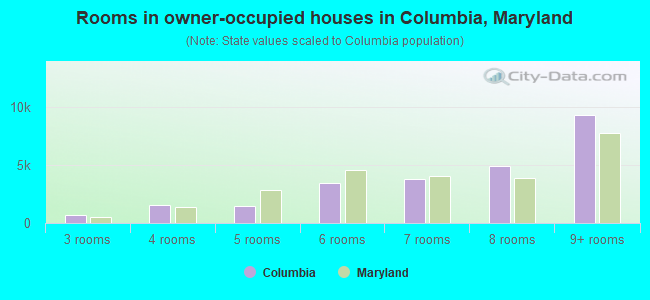
Rooms in owner-occupied houses in Columbia, Maryland
0 1 room 0 2 rooms 707 3 rooms 1,570 4 rooms 1,431 5 rooms 3,407 6 rooms 3,776 7 rooms 4,898 8 rooms 9,302 9+ rooms
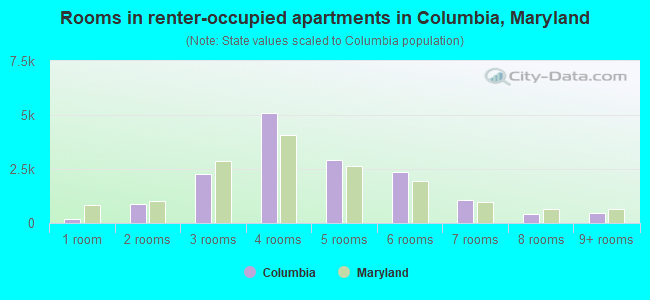
Rooms in renter-occupied apartments in Columbia, Maryland
171 1 room 873 2 rooms 2,288 3 rooms 5,100 4 rooms 2,897 5 rooms 2,341 6 rooms 1,043 7 rooms 411 8 rooms 474 9+ rooms
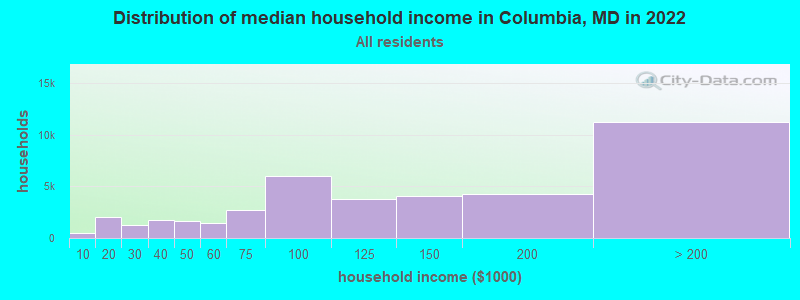
Columbia, MD household income distribution 448 Less than $10,0002,056 $10,000 to $19,9991,246 $20,000 to $29,9991,740 $30,000 to $39,9991,631 $40,000 to $49,9991,458 $50,000 to $59,9992,722 $60,000 to $74,9996,014 $75,000 to $99,9993,781 $100,000 to $124,9994,050 $125,000 to $149,9994,305 $150,000 to $199,99911,238 $200,000 or more
Home value of owner - occupied houses in 2022 in Columbia, MD 102 Less than $10,00051 $20,000 to $24,99915 $25,000 to $29,99918 $30,000 to $34,99933 $35,000 to $39,99942 $40,000 to $49,99922 $50,000 to $59,9993 $70,000 to $79,9995 $90,000 to $99,99939 $100,000 to $124,99972 $125,000 to $149,999418 $150,000 to $174,999200 $175,000 to $199,9991,122 $200,000 to $249,9991,270 $250,000 to $299,9995,035 $300,000 to $399,9995,399 $400,000 to $499,9998,286 $500,000 to $749,9992,557 $750,000 to $999,999492 $1,000,000 to $1,499,99941 $1,500,000 to $1,999,99929 $2,000,000 or moreRent paid by renters in 2022 in Columbia, MD 104 Less than $10044 $100 to $149365 $150 to $199135 $200 to $24981 $250 to $299144 $300 to $34939 $350 to $39951 $400 to $44983 $450 to $499204 $500 to $54960 $550 to $59997 $600 to $64951 $650 to $699180 $700 to $749118 $750 to $799157 $800 to $89998 $900 to $999569 $1,000 to $1,2491,724 $1,250 to $1,4995,608 $1,500 to $1,9993,102 $2,000 to $2,499784 $2,500 to $2,999100 $3,000 to $3,499288 $3,500 or more268 No cash rent
Percentage of workers working in this county: 55.6%Number of people working at home: 14,057 (23.5% of all workers )
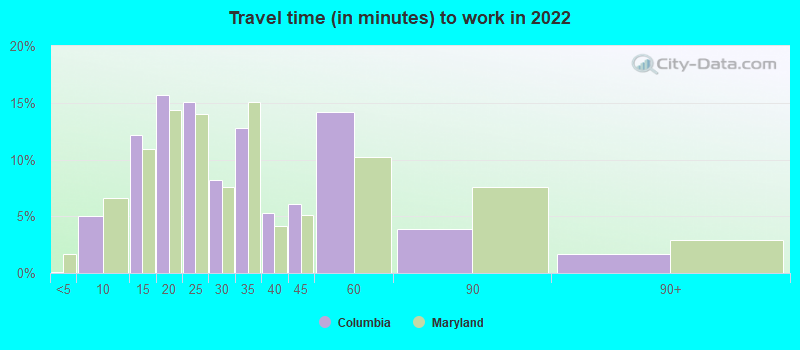
Travel time to work (commute)
Less than 5 minutes: 05 to 9 minutes: 2,50310 to 14 minutes: 6,61015 to 19 minutes: 7,32020 to 24 minutes: 7,59025 to 29 minutes: 2,72930 to 34 minutes: 6,14535 to 39 minutes: 1,92340 to 44 minutes: 2,67045 to 59 minutes: 3,05360 to 89 minutes: 2,44890 or more minutes: 1,215
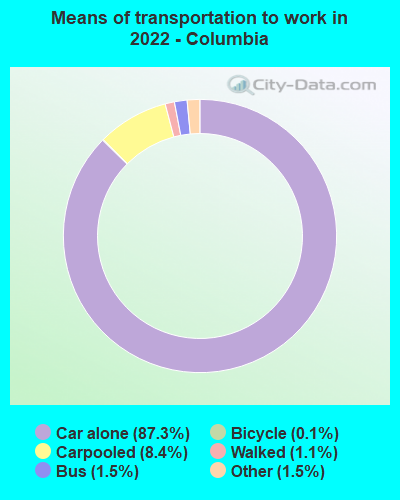
Means of transportation to work:
Drove a car alone: 50,861 (69.1%)Carpooled: 5,568 (7.6%)Bus : 726 (1.0%)Subway or elevated rail : 10 (0.0%)Long-distance train or commuter rail : 8 (0.0%)Ferryboat: 39 (0.1%)Taxi: 813 (1.1%)Bicycle: 75 (0.1%)Walked: 528 (0.7%)Worked at home: 14,057 (19.1%)
Unemployment by race in 2022
Unemployment rate for White non-Hispanic residents 2.8% Males2.2% FemalesUnemployment rate for Black residents 3.5% Males5.9% FemalesUnemployment rate for Asian residents 1.8% Males9.4% FemalesUnemployment rate for other race residents 0.5% Males5.4% FemalesUnemployment rate for two or more race residents 2.5% Males7.9% FemalesUnemployment rate for Hispanic or Latino residents 1.1% Males7.1% Females
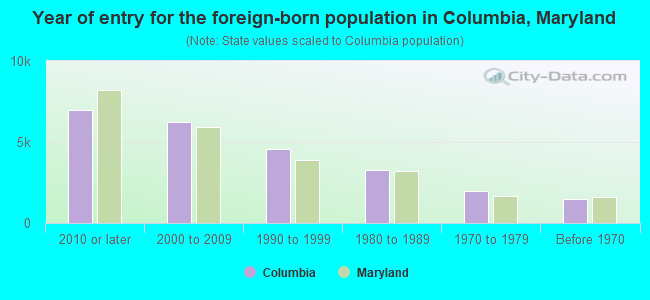
Year of entry for the foreign-born population in Columbia, Maryland
6,966 2010 or later 6,221 2000 to 2009 4,575 1990 to 1999 3,253 1980 to 1989 1,989 1970 to 1979 1,484 Before 1970
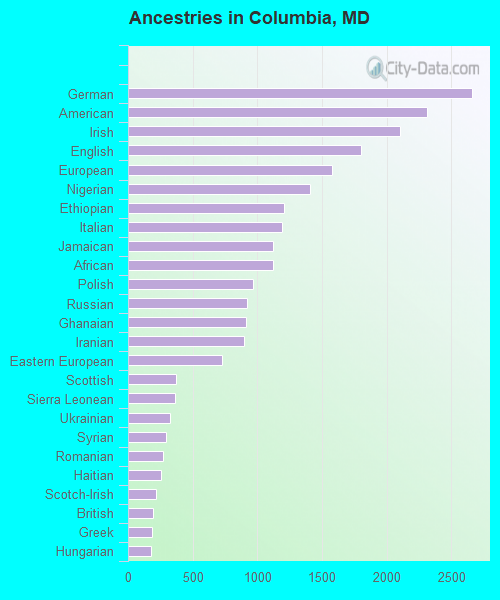
First ancestries reported:
German: 2,660 (4.3%)
American: 2,311 (3.7%)
Irish: 2,105 (3.4%)
English: 1,800 (2.9%)
European: 1,582 (2.6%)
Nigerian: 1,411 (2.3%)
Ethiopian: 1,207 (2.0%)
Italian: 1,193 (1.9%)
Jamaican: 1,122 (1.8%)
African: 1,119 (1.8%)
Polish: 965 (1.6%)
Russian: 924 (1.5%)
Ghanaian: 911 (1.5%)
Iranian: 899 (1.5%)
Eastern European: 731 (1.2%)
Scottish: 369 (0.6%)
Sierra Leonean: 363 (0.6%)
Ukrainian: 322 (0.5%)
Syrian: 291 (0.5%)
Romanian: 269 (0.4%)
Haitian: 255 (0.4%)
Scotch-Irish: 219 (0.4%)
British: 196 (0.3%)
Greek: 184 (0.3%)
Hungarian: 180 (0.3%)
Canadian: 166 (0.3%)
Egyptian: 151 (0.2%)
Norwegian: 135 (0.2%)
Cape Verdean: 128 (0.2%)
Afghan: 122 (0.2%)
Kenyan: 121 (0.2%)
Brazilian: 119 (0.2%)
Turkish: 115 (0.2%)
Trinidadian and Tobagonian: 108 (0.2%)
French Canadian: 104 (0.2%)
French: 103 (0.2%)
Swedish: 96 (0.2%)
Northern European: 89 (0.1%)
Arab: 89 (0.1%)
Lithuanian: 87 (0.1%)
Somali: 86 (0.1%)
Slavic: 78 (0.1%)
Guyanese: 77 (0.1%)
Slovak: 61 (0.10%)
Liberian: 57 (0.09%)
Dutch: 54 (0.09%)
Belgian: 52 (0.08%)
Lebanese: 46 (0.07%)
Assyrian: 42 (0.07%)
Bahamian: 41 (0.07%)
West Indian: 40 (0.06%)
Portuguese: 39 (0.06%)
Danish: 39 (0.06%)
Scandinavian: 36 (0.06%)
Macedonian: 36 (0.06%)
Austrian: 32 (0.05%)
Czechoslovakian: 31 (0.05%)
Welsh: 29 (0.05%)
German Russian: 28 (0.05%)
British West Indian: 28 (0.05%)
Pennsylvania German: 26 (0.04%)
Swiss: 24 (0.04%)
Moroccan: 23 (0.04%)
Barbadian: 21 (0.03%)
Croatian: 19 (0.03%)
Carpatho Rusyn: 19 (0.03%)
Maltese: 18 (0.03%)
Finnish: 13 (0.02%)
Yugoslavian: 13 (0.02%)
Palestinian: 11 (0.02%)
Czech: 10 (0.02%)
Bulgarian: 10 (0.02%)
Icelander: 8 (0.01%)
Sudanese: 7 (0.01%)
Armenian: 4 (0.01%)
Most common places of birth for foreign-born residents (%): India Columbia:
10.3% (2,428)Maryland:
6.4% (61,725)
China, excluding Hong Kong and Taiwan Columbia:
9.4% (2,218)Maryland:
4.6% (44,742)
Korea Columbia:
6.7% (1,570)Maryland:
3.4% (32,635)
Honduras Columbia:
5.0% (1,190)Maryland:
2.5% (24,026)
El Salvador Columbia:
4.3% (1,022)Maryland:
12.0% (115,412)
Nigeria Columbia:
4.1% (956)Maryland:
4.6% (44,825)
Ethiopia Columbia:
3.6% (859)Maryland:
3.2% (30,870)
Iran Columbia:
3.0% (711)Maryland:
1.3% (12,074)
Jamaica Columbia:
2.9% (685)Maryland:
2.8% (27,444)
Ghana Columbia:
2.8% (671)Maryland:
1.8% (17,774)
Philippines Columbia:
2.6% (624)Maryland:
3.8% (36,698)
Bangladesh Columbia:
2.6% (613)Maryland:
0.7% (7,124)
Russia Columbia:
2.1% (485)Maryland:
1.0% (9,481)
Pakistan Columbia:
2.0% (466)Maryland:
1.8% (17,037)
Sierra Leone Columbia:
1.9% (457)Maryland:
1.1% (10,233)
Mexico Columbia:
1.7% (395)Maryland:
3.5% (34,065)
Brazil Columbia:
1.6% (373)Maryland:
1.2% (11,980)
Place of birth for U.S.-born residents:
This state: 35,941Other state: 41,616Northeast: 15,942Midwest: 5,752South: 16,590West: 3,332 86.3% of Columbia residents lived in the same house 1 years ago.
Out of people who lived in different houses, 29.0% lived in this county.
Out of people who lived in different counties, 30.3% lived in Maryland.
Columbia:
86.3%State average:
88.5%
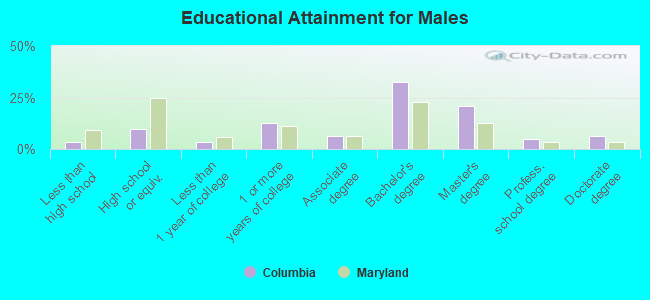
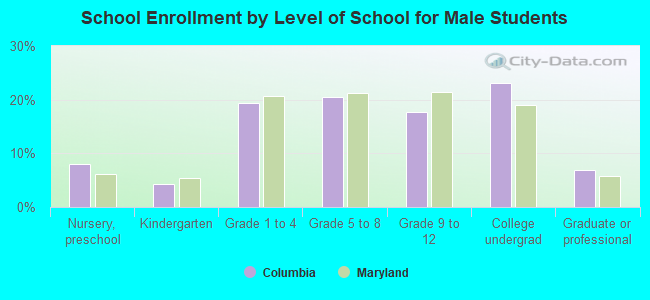
Education attainment for males 25 years and older:
No schooling: 231Nursery to 4th grade: 4255th and 6th grade: 767th and 8th grade: 09th grade: 28110th grade: 9611th grade: 012th grade, no diploma: 165High school graduate (or equivalency): 3,422Less than 1 year of college: 1,197Some college more than 1 year, no degree: 4,381Associate degree: 2,192Bachelor's degree: 11,448Master's degree: 7,331Professional school degree: 1,784Doctorate degree: 2,308
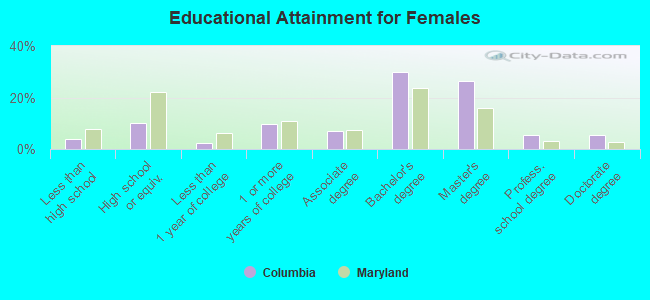
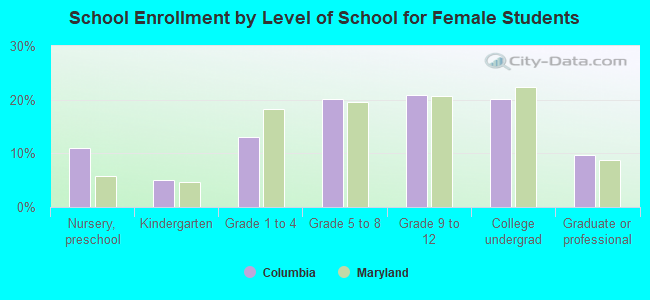
Education attainment for females 25 years and older:
No schooling: 491Nursery to 4th grade: 1875th and 6th grade: 587th and 8th grade: 869th grade: 010th grade: 12011th grade: 22012th grade, no diploma: 296High school graduate (or equivalency): 3,937Less than 1 year of college: 883Some college more than 1 year, no degree: 3,657Associate degree: 2,682Bachelor's degree: 11,515Master's degree: 10,181Professional school degree: 2,029Doctorate degree: 2,051
Housing units in structures:
One, detached: 17,431One, attached: 9,706Two: 1763 or 4: 5735 to 9: 3,53210 to 19: 7,46020 to 49: 99650 or more: 3,364Housing units lacking complete kitchen facilities in 2022: 0.2%House/condo owner moved in on average 15 years ago
Renter moved in on average 2 years ago
Private vs. public school enrollment:
Students in private schools in grades 1 to 8 (elementary and middle school): 720 Students in private schools in grades 9 to 12 (high school): 213 Students in private undergraduate colleges: 998