Copperas Cove, TX (Texas) Houses and Residents
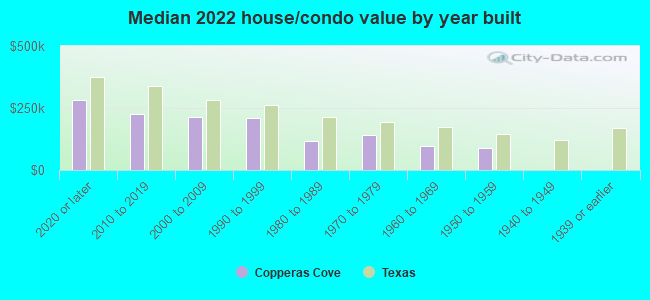
Estimated median house or condo value in 2022: $172,294 (it was $71,500 in 2000 )
Copperas Cove:
$172,294Texas:
$275,400
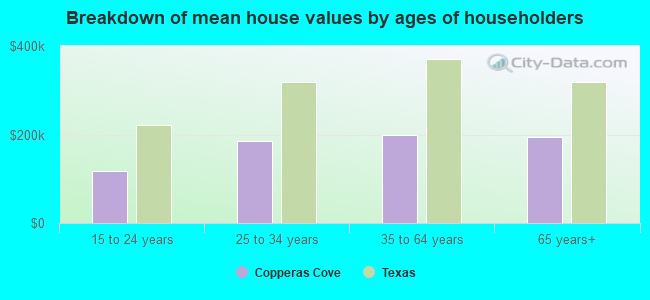
Lower value quartile - upper value quartile: $114,915 - $256,807Mean price in 2022: Detached houses: $249,848 Here:
$249,848State:
$369,058
In 2-unit structures: $256,870 Here:
$256,870State:
$374,947
Mobile homes: $42,717 Here:
$42,717State:
$124,413
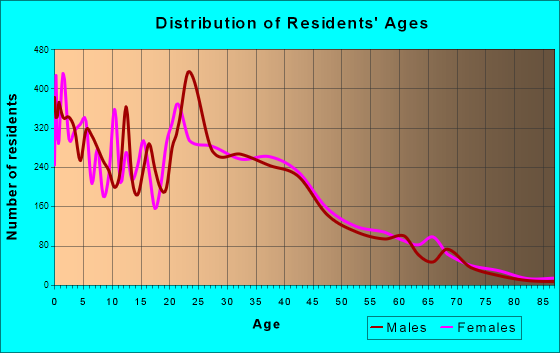
Total population: 32,943 (Urban population: 29,757, Rural population: 241 (all nonfarm) )
Houses: 15,360 (14,359 occupied: 8,665 owner occupied, 6,755 renter occupied )
% of renters here:
44%State:
38%
Housing density: 1,103 houses/condos per square mile
Median price asked for vacant for-sale houses and condos in 2022: $106,196.
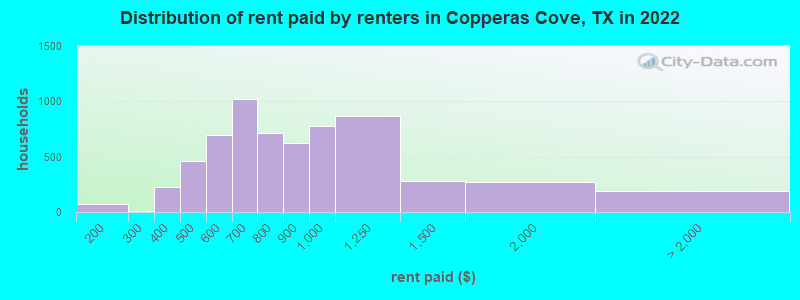
Median contract rent in 2022: $781 (lower quartile is $630, upper quartile is $1,018)
Median rent asked for vacant for-rent units in 2022: $901
Median gross rent in Copperas Cove, TX in 2022: $1,017
Housing units in Copperas Cove with a mortgage: 5,505 (164 second mortgage, 0 home equity loan, 134 both second mortgage and home equity loan )Houses without a mortgage: 29
Median household income for houses/condos with a mortgage: $92,248
Median household income for apartments without a mortgage: $57,991
Median monthly housing costs: $1,060
Data:
Median house or condo value ($)
Median house or condo value ($ change since 2000)
Median house or condo value ($) - White
Median house or condo value ($) - Black or African American
Median house or condo value ($) - Asian
Median house or condo value ($) - Hispanic or Latino
Median house or condo value ($) - American Indian and Alaska Native
Median house or condo value ($) - Multirace
Median house or condo value ($) - Other Race
Median price asked for mobile homes ($)
Household density (households per square mile)
Mean house or condo value by units in structure - 1, detached ($)
Mean house or condo value by units in structure - 1, attached ($)
Mean house or condo value by units in structure - 2 ($)
Mean house or condo value by units in structure by units in structure - 3 or 4 ($)
Mean house or condo value by units in structure - 5 or more ($)
Mean house or condo value by units in structure - Boat, RV, van, etc. ($)
Mean house or condo value by units in structure - Mobile home ($)
Median contract rent ($)
Median contract rent - Lower quartile ($)
Median contract rent - Upper quartile ($)
Median gross rent ($)
Urban houses (%)
Rural houses (%)
Houses occupied (%)
Houses occupied (% change since 2000)
Houses owner occupied (%)
Houses owner occupied (% change since 2000)
Houses renter occupied (%)
Houses renter occupied (% change since 2000)
Vacant housing units - For rent (%)
Vacant housing units - For rent (% change since 2000)
Vacant housing units - For sale only (%)
Vacant housing units - For sale only (% change since 2000)
Vacant housing units - Rented or sold, not occupied (%)
Vacant housing units - Rented or sold, not occupied (% change since 2000)
Vacant housing units - For seasonal, recreational, or occasional use (%)
Vacant housing units - For seasonal, recreational, or occasional use (% change since 2000)
Vacant housing units - For migrant workers (%)
Vacant housing units - For migrant workers (% change since 2000)
Vacant housing units - Other vacant (%)
Vacant housing units - Other vacant (% change since 2000)
Median monthly housing costs ($)
Median household income for houses/condos with a mortgage ($)
Median household income for houses/condos without a mortgage ($)
Median household income ($)
Median household income ($) - White
Median household income ($) - Black or African American
Median household income ($) - Asian
Median household income ($) - Hispanic or Latino
Median household income ($) - American Indian and Alaska Native
Median household income ($) - Multirace
Median household income ($) - Other Race
Mortgage status - with mortgage (%)
Mortgage status - with second mortgage (%)
Mortgage status - with home equity loan (%)
Mortgage status - with both second mortgage and home equity loan (%)
Mortgage status - without a mortgage (%)
Median year house/condo built
Median year apartment built
Household type by relationship - Male householder living alone (%)
Household type by relationship - Male householder not living alone (%)
Household type by relationship - Female householder living alone (%)
Household type by relationship - Female householder not living alone (%)
Household type by relationship - Opposite-Sex spouse (%)
Household type by relationship - Same-Sex spouse (%)
Household type by relationship - Opposite-Sex unmarried partner (%)
Household type by relationship - Same-Sex unmarried partner (%)
Household type by relationship - In group quarters (%)
Size of family households - 2-person household (%)
Size of family households - 3-person household (%)
Size of family households - 4-person household (%)
Size of family households - 5-person household (%)
Size of family households - 6-person household (%)
Size of family households - 7-or-more-person household (%)
Size of nonfamily households - 1-person household (%)
Size of nonfamily households - 2-person household (%)
Size of nonfamily households - 3-person household (%)
Size of nonfamily households - 4-person household (%)
Size of nonfamily households - 5-person household (%)
Size of nonfamily households - 6-person household (%)
Size of nonfamily households - 7-or-moreperson household (%)
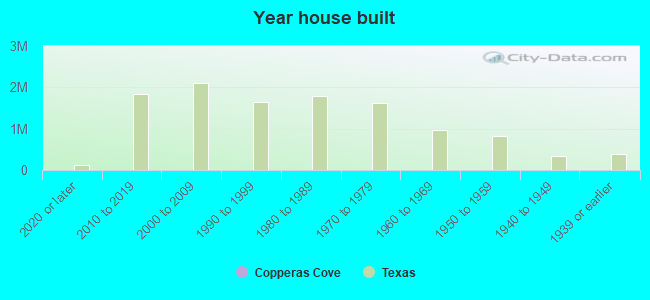
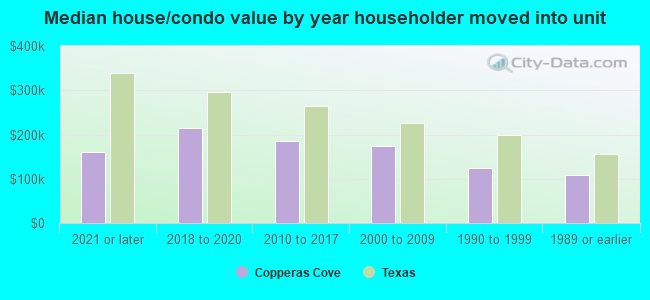
Year house built - Built 2010 or later (%)
Year house built - Built 2000 to 2009 (%)
Year house built - Built 1990 to 1999 (%)
Year house built - Built 1980 to 1989 (%)
Year house built - Built 1970 to 1979 (%)
Year house built - Built 1960 to 1969 (%)
Year house built - Built 1950 to 1959 (%)
Year house built - Built 1940 to 1949 (%)
Year house built - Built 1939 or earlier (%)
Median number of rooms in houses and condos
Median number of rooms in apartments
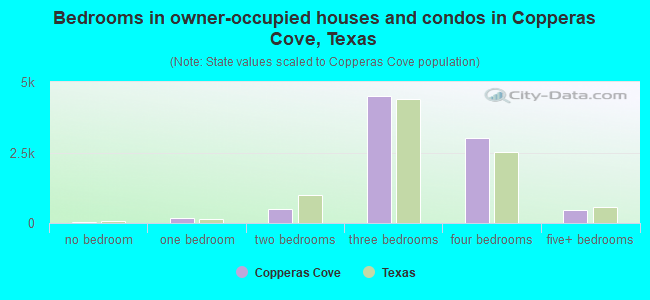
Median number of bedrooms in owner occupied houses
Mean number of bedrooms in owner occupied houses
Median number of bedrooms in renter occupied houses
Mean number of bedrooms in renter occupied houses
Median number of vehichles in owner occupied houses
Mean number of vehichles in owner occupied houses
Median number of vehichles in renter occupied houses
Mean number of vehichles in renter occupied houses
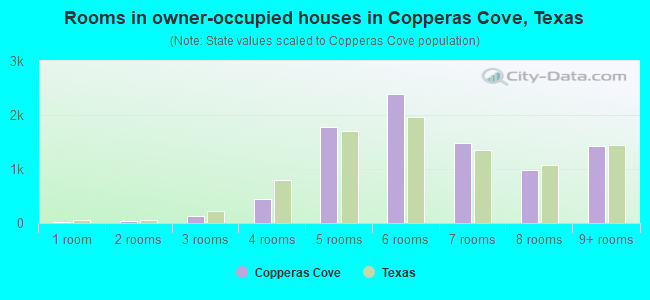
Rooms in owner-occupied houses - 1 room (%)
Rooms in owner-occupied houses - 2 rooms (%)
Rooms in owner-occupied houses - 3 rooms (%)
Rooms in owner-occupied houses - 4 rooms (%)
Rooms in owner-occupied houses - 5 rooms (%)
Rooms in owner-occupied houses - 6 rooms (%)
Rooms in owner-occupied houses - 7 rooms (%)
Rooms in owner-occupied houses - 8 rooms (%)
Rooms in owner-occupied houses - 9+ rooms (%)
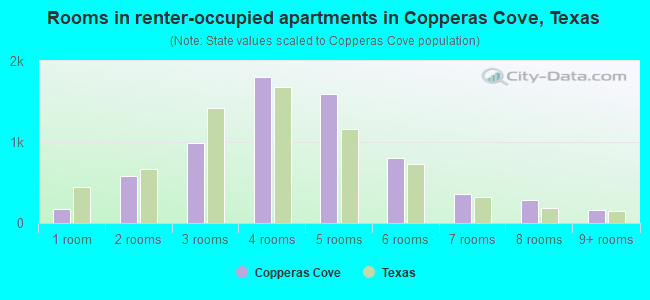
Rooms in renter-occupied houses - 1 room (%)
Rooms in renter-occupied houses - 2 rooms (%)
Rooms in renter-occupied houses - 3 rooms (%)
Rooms in renter-occupied houses - 4 rooms (%)
Rooms in renter-occupied houses - 5 rooms (%)
Rooms in renter-occupied houses - 6 rooms (%)
Rooms in renter-occupied houses - 7 rooms (%)
Rooms in renter-occupied houses - 8 rooms (%)
Rooms in renter-occupied houses - 9+ rooms (%)
Bedrooms in owner-occupied houses - no bedrooms (%)
Bedrooms in owner-occupied houses - 1 bedroom (%)
Bedrooms in owner-occupied houses - 2 bedrooms (%)
Bedrooms in owner-occupied houses - 3 bedrooms (%)
Bedrooms in owner-occupied houses - 4 bedrooms (%)
Bedrooms in owner-occupied houses - 5+ bedrooms (%)
Bedrooms in renter-occupied houses - no bedrooms (%)
Bedrooms in renter-occupied houses - 1 bedroom (%)
Bedrooms in renter-occupied houses - 2 bedrooms (%)
Bedrooms in renter-occupied houses - 3 bedrooms (%)
Bedrooms in renter-occupied houses - 4 bedrooms (%)
Bedrooms in renter-occupied houses - 5+ bedrooms (%)
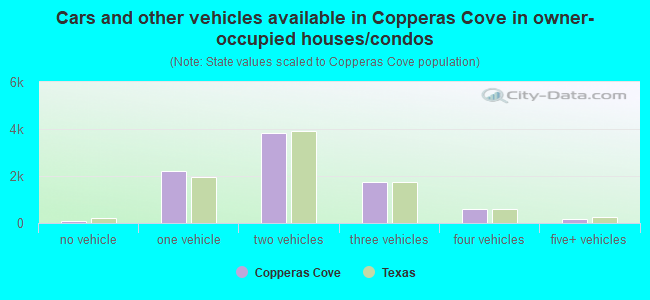
Vehicles available in owner-occupied houses - no vehicle available (%)
Vehicles available in owner-occupied houses - 1 vehicle available(%)
Vehicles available in owner-occupied houses - 2 Vehicles available (%)
Vehicles available in owner-occupied houses - 3 Vehicles available (%)
Vehicles available in owner-occupied houses - 4 Vehicles available (%)
Vehicles available in owner-occupied houses - 5+ Vehicles available (%)
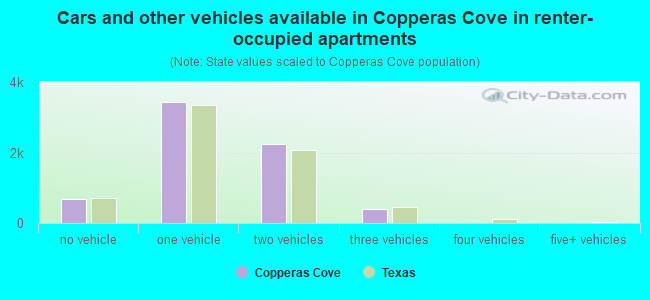
Vehicles available in renter-occupied houses - no vehicle available (%)
Vehicles available in renter-occupied houses - 1 vehicle available (%)
Vehicles available in renter-occupied houses - 2 Vehicles available (%)
Vehicles available in renter-occupied houses - 3 Vehicles available (%)
Vehicles available in renter-occupied houses - 4 Vehicles available (%)
Vehicles available in renter-occupied houses - 5+ Vehicles available (%)
Housing units in structures - 1, detached (%)
Housing units in structures - 1, attached (%)
Housing units in structures - 2 (%)
Housing units in structures - 3 or 4 (%)
Housing units in structures - 5 to 9 (%)
Housing units in structures - 10 to 19 (%)
Housing units in structures - 20 to 49 (%)
Housing units in structures - 50 or more (%)
Housing units in structures - Mobile home (%)
Housing units in structures - Boat, RV, van, etc. (%)
Housing units in structures - Owners - 1, detached (%)
Housing units in structures - Owners - 1, attached (%)
Housing units in structures - Owners - 2 (%)
Housing units in structures - Owners - 3 or 4 (%)
Housing units in structures - Owners - 5 to 9 (%)
Housing units in structures - Owners - 10 to 19 (%)
Housing units in structures - Owners - 20 to 49 (%)
Housing units in structures - Owners - 50 or more (%)
Housing units in structures - Owners - Mobile home (%)
Housing units in structures - Owners - Boat, RV, van, etc. (%)
Housing units in structures - Renters - 1, detached (%)
Housing units in structures - Renters - 1, attached (%)
Housing units in structures - Renters - 2 (%)
Housing units in structures - Renters - 3 or 4 (%)
Housing units in structures - Renters - 5 to 9 (%)
Housing units in structures - Renters - 10 to 19 (%)
Housing units in structures - Renters - 20 to 49 (%)
Housing units in structures - Renters - 50 or more (%)
Housing units in structures - Renters - Mobile home (%)
Housing units in structures - Renters - Boat, RV, van, etc. (%)
House/condo owner moved in on average (years ago)
Renter moved in on average (years ago)
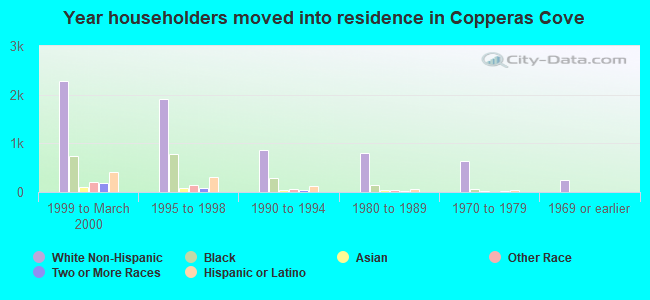
Year householder moved into unit - Moved in 1999 to March 2000 (%)
Year householder moved into unit - Moved in 1999 to March 2000 (%) - White
Year householder moved into unit - Moved in 1999 to March 2000 (%) - Black or African American
Year householder moved into unit - Moved in 1999 to March 2000 (%) - Asian
Year householder moved into unit - Moved in 1999 to March 2000 (%) - Hispanic or Latino
Year householder moved into unit - Moved in 1999 to March 2000 (%) - American Indian and Alaska Native
Year householder moved into unit - Moved in 1999 to March 2000 (%) - Multirace
Year householder moved into unit - Moved in 1999 to March 2000 (%) - Other Race
Year householder moved into unit - Moved in 1995 to 1998 (%)
Year householder moved into unit - Moved in 1995 to 1998 (%) - White
Year householder moved into unit - Moved in 1995 to 1998 (%) - Black or African American
Year householder moved into unit - Moved in 1995 to 1998 (%) - Asian
Year householder moved into unit - Moved in 1995 to 1998 (%) - Hispanic or Latino
Year householder moved into unit - Moved in 1995 to 1998 (%) - American Indian and Alaska Native
Year householder moved into unit - Moved in 1995 to 1998 (%) - Multirace
Year householder moved into unit - Moved in 1995 to 1998 (%) - Other Race
Year householder moved into unit - Moved in 1990 to 1994 (%)
Year householder moved into unit - Moved in 1990 to 1994 (%) - White
Year householder moved into unit - Moved in 1990 to 1994 (%) - Black or African American
Year householder moved into unit - Moved in 1990 to 1994 (%) - Asian
Year householder moved into unit - Moved in 1990 to 1994 (%) - Hispanic or Latino
Year householder moved into unit - Moved in 1990 to 1994 (%) - American Indian and Alaska Native
Year householder moved into unit - Moved in 1990 to 1994 (%) - Multirace
Year householder moved into unit - Moved in 1990 to 1994 (%) - Other Race
Year householder moved into unit - Moved in 1980 to 1989 (%)
Year householder moved into unit - Moved in 1980 to 1989 (%) - White
Year householder moved into unit - Moved in 1980 to 1989 (%) - Black or African American
Year householder moved into unit - Moved in 1980 to 1989 (%) - Asian
Year householder moved into unit - Moved in 1980 to 1989 (%) - Hispanic or Latino
Year householder moved into unit - Moved in 1980 to 1989 (%) - American Indian and Alaska Native
Year householder moved into unit - Moved in 1980 to 1989 (%) - Multirace
Year householder moved into unit - Moved in 1980 to 1989 (%) - Other Race
Year householder moved into unit - Moved in 1970 to 1979 (%)
Year householder moved into unit - Moved in 1970 to 1979 (%) - White
Year householder moved into unit - Moved in 1970 to 1979 (%) - Black or African American
Year householder moved into unit - Moved in 1970 to 1979 (%) - Asian
Year householder moved into unit - Moved in 1970 to 1979 (%) - Hispanic or Latino
Year householder moved into unit - Moved in 1970 to 1979 (%) - American Indian and Alaska Native
Year householder moved into unit - Moved in 1970 to 1979 (%) - Multirace
Year householder moved into unit - Moved in 1970 to 1979 (%) - Other Race
Year householder moved into unit - Moved in 1969 or earlier (%)
Year householder moved into unit - Moved in 1969 or earlier (%) - White
Year householder moved into unit - Moved in 1969 or earlier (%) - Black or African American
Year householder moved into unit - Moved in 1969 or earlier (%) - Asian
Year householder moved into unit - Moved in 1969 or earlier (%) - Hispanic or Latino
Year householder moved into unit - Moved in 1969 or earlier (%) - American Indian and Alaska Native
Year householder moved into unit - Moved in 1969 or earlier (%) - Multirace
Year householder moved into unit - Moved in 1969 or earlier (%) - Other Race
Housing units lacking complete plumbing facilities (%)
Housing units lacking complete kitchen facilities (%)
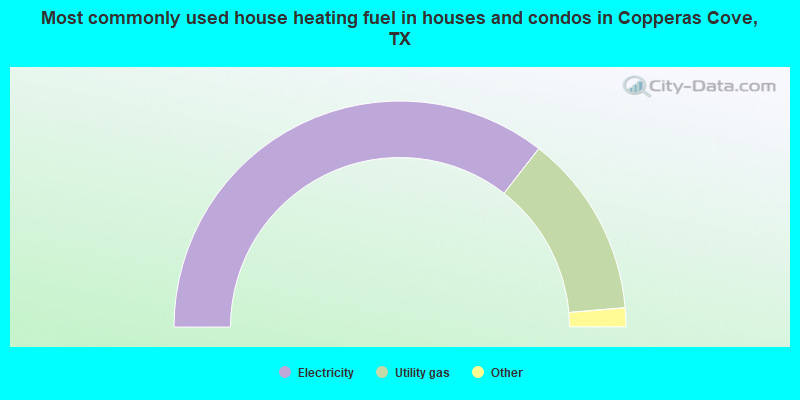
House heating fuel used in houses and condos - Utility gas (%)
House heating fuel used in houses and condos - Bottled, tank, or LP gas (%)
House heating fuel used in houses and condos - Electricity (%)
House heating fuel used in houses and condos - Fuel oil, kerosene, etc. (%)
House heating fuel used in houses and condos - Coal or coke (%)
House heating fuel used in houses and condos - Wood (%)
House heating fuel used in houses and condos - Solar energy (%)
House heating fuel used in houses and condos - Other fuel (%)
House heating fuel used in houses and condos - No fuel used (%)
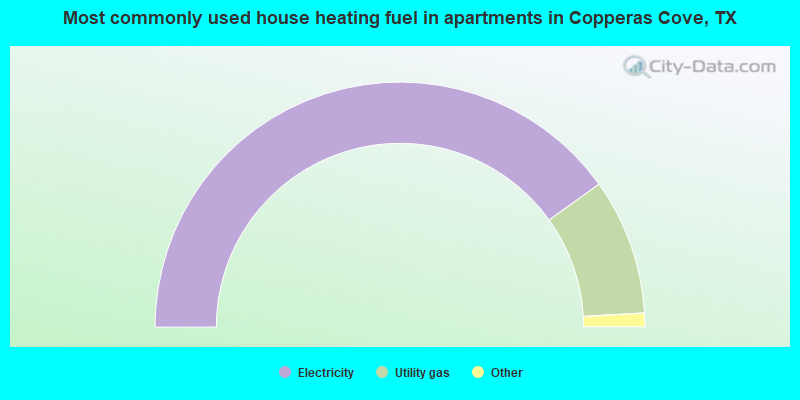
House heating fuel used in apartments - Utility gas (%)
House heating fuel used in apartments - Bottled, tank, or LP gas (%)
House heating fuel used in apartments - Electricity (%)
House heating fuel used in apartments - Fuel oil, kerosene, etc. (%)
House heating fuel used in apartments - Coal or coke (%)
House heating fuel used in apartments - Wood (%)
House heating fuel used in apartments - Solar energy (%)
House heating fuel used in apartments - Other fuel (%)
House heating fuel used in apartments - No fuel used (%)
Median year house/condo built: 1991Median year apartment built: 1984Household type by relationship:
Households: 37,371
Male householders: 7,399 (1,608 living alone ), Female householders: 6,985 (1,997 living alone )6,644 spouses (6,590 opposite-sex spouses ), 1,262 unmarried partners , (1,246 opposite-sex unmarried partners ), 11,880 children (10,443 natural , 280 adopted , 1,156 stepchildren ), 757 grandchildren , 347 brothers or sisters , 213 parents , 169 foster children , 728 other relatives , 664 non-relatives In group quarters: 317
Size of family households: 4,277 2-persons , 3,506 3-persons , 1,544 4-persons , 1,100 5-persons , 310 6-persons , 238 7-or-more-persons .
Size of nonfamily households: 3,600 1-person , 882 2-persons , 31 3-persons .
5,192 married couples with children. single-parent households (872 men , 1,845 women ).
86.0% of residents of Copperas Cove speak English at home. of residents speak Spanish at home (76% speak English very well , 16% speak English well , 6% speak English not well , 2% don't speak English at all ).of residents speak other Indo-European language at home (85% speak English very well , 10% speak English well , 5% speak English not well ).of residents speak Asian or Pacific Island language at home (61% speak English very well , 34% speak English well , 5% speak English not well ).of residents speak other language at home (49% speak English very well , 23% speak English well , 28% speak English not well ).
Foreign born population: 2,442 (6.5%)of them are naturalized citizens )
Median number of rooms in houses and condos:
Median number of rooms in apartments
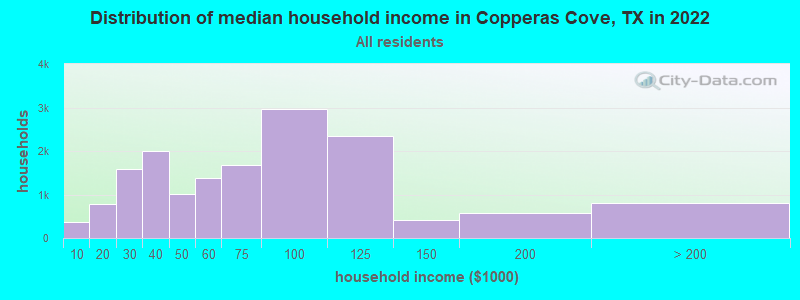
Copperas Cove, TX household income distribution 368 Less than $10,000788 $10,000 to $19,9991,578 $20,000 to $29,9992,001 $30,000 to $39,9991,008 $40,000 to $49,9991,386 $50,000 to $59,9991,670 $60,000 to $74,9992,969 $75,000 to $99,9992,343 $100,000 to $124,999425 $125,000 to $149,999579 $150,000 to $199,999808 $200,000 or more
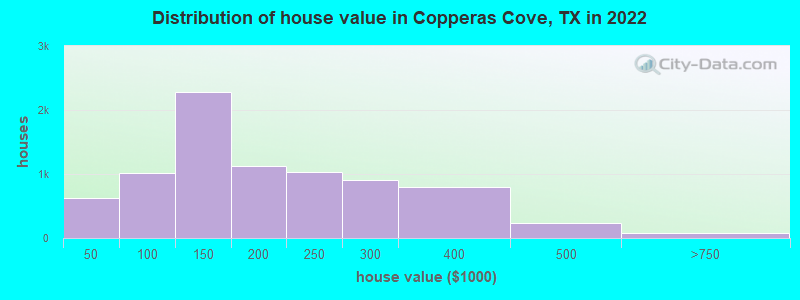
Home value of owner - occupied houses in 2022 in Copperas Cove, TX 79 Less than $10,00026 $10,000 to $14,999107 $15,000 to $19,999128 $20,000 to $24,9997 $25,000 to $29,99941 $30,000 to $34,99959 $35,000 to $39,999181 $40,000 to $49,999117 $50,000 to $59,999162 $60,000 to $69,999163 $70,000 to $79,999150 $80,000 to $89,999235 $90,000 to $99,9991,152 $100,000 to $124,9991,124 $125,000 to $149,999525 $150,000 to $174,999597 $175,000 to $199,9991,031 $200,000 to $249,999914 $250,000 to $299,999793 $300,000 to $399,999231 $400,000 to $499,99945 $500,000 to $749,9998 $750,000 to $999,99923 $1,000,000 to $1,499,9996 $2,000,000 or moreRent paid by renters in 2022 in Copperas Cove, TX 10 $100 to $14958 $150 to $19911 $200 to $249173 $300 to $34951 $350 to $399254 $400 to $449203 $450 to $499348 $500 to $549349 $550 to $599547 $600 to $649475 $650 to $699414 $700 to $749296 $750 to $799626 $800 to $899776 $900 to $999869 $1,000 to $1,249284 $1,250 to $1,499272 $1,500 to $1,99962 $2,000 to $2,49912 $3,000 to $3,499116 No cash rent
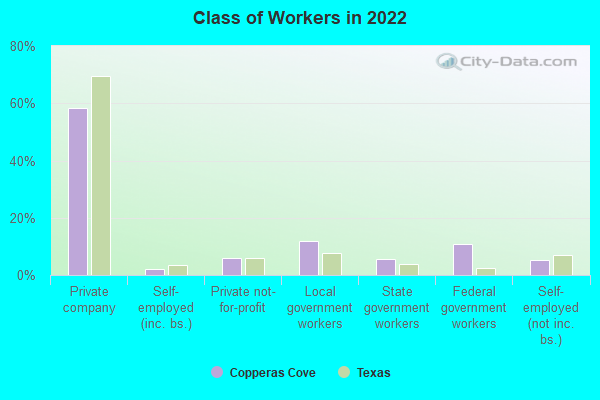
Percentage of workers working in this county: 43.7%Number of people working at home: 1,822 (10.7% of all workers )
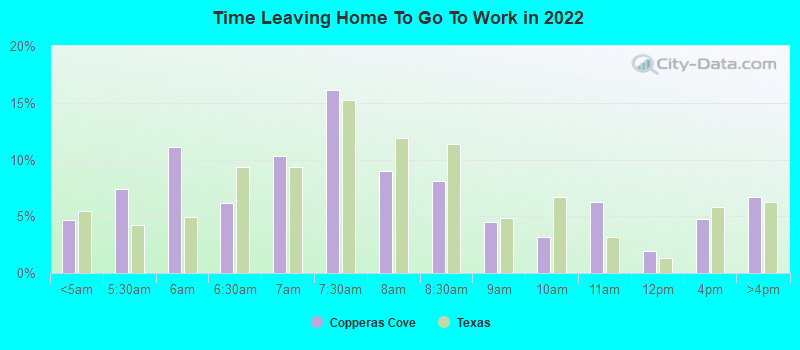
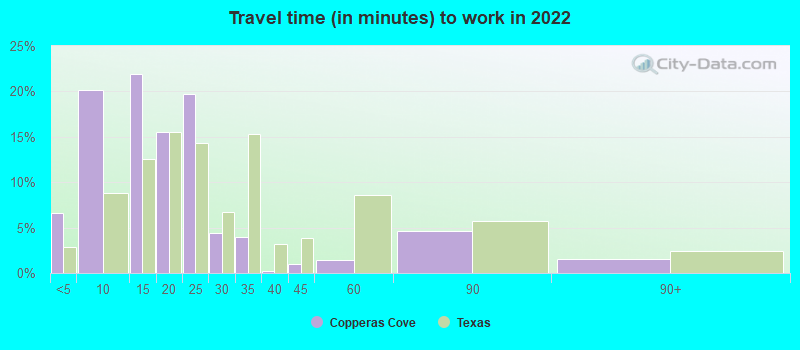
Travel time to work (commute)
Less than 5 minutes: 4885 to 9 minutes: 1,62110 to 14 minutes: 2,04415 to 19 minutes: 3,44120 to 24 minutes: 2,37025 to 29 minutes: 99930 to 34 minutes: 1,10035 to 39 minutes: 25040 to 44 minutes: 37445 to 59 minutes: 67160 to 89 minutes: 99390 or more minutes: 1,321
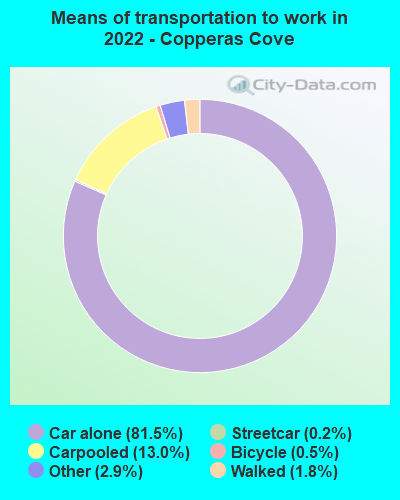
Means of transportation to work:
Drove a car alone: 5,326 (64.4%)Carpooled: 926 (11.2%)Bus : 3 (0.0%)Subway or elevated rail : 7 (0.1%)Taxi: 232 (2.8%)Bicycle: 33 (0.4%)Walked: 124 (1.5%)Worked at home: 1,822 (22.0%)
Unemployment by race in 2022
Unemployment rate for White non-Hispanic residents 8.9% Males10.1% FemalesUnemployment rate for Black residents 6.3% Males3.2% FemalesUnemployment rate for American Indian and Alaska Native residents 52.8% FemalesUnemployment rate for Asian residents 12.1% MalesUnemployment rate for other race residents 10.8% Males11.6% FemalesUnemployment rate for two or more race residents 3.0% Males8.8% FemalesUnemployment rate for Hispanic or Latino residents 6.1% Males11.7% Females
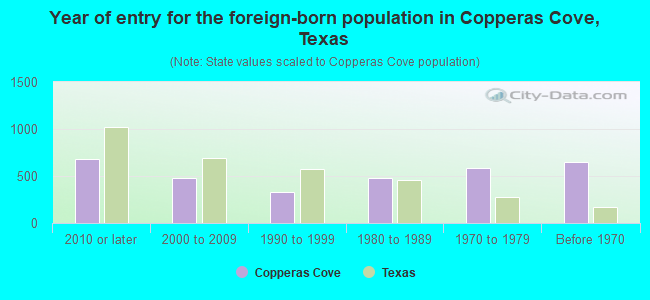
Year of entry for the foreign-born population in Copperas Cove, Texas
681 2010 or later 476 2000 to 2009 327 1990 to 1999 478 1980 to 1989 585 1970 to 1979 645 Before 1970
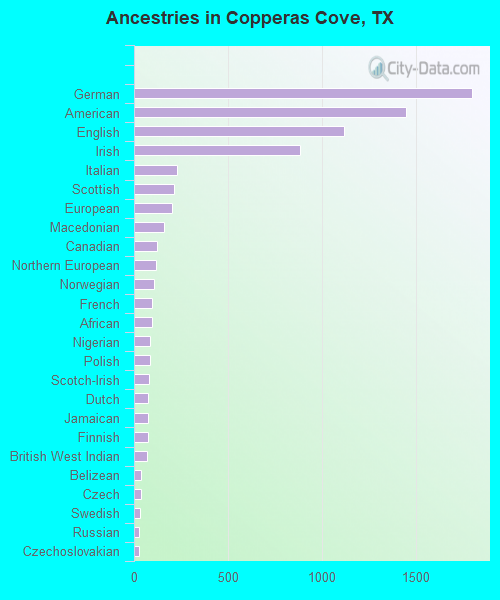
First ancestries reported:
German: 1,799 (11.3%)
American: 1,447 (9.1%)
English: 1,120 (7.0%)
Irish: 883 (5.5%)
Italian: 228 (1.4%)
Scottish: 213 (1.3%)
European: 204 (1.3%)
Macedonian: 161 (1.0%)
Canadian: 123 (0.8%)
Northern European: 115 (0.7%)
Norwegian: 105 (0.7%)
French: 95 (0.6%)
African: 94 (0.6%)
Nigerian: 85 (0.5%)
Polish: 84 (0.5%)
Scotch-Irish: 80 (0.5%)
Dutch: 77 (0.5%)
Jamaican: 76 (0.5%)
Finnish: 74 (0.5%)
British West Indian: 71 (0.4%)
Belizean: 39 (0.2%)
Czech: 36 (0.2%)
Swedish: 31 (0.2%)
Russian: 29 (0.2%)
Czechoslovakian: 28 (0.2%)
Icelander: 28 (0.2%)
Arab: 26 (0.2%)
Scandinavian: 24 (0.2%)
British: 22 (0.1%)
Israeli: 20 (0.1%)
Haitian: 20 (0.1%)
Welsh: 19 (0.1%)
Albanian: 18 (0.1%)
Brazilian: 17 (0.1%)
Lebanese: 17 (0.1%)
Turkish: 17 (0.1%)
Latvian: 11 (0.07%)
Romanian: 10 (0.06%)
French Canadian: 9 (0.06%)
Danish: 8 (0.05%)
Australian: 4 (0.03%) Most common places of birth for foreign-born residents (%): Germany Copperas Cove:
23.9% (538)Texas:
0.8% (37,989)
Mexico Copperas Cove:
13.9% (314)Texas:
48.4% (2,411,723)
Korea Copperas Cove:
8.5% (191)Texas:
1.2% (60,172)
Philippines Copperas Cove:
8.4% (189)Texas:
2.1% (103,148)
North Macedonia (Macedonia) Copperas Cove:
6.7% (150)Texas:
0.0% (1,086)
Dominican Republic Copperas Cove:
4.7% (106)Texas:
0.3% (13,763)
Canada Copperas Cove:
3.9% (88)Texas:
1.1% (55,371)
Jamaica Copperas Cove:
2.8% (64)Texas:
0.4% (17,748)
Colombia Copperas Cove:
2.4% (53)Texas:
1.2% (61,555)
Russia Copperas Cove:
2.2% (50)Texas:
0.3% (16,984)
Oceania, n.e.c. Copperas Cove:
1.9% (42)Texas:
0.1% (2,687)
Ghana Copperas Cove:
1.5% (34)Texas:
0.3% (12,580)
Place of birth for U.S.-born residents:
This state: 11,981Other state: 20,423Northeast: 3,366Midwest: 5,103South: 6,316West: 5,686 74.4% of Copperas Cove residents lived in the same house 1 years ago.
Out of people who lived in different houses, 20.4% lived in this county.
Out of people who lived in different counties, 41.5% lived in Texas.
Copperas Cove:
74.4%State average:
85.7%
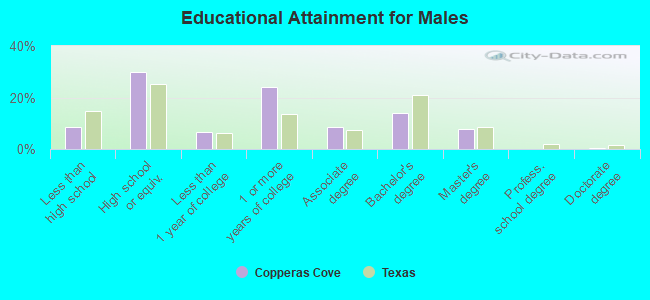
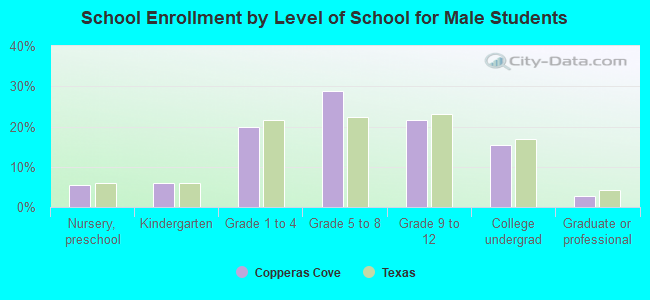
Education attainment for males 25 years and older:
No schooling: 103Nursery to 4th grade: 825th and 6th grade: 757th and 8th grade: 129th grade: 9810th grade: 6811th grade: 34612th grade, no diploma: 280High school graduate (or equivalency): 3,691Less than 1 year of college: 836Some college more than 1 year, no degree: 2,950Associate degree: 1,056Bachelor's degree: 1,737Master's degree: 940Professional school degree: 21Doctorate degree: 47
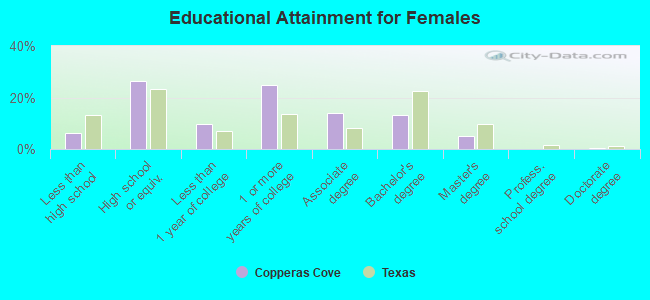
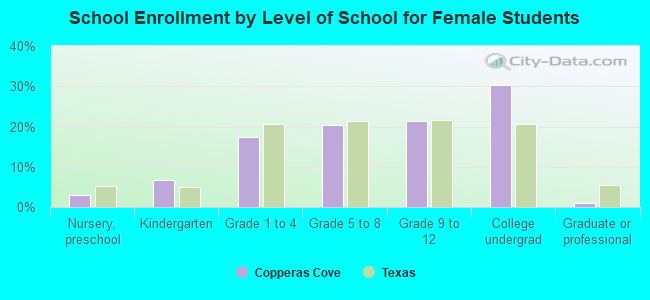
Education attainment for females 25 years and older:
No schooling: 152Nursery to 4th grade: 325th and 6th grade: 67th and 8th grade: 309th grade: 7410th grade: 3111th grade: 17812th grade, no diploma: 245High school graduate (or equivalency): 3,101Less than 1 year of college: 1,152Some college more than 1 year, no degree: 2,954Associate degree: 1,627Bachelor's degree: 1,549Master's degree: 603Professional school degree: 23Doctorate degree: 45
Housing units in structures:
One, detached: 10,352One, attached: 322Two: 1,5813 or 4: 1,0015 to 9: 58810 to 19: 53020 to 49: 29550 or more: 278Mobile homes: 398Boats, RVs, vans, etc.: 11Median worth of mobile homes: $24,830
Housing units lacking complete plumbing facilities in 2022: 1.3%Housing units lacking complete kitchen facilities in 2022: 1.0%House/condo owner moved in on average 6 years ago
Renter moved in on average 1 years ago
Private vs. public school enrollment:
Students in private schools in grades 1 to 8 (elementary and middle school): 131 Students in private schools in grades 9 to 12 (high school): 75 Students in private undergraduate colleges: 254