Cortlandt, NY (New York) Houses and Residents
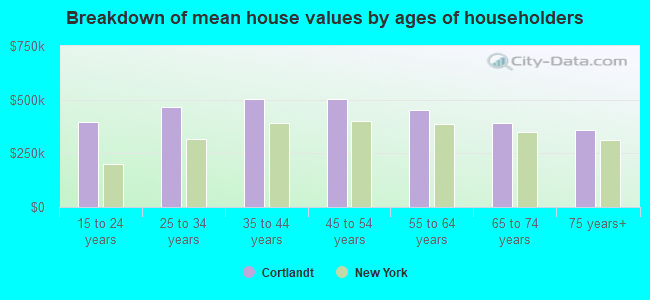
| Cortlandt: | $517,080 |
| New York: | $400,400 |
Total population: 41,592 (Urban population: 36,060, Rural population: 2,407 (all nonfarm))
Houses: 14,065 (13,517 occupied: 10,504 owner occupied, 3,013 renter occupied)
| % of renters here: | 22% |
| State: | 46% |
Housing density: 355 houses/condos per square mile
Median price asked for vacant for-sale houses and condos in 2022 in this county: $406,754.
Median contract rent in 2022: $1,674 (lower quartile is $1,240, upper quartile is over $2,000)
Median rent asked for vacant for-rent units in 2022: $1,666
Median gross rent in Cortlandt, NY in 2022: $1,789
Housing units in Cortlandt with a mortgage: 7,009 (653 second mortgage, 828 home equity loan, 13 both second mortgage and home equity loan)
Houses without a mortgage: 2,407
Compare current foreclosures near Cortlandt, NY:
| Photo | Address | Area | Beds / Baths | Price | Details |
|---|---|---|---|---|---|

|
#1
N Riverside Ave
Croton On Hudson, NY 10520
|
1,642 sq. feet
|
2 baths 3 beds |
$585,000
|
show details |

|
#2
Crane Ave
White Plains, NY 10603
|
2,400 sq. feet
|
2 baths 4 beds |
$654,500
|
show details |

|
#3
Chalmers Blvd
Amawalk, NY 10501
|
1,072 sq. feet
|
1 baths 1 beds |
$475,000
|
show details |

|
#4
Oakdale Mnr Apt A6d
Suffern, NY 10901
|
750 sq. feet
|
1 baths 1 beds |
$99,900
|
show details |

|
#5
N Main St Apt C-15
Spring Valley, NY 10977
|
800 sq. feet
|
1 baths 1 beds |
$85,000
|
show details |

|
#6
N Broadway
Irvington, NY 10533
|
850 sq. feet
|
1 baths 2 beds |
$315,000
|
show details |

|
#7
Croton Park Rd
Cortlandt Manor, NY 10567
|
658 sq. feet
|
1 baths 1 beds |
$176,900
|
show details |

|
#8
Lenni Lenape Ct
Stony Point, NY 10980
|
3,252 sq. feet
|
3 baths 4 beds |
$699,900
|
show details |

|
#9
Raven Ct
Armonk, NY 10504
|
- sq. feet
|
2 baths 3 beds |
$1,560,000
|
show details |

|
#10
Clinton Ln
Spring Valley, NY 10977
|
3,137 sq. feet
|
3 baths 6 beds |
show details |
| Photo | Address | Area | Beds / Baths | Price | Details |
|---|---|---|---|---|---|

|
#11
Lea Ct
Pomona, NY 10970
|
3,188 sq. feet
|
3 baths 5 beds |
show details | |

|
#12
Silver Spring Rd
New Windsor, NY 12553
|
1,800 sq. feet
|
1 baths 5 beds |
show details | |

|
#13
Kings Hwy
Valley Cottage, NY 10989
|
1,754 sq. feet
|
3 baths 4 beds |
show details | |

|
#14
Rella Dr
New City, NY 10956
|
3,433 sq. feet
|
3 baths 6 beds |
show details | |

|
#15
Ferris Dr
Garrison, NY 10524
|
1,937 sq. feet
|
2 baths 3 beds |
show details | |

|
#16
A-B Ridge Ave
Suffern, NY 10901
|
- sq. feet
|
2 baths 4 beds |
show details | |

|
#17
James St
Stony Point, NY 10980
|
1,134 sq. feet
|
1 baths 2 beds |
show details | |

|
#18
Rosalind Ave
Pleasantville, NY 10570
|
2,700 sq. feet
|
3 baths 4 beds |
show details | |

|
#19
Fox Ct
Suffern, NY 10901
|
2,749 sq. feet
|
2 baths 3 beds |
show details | |

|
#20
John F. Kennedy Drive
Stony Point, NY 10980
|
1,944 sq. feet
|
2 baths 3 beds |
show details |
| Photo | Address | Area | Beds / Baths | Price | Details |
|---|---|---|---|---|---|

|
#21
William St
Ossining, NY 10562
|
1,160 sq. feet
|
2 baths 3 beds |
show details | |

|
#22
Zarriello Ln
West Haverstraw, NY 10993
|
1,350 sq. feet
|
2 baths 3 beds |
show details | |

|
#23
Zarriello Ln
West Haverstraw, NY 10993
|
1,350 sq. feet
|
2 baths 3 beds |
show details | |

|
#24
Ellis Pl
Ossining, NY 10562
|
1,432 sq. feet
|
2 baths 3 beds |
show details | |

|
#25
Chestnut Ave
New Windsor, NY 12553
|
985 sq. feet
|
1 baths 3 beds |
show details | |

|
#26
Amory Ave
Pearl River, NY 10965
|
1,730 sq. feet
|
2 baths 3 beds |
show details | |

|
#27
John St
Ossining, NY 10562
|
1,536 sq. feet
|
2 baths 4 beds |
show details | |

|
#28
Jennifer Ct
Spring Valley, NY 10977
|
2,144 sq. feet
|
3 baths 5 beds |
show details | |

|
#29
Estates Dr
Ossining, NY 10562
|
3,293 sq. feet
|
3 baths 4 beds |
show details | |

|
#30
Kevin Dr
Suffern, NY 10901
|
2,579 sq. feet
|
3 baths 5 beds |
show details |
| Photo | Address | Area | Beds / Baths | Price | Details |
|---|---|---|---|---|---|

|
#31
Quince Lane Aka 41 N. Quince Lane
Monsey, NY 10952
|
4,522 sq. feet
|
5 baths 8 beds |
show details | |

|
#32
Walnut Dr
Mahopac, NY 10541
|
2,284 sq. feet
|
2 baths 4 beds |
show details | |

|
#33
Corey Ln
Cold Spring, NY 10516
|
1,029 sq. feet
|
1 baths 2 beds |
show details | |

|
#34
Park Ave
Highland Mills, NY 10930
|
2,105 sq. feet
|
1 baths 3 beds |
show details | |

|
#35
Colonial Rd
Westwood, NJ 07675
|
2,528 sq. feet
|
3 baths 5 beds |
show details | |

|
#36
Crompond Rd Apt B6
Peekskill, NY 10566
|
900 sq. feet
|
1 baths 2 beds |
show details | |

|
#37
Grove St
Putnam Valley, NY 10579
|
2,338 sq. feet
|
2 baths 3 beds |
show details | |

|
#38
Colony Dr
Monroe, NY 10950
|
888 sq. feet
|
1 baths 3 beds |
show details | |

|
#39
Crescent Rd
Mahopac, NY 10541
|
1,260 sq. feet
|
1 baths 3 beds |
show details | |

|
#40
Edgebrook Ln
Monsey, NY 10952
|
1,816 sq. feet
|
2 baths 4 beds |
show details |
| Photo | Address | Area | Beds / Baths | Price | Details |
|---|---|---|---|---|---|

|
#41
Oakdale Rd
Putnam Valley, NY 10579
|
1,536 sq. feet
|
1 baths 2 beds |
show details | |

|
#42
Mayer Dr
Suffern, NY 10901
|
1,906 sq. feet
|
3 baths 3 beds |
show details | |

|
#43
S Monsey Rd
Monsey, NY 10952
|
1,942 sq. feet
|
2 baths 4 beds |
show details | |

|
#44
Laura Dr
Monsey, NY 10952
|
2,400 sq. feet
|
2 baths 4 beds |
show details | |

|
#45
Seminary Hill Rd
Carmel, NY 10512
|
1,181 sq. feet
|
1 baths 2 beds |
show details | |

|
#46
Laura Dr
Monsey, NY 10952
|
2,400 sq. feet
|
2 baths 4 beds |
show details | |

|
#47
Vista On The Lk
Carmel, NY 10512
|
856 sq. feet
|
1 baths 2 beds |
show details | |

|
#48
Pennington Way
Spring Valley, NY 10977
|
2,040 sq. feet
|
2 baths 4 beds |
show details | |

|
#49
Carlton Rd
Orangeburg, NY 10962
|
1,504 sq. feet
|
1 baths 3 beds |
show details | |

|
Check over 1 million property listings on Foreclosure.com!
|
browse all offers | |||

Household type by relationship:
Households: 920,409- In family households: 787,571 (154,325 male householders, 82,094 female householders)
177,077 spouses, 289,201 children (277,229 natural, 5,836 adopted, 6,136 stepchildren), 13,465 grandchildren, 12,621 brothers or sisters, 11,677 parents, foster children, 16,923 other relatives, 23,097 non-relatives
- In nonfamily households: 132,838 (45,065 male householders (36,259 living alone)), 65,748 female householders (58,355 living alone)), 22,025 nonrelatives
- In group quarters: 28,704 (13,258 institutionalized population)
167,242 married couples with children.
43,170 single-parent households (7,022 men, 36,148 women).
83.7% of residents of Cortlandt speak English at home.
6.6% of residents speak Spanish at home (65% speak English very well, 18% speak English well, 14% speak English not well, 3% don't speak English at all).
7.5% of residents speak other Indo-European language at home (73% speak English very well, 19% speak English well, 7% speak English not well, 1% don't speak English at all).
1.5% of residents speak Asian or Pacific Island language at home (60% speak English very well, 27% speak English well, 13% speak English not well).
0.8% of residents speak other language at home (85% speak English very well, 15% speak English well).
Foreign born population: 5,424 (13.1%)
(80.5% of them are naturalized citizens)
| Here: | 6.5 |
| State: | 6.3 |
| Here: | 3.7 |
| State: | 3.8 |
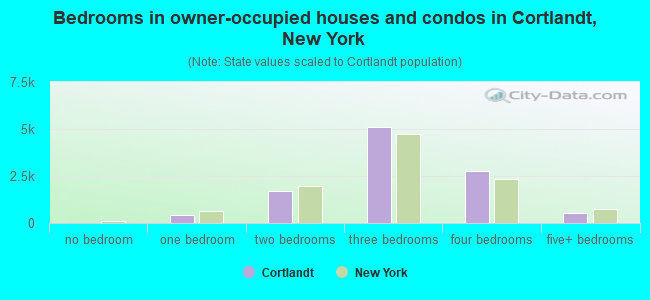
- Bedrooms in owner-occupied houses and condos in Cortlandt, New York
- 26no bedroom
- 4201 bedroom
- 1,6782 bedrooms
- 5,0863 bedrooms
- 2,7524 bedrooms
- 5425+ bedrooms
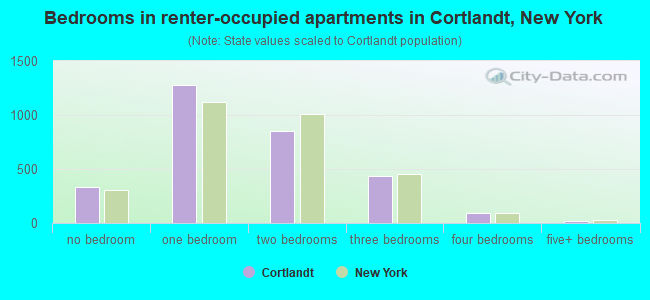
- Bedrooms in renter-occupied apartments in Cortlandt, New York
- 336no bedroom
- 1,2821 bedroom
- 8542 bedrooms
- 4323 bedrooms
- 954 bedrooms
- 145+ bedrooms
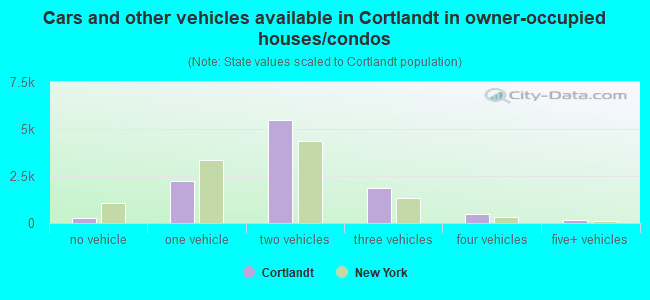
- Cars and other vehicles available in Cortlandt in owner-occupied houses/condos
- 264no vehicle
- 2,2581 vehicle
- 5,4642 vehicles
- 1,8693 vehicles
- 4834 vehicles
- 1665+ vehicles
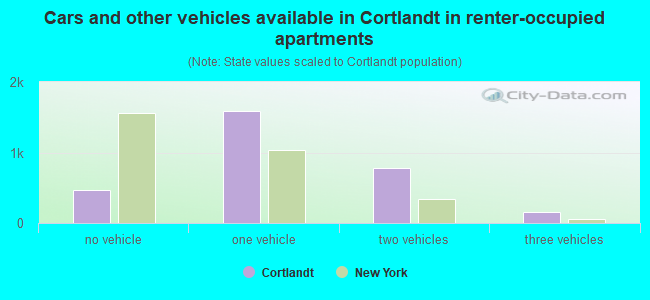
- Cars and other vehicles available in Cortlandt in renter-occupied apartments
- 465no vehicle
- 1,5891 vehicle
- 7842 vehicles
- 1583 vehicles
- 94 vehicles
- 85+ vehicles
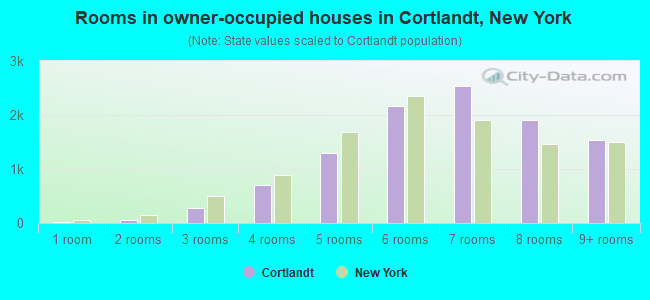
- Rooms in owner-occupied houses in Cortlandt, New York
- 261 room
- 552 rooms
- 2703 rooms
- 7124 rooms
- 1,2945 rooms
- 2,1736 rooms
- 2,5407 rooms
- 1,8998 rooms
- 1,5359+ rooms
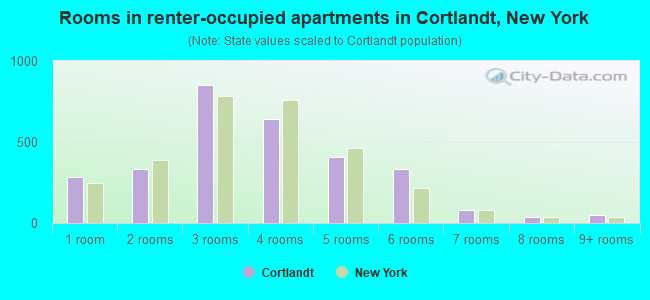
- Rooms in renter-occupied apartments in Cortlandt, New York
- 2821 room
- 3362 rooms
- 8503 rooms
- 6434 rooms
- 4055 rooms
- 3326 rooms
- 787 rooms
- 408 rooms
- 479+ rooms
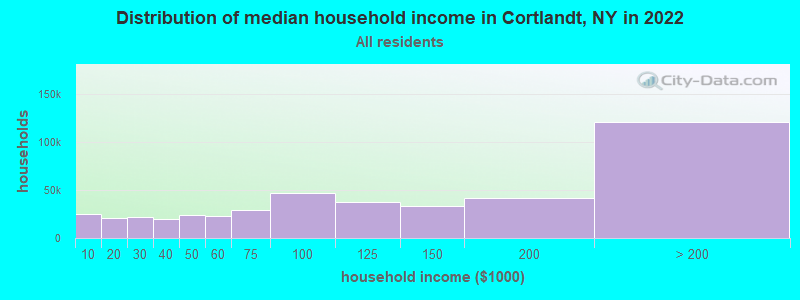
Cortlandt, NY household income distribution

- 24,835Less than $10,000
- 20,756$10,000 to $19,999
- 21,802$20,000 to $29,999
- 19,734$30,000 to $39,999
- 23,725$40,000 to $49,999
- 23,032$50,000 to $59,999
- 29,560$60,000 to $74,999
- 46,427$75,000 to $99,999
- 37,174$100,000 to $124,999
- 33,619$125,000 to $149,999
- 41,813$150,000 to $199,999
- 120,697$200,000 or more
Percentage of workers working in this county: 74.2%
Number of people working at home: 3,881 (18.0% of all workers)
Travel time to work (commute)
- Less than 5 minutes: 582
- 5 to 9 minutes: 1,663
- 10 to 14 minutes: 1,896
- 15 to 19 minutes: 1,471
- 20 to 24 minutes: 1,119
- 25 to 29 minutes: 716
- 30 to 34 minutes: 2,186
- 35 to 39 minutes: 710
- 40 to 44 minutes: 984
- 45 to 59 minutes: 2,197
- 60 to 89 minutes: 2,614
- 90 or more minutes: 1,644
Means of transportation to work:
- Drove a car alone: 13,068 (69.6%)
- Carpooled: 1,487 (7.9%)
- Bus or trolley bus: 158 (0.8%)
- Subway or elevated: 24 (0.1%)
- Railroad: 2,525 (13.4%)
- Taxi: 22 (0.1%)
- Motorcycle: 10 (0.1%)
- Bicycle: 6 (0.0%)
- Walked: 402 (2.1%)
- Other means: 80 (0.4%)
- Worked at home: 994 (5.3%)
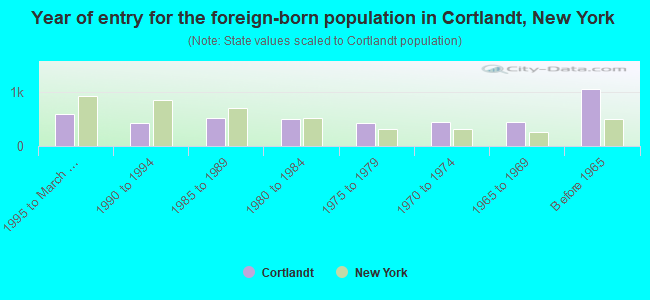
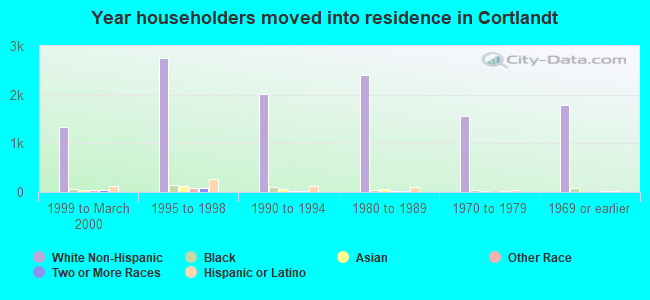
- Year of entry for the foreign-born population in Cortlandt, New York
- 5951995 to March 2000
- 4201990 to 1994
- 5101985 to 1989
- 4981980 to 1984
- 4221975 to 1979
- 4411970 to 1974
- 4441965 to 1969
- 1,041Before 1965
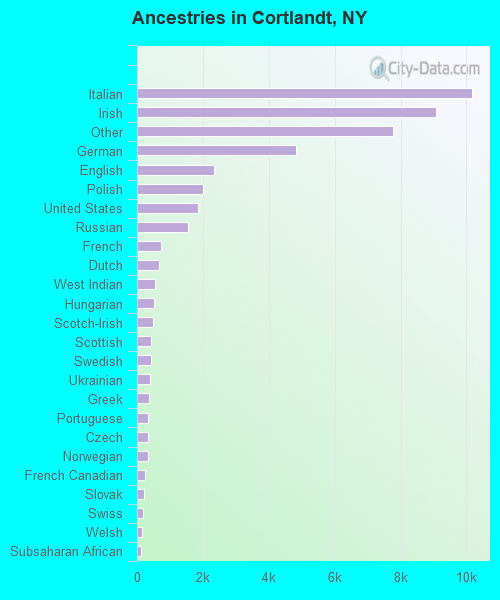
First ancestries reported:
- Italian: 10,177 (22.0%)
- Irish: 9,084 (19.6%)
- Other: 7,774 (16.8%)
- German: 4,829 (10.4%)
- English: 2,340 (5.0%)
- Polish: 1,996 (4.3%)
- United States: 1,859 (4.0%)
- Russian: 1,562 (3.4%)
- French: 723 (1.6%)
- Dutch: 668 (1.4%)
- West Indian: 532 (1.1%)
- Hungarian: 517 (1.1%)
- Scotch-Irish: 483 (1.0%)
- Scottish: 422 (0.9%)
- Swedish: 413 (0.9%)
- Ukrainian: 404 (0.9%)
- Greek: 371 (0.8%)
- Portuguese: 338 (0.7%)
- Czech: 334 (0.7%)
- Norwegian: 334 (0.7%)
- French Canadian: 238 (0.5%)
- Slovak: 202 (0.4%)
- Swiss: 183 (0.4%)
- Welsh: 166 (0.4%)
- Subsaharan African: 129 (0.3%)
- Lithuanian: 121 (0.3%)
- Danish: 104 (0.2%)
- Arab: 47 (0.1%)
Most common places of birth for foreign-born residents (%):
| Cortlandt: | 11.6% (505) |
| New York: | 3.8% (147,729) |
| Cortlandt: | 6.8% (296) |
| New York: | 3.0% (117,238) |
| Cortlandt: | 6.5% (282) |
| New York: | 3.6% (139,226) |
| Cortlandt: | 5.7% (249) |
| New York: | 1.8% (69,327) |
| Cortlandt: | 4.3% (190) |
| New York: | 5.9% (226,470) |
| Cortlandt: | 4.1% (178) |
| New York: | 1.1% (41,934) |
| Cortlandt: | 4.0% (177) |
| New York: | 1.6% (62,237) |
| Cortlandt: | 3.6% (156) |
| New York: | 6.0% (233,766) |
| Cortlandt: | 2.9% (127) |
| New York: | 2.9% (111,727) |
| Cortlandt: | 2.8% (123) |
| New York: | 1.9% (72,408) |
| Cortlandt: | 2.8% (122) |
| New York: | 10.5% (408,086) |
| Cortlandt: | 2.3% (100) |
| New York: | 1.1% (43,753) |
| Cortlandt: | 2.2% (96) |
| New York: | 0.8% (32,034) |
| Cortlandt: | 2.1% (92) |
| New York: | 0.3% (11,866) |
| Cortlandt: | 2.1% (91) |
| New York: | 1.4% (54,876) |
| Cortlandt: | 1.9% (84) |
| New York: | 2.4% (93,187) |
| Cortlandt: | 1.8% (80) |
| New York: | 0.3% (13,508) |
| Cortlandt: | 1.8% (78) |
| New York: | 0.3% (12,209) |
| Cortlandt: | 1.7% (73) |
| New York: | 1.1% (42,335) |
Place of birth for U.S.-born residents:
- This state: 29,151
- Other state: 4,481
- Northeast: 2,088
- Midwest: 1,018
- South: 889
- West: 486
67% of Cortlandt residents lived in the same house 5 years ago.
Out of people who lived in different houses, 63% lived in this county.
Out of people who lived in different counties, 65% lived in New York.
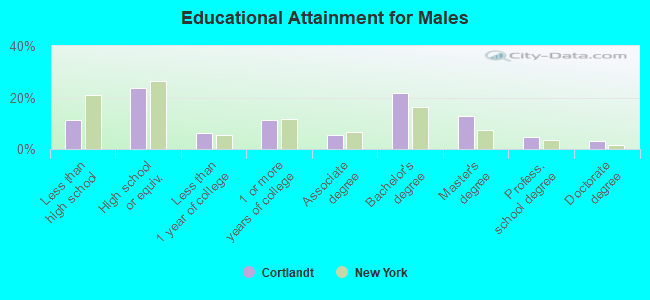
Education attainment for males 25 years and older:
- No schooling: 68
- Nursery to 4th grade: 42
- 5th and 6th grade: 85
- 7th and 8th grade: 198
- 9th grade: 178
- 10th grade: 198
- 11th grade: 207
- 12th grade, no diploma: 425
- High school graduate (or equivalency): 2,971
- Less than 1 year of college: 775
- Some college more than 1 year, no degree: 1,431
- Associate degree: 659
- Bachelor's degree: 2,751
- Master's degree: 1,626
- Professional school degree: 577
- Doctorate degree: 370
Education attainment for females 25 years and older:
- No schooling: 13
- Nursery to 4th grade: 54
- 5th and 6th grade: 155
- 7th and 8th grade: 210
- 9th grade: 112
- 10th grade: 155
- 11th grade: 103
- 12th grade, no diploma: 372
- High school graduate (or equivalency): 3,712
- Less than 1 year of college: 857
- Some college more than 1 year, no degree: 1,408
- Associate degree: 1,073
- Bachelor's degree: 2,983
- Master's degree: 2,022
- Professional school degree: 332
- Doctorate degree: 190

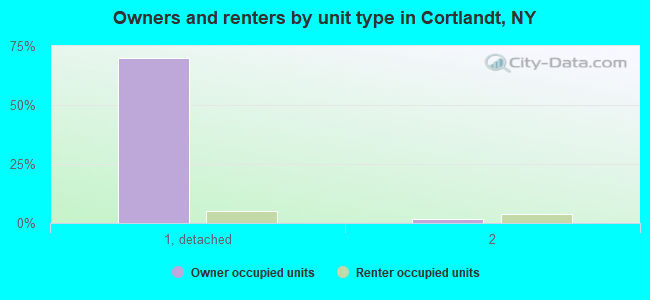
Housing units in structures:
- One, detached: 10,433
- One, attached: 606
- Two: 800
- 3 or 4: 571
- 5 to 9: 420
- 10 to 19: 473
- 20 to 49: 556
- 50 or more: 186
- Mobile homes: 20
Median worth of mobile homes: $208,316
Housing units lacking complete kitchen facilities: 0.2%
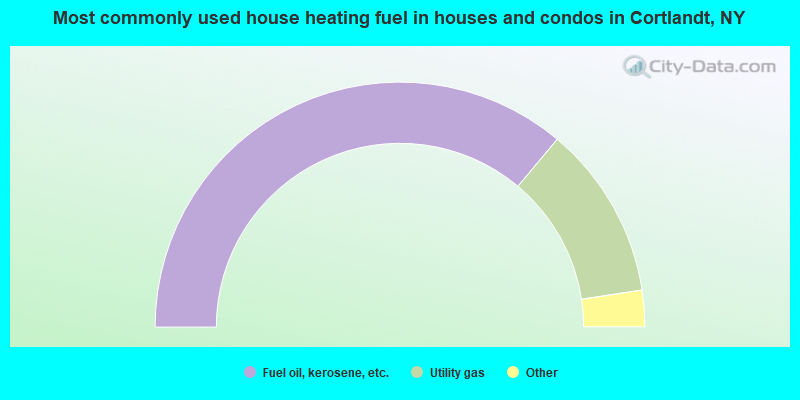
- 72.2%Fuel oil, kerosene, etc.
- 23.0%Utility gas
- 2.7%Electricity
- 1.6%Bottled, tank, or LP gas
- 0.2%Wood
- 0.2%Coal or coke
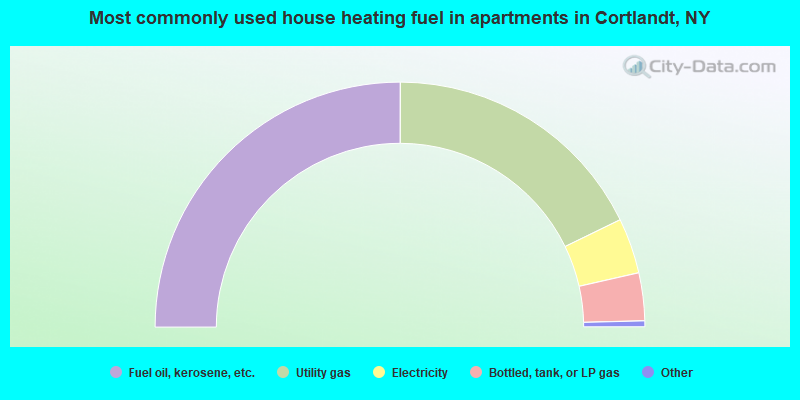
- 50.0%Fuel oil, kerosene, etc.
- 35.5%Utility gas
- 7.3%Electricity
- 6.3%Bottled, tank, or LP gas
- 0.6%Other fuel
- 0.2%Coal or coke
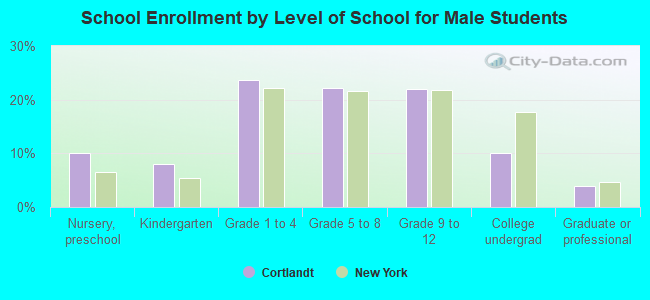
Private vs. public school enrollment:
| Here: | 9.2% |
| New York: | 14.0% |
| Here: | 15.1% |
| New York: | 13.2% |
| Here: | 40.7% |
| New York: | 38.2% |