Cottage Lake, WA (Washington) Houses and Residents
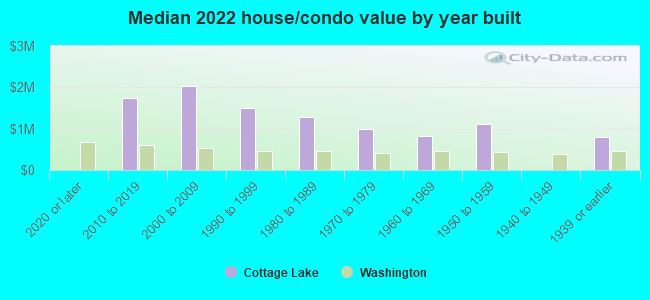
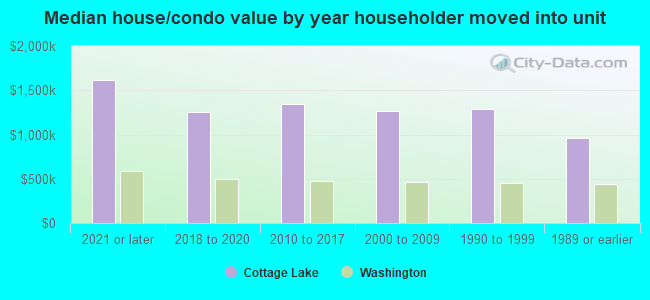
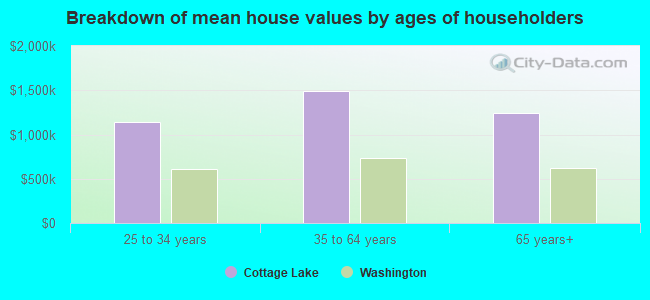
| Cottage Lake: | $1,238,669 |
| Washington: | $569,500 |
Total population: 22,494 (All urban)
Houses: 8,281 (8,086 occupied: 7,413 owner occupied, 662 renter occupied)
| % of renters here: | 8% |
| State: | 36% |
Housing density: 363 houses/condos per square mile
Median price asked for vacant for-sale houses and condos in 2022: $7,161,468.
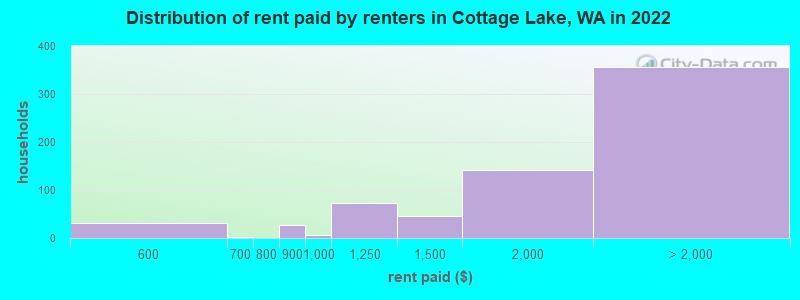
Median contract rent in 2022: $1,959 (lower quartile is $1,403, upper quartile is over $2,000)
Median rent asked for vacant for-rent units in 2022: $2,289
Median gross rent in Cottage Lake, WA in 2022: over $2,000
Housing units in Cottage Lake with a mortgage: 5,233 (863 second mortgage, 0 home equity loan, 836 both second mortgage and home equity loan)
Houses without a mortgage: 141
Median household income for houses/condos with a mortgage: $227,577
Median household income for apartments without a mortgage: $147,782
Median monthly housing costs: $2,976
Compare current foreclosures near Cottage Lake, WA:
| Photo | Address | Area | Beds / Baths | Price | Details |
|---|---|---|---|---|---|

|
#1
3rd Dr SE
Bothell, WA 98012
|
1,957 sq. feet
|
2 baths 4 beds |
show details | |

|
#2
100th St SW Apt B206
Everett, WA 98204
|
856 sq. feet
|
2 baths 2 beds |
show details | |

|
#3
1st Ave S # 806
Seattle, WA 98104
|
806 sq. feet
|
1 baths 1 beds |
show details | |

|
#4
4th Ave W Apt 6a
Everett, WA 98204
|
1,346 sq. feet
|
3 baths 2 beds |
show details | |

|
#5
Newport Way NW Apt D2
Issaquah, WA 98027
|
1,545 sq. feet
|
2 baths 3 beds |
show details | |

|
#6
126th Pl SE
Renton, WA 98056
|
2,450 sq. feet
|
2 baths 4 beds |
show details | |

|
#7
Cascadian Way
Bothell, WA 98012
|
1,492 sq. feet
|
2 baths 3 beds |
show details | |

|
#8
67th Pl W
Mountlake Terrace, WA 98043
|
2,194 sq. feet
|
2 baths 5 beds |
show details | |

|
#9
91st Ave W
Edmonds, WA 98026
|
1,504 sq. feet
|
1 baths 3 beds |
show details | |

|
#10
NE 172nd St
Duvall, WA 98019
|
3,780 sq. feet
|
3 baths 4 beds |
show details |
| Photo | Address | Area | Beds / Baths | Price | Details |
|---|---|---|---|---|---|

|
#11
Wildwood Blvd SW
Issaquah, WA 98027
|
1,590 sq. feet
|
2 baths 3 beds |
show details | |

|
#12
50th Ave S
Seattle, WA 98118
|
850 sq. feet
|
1 baths 2 beds |
show details | |

|
#13
Ravenna Ave NE
Seattle, WA 98125
|
1,660 sq. feet
|
2 baths 4 beds |
show details | |

|
#14
E Lynn St
Seattle, WA 98102
|
792 sq. feet
|
1 baths - beds |
show details | |

|
#15
152nd St SE
Monroe, WA 98272
|
2,573 sq. feet
|
3 baths 3 beds |
show details | |

|
#16
148th St SE
Everett, WA 98208
|
1,466 sq. feet
|
2 baths 3 beds |
show details | |

|
#17
Storm Lake Rd
Snohomish, WA 98290
|
2,323 sq. feet
|
3 baths 3 beds |
show details | |

|
#18
39th Ave W
Seattle, WA 98199
|
2,800 sq. feet
|
2 baths 3 beds |
show details | |

|
#19
Mann Rd
Sultan, WA 98294
|
1,512 sq. feet
|
2 baths 2 beds |
show details | |

|
#20
211th Way NE
Sammamish, WA 98074
|
910 sq. feet
|
3 baths 4 beds |
show details |
| Photo | Address | Area | Beds / Baths | Price | Details |
|---|---|---|---|---|---|

|
#21
13th Ave NW
Seattle, WA 98117
|
1,490 sq. feet
|
2 baths 3 beds |
show details | |

|
#22
SE 24th Way
Sammamish, WA 98075
|
770 sq. feet
|
1 baths 2 beds |
show details | |

|
#23
199th Ave NE
Woodinville, WA 98077
|
2,070 sq. feet
|
1 baths 2 beds |
show details | |

|
#24
Bellevue Ave E Apt 109
Seattle, WA 98102
|
448 sq. feet
|
1 baths 1 beds |
show details | |

|
#25
W Casino Rd Apt 63
Everett, WA 98204
|
1,203 sq. feet
|
2 baths 2 beds |
show details | |

|
#26
59th Ave SE
Snohomish, WA 98296
|
2,641 sq. feet
|
2 baths 5 beds |
show details | |

|
#27
58th Ln NE
Kenmore, WA 98028
|
2,700 sq. feet
|
2 baths 3 beds |
show details | |

|
#28
20th Ave SE
Bothell, WA 98021
|
1,552 sq. feet
|
2 baths 3 beds |
show details | |

|
#29
2nd Ave NW
Seattle, WA 98177
|
1,660 sq. feet
|
2 baths 3 beds |
show details | |

|
#30
NE 88th St
Seattle, WA 98115
|
2,200 sq. feet
|
2 baths 3 beds |
show details |
| Photo | Address | Area | Beds / Baths | Price | Details |
|---|---|---|---|---|---|

|
#31
NE 190th St
Seattle, WA 98155
|
2,070 sq. feet
|
2 baths 5 beds |
show details | |

|
#32
Woods Creek Rd
Monroe, WA 98272
|
2,496 sq. feet
|
2 baths 4 beds |
show details | |

|
#33
SE 14th St
Sammamish, WA 98075
|
3,520 sq. feet
|
3 baths 6 beds |
show details | |

|
#34
49th Ave SE
Bothell, WA 98012
|
1,756 sq. feet
|
2 baths 3 beds |
show details | |

|
#35
148th St SW
Edmonds, WA 98026
|
2,227 sq. feet
|
1 baths 4 beds |
show details | |

|
#36
Eason Ave
Bothell, WA 98011
|
760 sq. feet
|
1 baths 2 beds |
show details | |

|
#37
199th St SW
Bothell, WA 98012
|
2,846 sq. feet
|
2 baths 4 beds |
show details | |

|
#38
N Ridge Dr
Snohomish, WA 98290
|
2,033 sq. feet
|
3 baths 3 beds |
show details | |

|
#39
19th Dr SE
Bothell, WA 98012
|
852 sq. feet
|
1 baths 3 beds |
show details | |

|
#40
Lake Alice Rd SE
Fall City, WA 98024
|
1,750 sq. feet
|
2 baths 3 beds |
show details |
| Photo | Address | Area | Beds / Baths | Price | Details |
|---|---|---|---|---|---|

|
#41
NE 64th St
Redmond, WA 98053
|
1,540 sq. feet
|
1 baths 3 beds |
show details | |

|
#42
119th Pl SE
Everett, WA 98208
|
1,296 sq. feet
|
1 baths 3 beds |
show details | |

|
#43
SE 47th Pl
Issaquah, WA 98029
|
2,610 sq. feet
|
2 baths 3 beds |
show details | |

|
#44
5th Ave NE
Seattle, WA 98155
|
1,460 sq. feet
|
1 baths 3 beds |
show details | |

|
#45
Olympic View Dr
Edmonds, WA 98026
|
2,378 sq. feet
|
3 baths 3 beds |
show details | |

|
#46
Heintz Ave SE
Monroe, WA 98272
|
1,455 sq. feet
|
2 baths 3 beds |
show details | |

|
#47
Interurban Blvd
Snohomish, WA 98296
|
1,156 sq. feet
|
1 baths 3 beds |
show details | |

|
#48
Hoyt Ave
Everett, WA 98203
|
1,580 sq. feet
|
1 baths 4 beds |
show details | |

|
#49
74th St SE
Everett, WA 98203
|
1,784 sq. feet
|
3 baths 4 beds |
show details | |

|
Check over 1 million property listings on Foreclosure.com!
|
browse all offers | |||


Median year apartment built: 1986
Household type by relationship:
Households: 23,360- Male householders: 4,667 (419 living alone), Female householders: 3,205 (239 living alone)
6,248 spouses (6,213 opposite-sex spouses), 351 unmarried partners, (346 opposite-sex unmarried partners), 7,448 children (6,831 natural, 395 adopted, 222 stepchildren), 173 grandchildren, 111 brothers or sisters, 208 parents, 0 foster children, 327 other relatives, 557 non-relatives
- In group quarters: 60
Size of family households: 2,914 2-persons, 1,387 3-persons, 1,570 4-persons, 598 5-persons, 182 6-persons, 77 7-or-more-persons.
Size of nonfamily households: 708 1-person, 338 2-persons, 34 3-persons, 39 4-persons, 4 5-persons.
4,584 married couples with children.
480 single-parent households (166 men, 314 women).
83.2% of residents of Cottage Lake speak English at home.
3.0% of residents speak Spanish at home (49% speak English very well, 6% speak English well, 46% speak English not well).
4.9% of residents speak other Indo-European language at home (86% speak English very well, 12% speak English well, 1% speak English not well).
6.9% of residents speak Asian or Pacific Island language at home (67% speak English very well, 16% speak English well, 13% speak English not well, 4% don't speak English at all).
0.7% of residents speak other language at home (94% speak English very well, 6% speak English well).
Foreign born population: 3,661 (15.7%)
(56.5% of them are naturalized citizens)
| Here: | 8.3 |
| State: | 6.5 |
| Here: | 5.1 |
| State: | 3.9 |
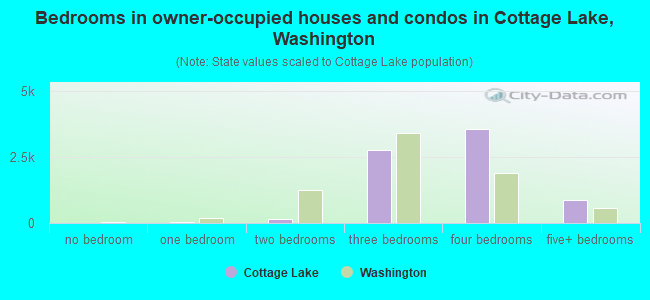
- Bedrooms in owner-occupied houses and condos in Cottage Lake, Washington
- 9no bedroom
- 381 bedroom
- 1562 bedrooms
- 2,7653 bedrooms
- 3,5674 bedrooms
- 8795+ bedrooms
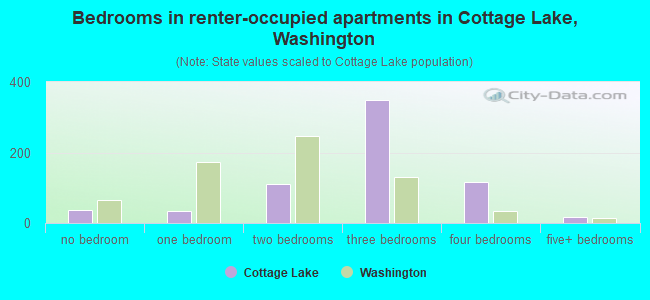
- Bedrooms in renter-occupied apartments in Cottage Lake, Washington
- 36no bedroom
- 341 bedroom
- 1112 bedrooms
- 3483 bedrooms
- 1174 bedrooms
- 175+ bedrooms
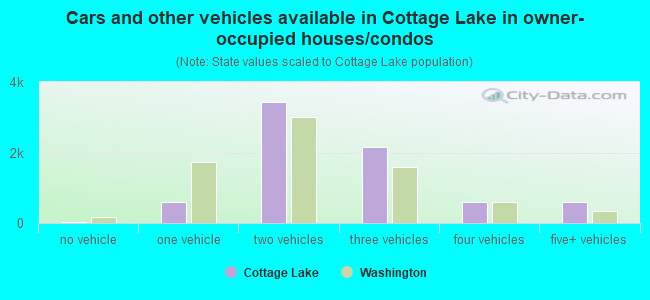
- Cars and other vehicles available in Cottage Lake in owner-occupied houses/condos
- 34no vehicle
- 5881 vehicle
- 3,4422 vehicles
- 2,1703 vehicles
- 5984 vehicles
- 5825+ vehicles
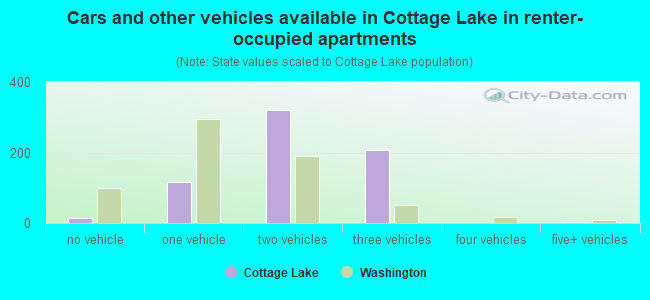
- Cars and other vehicles available in Cottage Lake in renter-occupied apartments
- 15no vehicle
- 1171 vehicle
- 3212 vehicles
- 2063 vehicles
- 04 vehicles
- 35+ vehicles
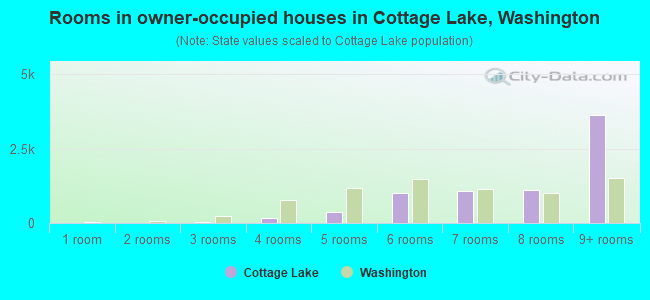
- Rooms in owner-occupied houses in Cottage Lake, Washington
- 01 room
- 92 rooms
- 503 rooms
- 1594 rooms
- 3745 rooms
- 1,0046 rooms
- 1,0727 rooms
- 1,1208 rooms
- 3,6269+ rooms
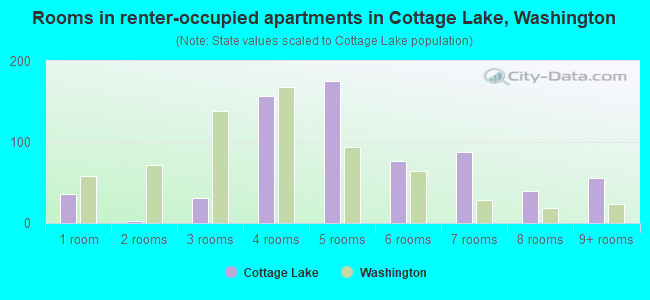
- Rooms in renter-occupied apartments in Cottage Lake, Washington
- 361 room
- 32 rooms
- 313 rooms
- 1574 rooms
- 1755 rooms
- 776 rooms
- 887 rooms
- 398 rooms
- 569+ rooms
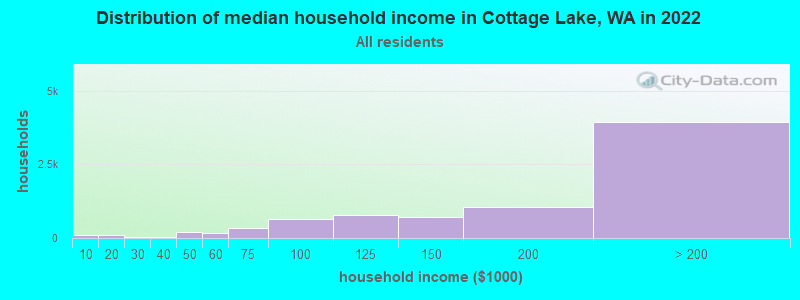
Cottage Lake, WA household income distribution

- 87Less than $10,000
- 99$10,000 to $19,999
- 45$20,000 to $29,999
- 44$30,000 to $39,999
- 200$40,000 to $49,999
- 176$50,000 to $59,999
- 327$60,000 to $74,999
- 649$75,000 to $99,999
- 772$100,000 to $124,999
- 722$125,000 to $149,999
- 1,056$150,000 to $199,999
- 3,945$200,000 or more
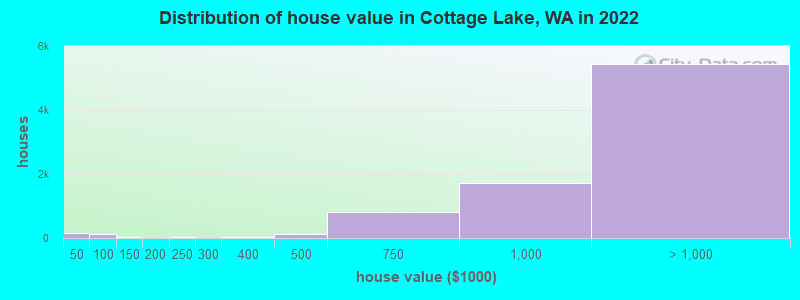
Home value of owner - occupied houses in 2022 in Cottage Lake, WA
-
- 146Less than $10,000
- 4$20,000 to $24,999
- 19$50,000 to $59,999
- 86$80,000 to $89,999
- 13$90,000 to $99,999
- 41$100,000 to $124,999
- 18$200,000 to $249,999
- 24$300,000 to $399,999
- 110$400,000 to $499,999
- 821$500,000 to $749,999
- 1,734$750,000 to $999,999
- 2,864$1,000,000 to $1,499,999
- 1,413$1,500,000 to $1,999,999
- 1,166$2,000,000 or more
Rent paid by renters in 2022 in Cottage Lake, WA
-
- 31$500 to $549
- 2$650 to $699
- 27$800 to $899
- 5$900 to $999
- 72$1,000 to $1,249
- 46$1,250 to $1,499
- 140$1,500 to $1,999
- 149$2,000 to $2,499
- 47$2,500 to $2,999
- 50$3,000 to $3,499
- 41$3,500 or more
- 66No cash rent
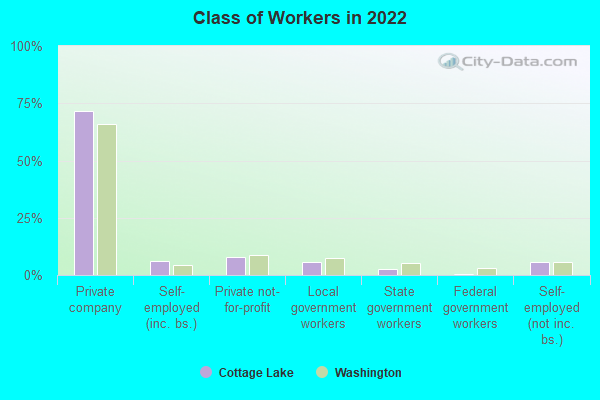
Percentage of workers working in this county: 92.0%
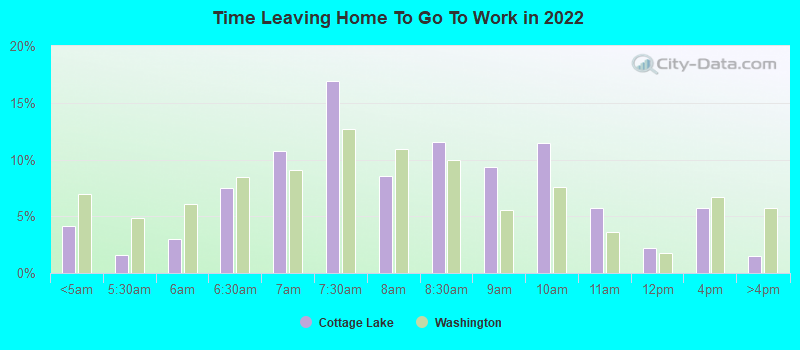
Number of people working at home: 3,597 (33.4% of all workers)
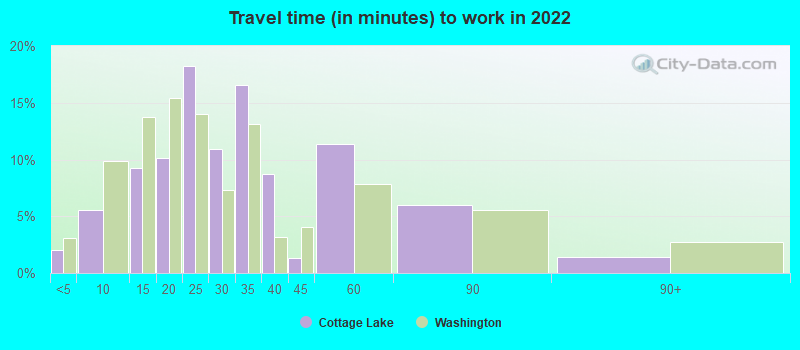
Travel time to work (commute)
- Less than 5 minutes: 27
- 5 to 9 minutes: 277
- 10 to 14 minutes: 671
- 15 to 19 minutes: 1,037
- 20 to 24 minutes: 1,461
- 25 to 29 minutes: 762
- 30 to 34 minutes: 1,362
- 35 to 39 minutes: 334
- 40 to 44 minutes: 269
- 45 to 59 minutes: 613
- 60 to 89 minutes: 388
- 90 or more minutes: 67
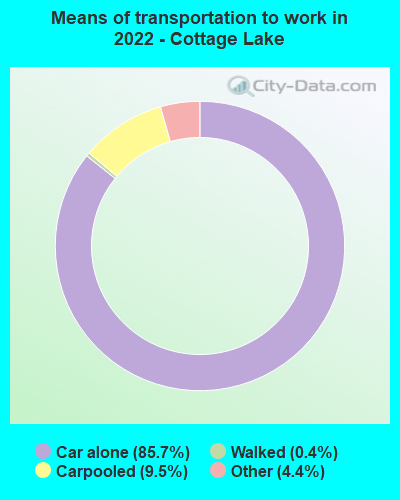
Means of transportation to work:
- Drove a car alone: 1,764 (36.9%)
- Carpooled: 187 (3.9%)
- Taxi: 82 (1.7%)
- Walked: 7 (0.1%)
- Worked at home: 3,597 (75.2%)
- Unemployment by race in 2022
- Unemployment rate for White non-Hispanic residents
- 2.2%Males
- 3.8%Females
- Unemployment rate for Black residents
- 41.7%Females
- Unemployment rate for Asian residents
- 2.9%Males
- 1.5%Females
- Unemployment rate for other race residents
- 4.6%Females
- Unemployment rate for two or more race residents
- 5.3%Males
- 1.4%Females
- Unemployment rate for Hispanic or Latino residents
- 1.3%Females
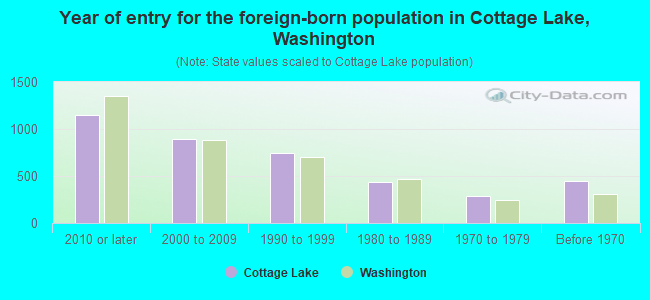
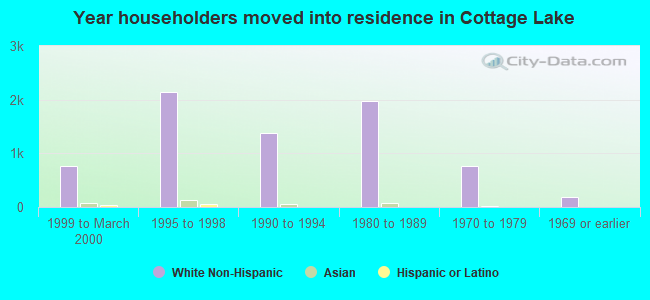
- Year of entry for the foreign-born population in Cottage Lake, Washington
- 1,1532010 or later
- 8902000 to 2009
- 7481990 to 1999
- 4401980 to 1989
- 2841970 to 1979
- 447Before 1970
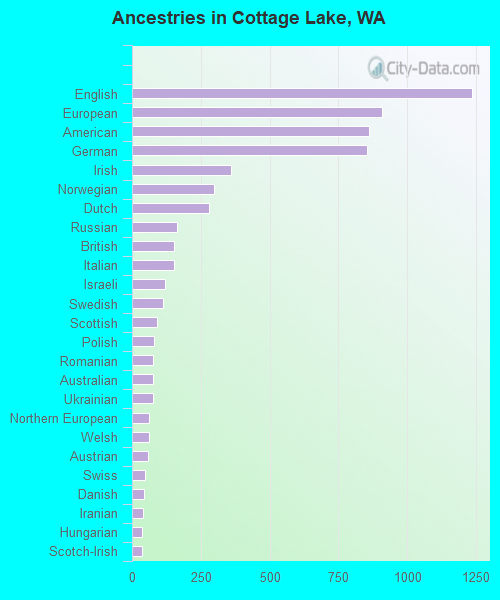
First ancestries reported:
- English: 1,235 (12.1%)
- European: 909 (8.9%)
- American: 862 (8.4%)
- German: 852 (8.3%)
- Irish: 359 (3.5%)
- Norwegian: 297 (2.9%)
- Dutch: 279 (2.7%)
- Russian: 162 (1.6%)
- British: 153 (1.5%)
- Italian: 153 (1.5%)
- Israeli: 120 (1.2%)
- Swedish: 114 (1.1%)
- Scottish: 91 (0.9%)
- Polish: 80 (0.8%)
- Romanian: 77 (0.8%)
- Australian: 75 (0.7%)
- Ukrainian: 75 (0.7%)
- Northern European: 60 (0.6%)
- Welsh: 60 (0.6%)
- Austrian: 58 (0.6%)
- Swiss: 49 (0.5%)
- Danish: 43 (0.4%)
- Iranian: 39 (0.4%)
- Hungarian: 38 (0.4%)
- Scotch-Irish: 38 (0.4%)
- Canadian: 28 (0.3%)
- Portuguese: 28 (0.3%)
- French: 24 (0.2%)
- Scandinavian: 22 (0.2%)
- Serbian: 21 (0.2%)
- French Canadian: 19 (0.2%)
- Afghan: 19 (0.2%)
- Turkish: 18 (0.2%)
- Yugoslavian: 18 (0.2%)
- Lebanese: 14 (0.1%)
- Slovak: 13 (0.1%)
- Czech: 13 (0.1%)
- Finnish: 6 (0.06%)
- Eastern European: 5 (0.05%)
Most common places of birth for foreign-born residents (%):
| Cottage Lake: | 18.5% (676) |
| Washington: | 7.4% (84,470) |
| Cottage Lake: | 12.9% (473) |
| Washington: | 21.1% (241,655) |
| Cottage Lake: | 10.0% (366) |
| Washington: | 4.1% (47,238) |
| Cottage Lake: | 9.5% (347) |
| Washington: | 8.9% (101,353) |
| Cottage Lake: | 4.5% (165) |
| Washington: | 4.3% (48,886) |
| Cottage Lake: | 3.8% (138) |
| Washington: | 1.9% (21,540) |
| Cottage Lake: | 3.4% (126) |
| Washington: | 1.0% (10,943) |
| Cottage Lake: | 2.4% (89) |
| Washington: | 0.2% (2,551) |
| Cottage Lake: | 2.3% (86) |
| Washington: | 0.2% (2,506) |
| Cottage Lake: | 2.2% (81) |
| Washington: | 1.5% (16,607) |
| Cottage Lake: | 1.9% (70) |
| Washington: | 0.6% (6,294) |
| Cottage Lake: | 1.9% (69) |
| Washington: | 0.4% (4,499) |
| Cottage Lake: | 1.7% (61) |
| Washington: | 1.5% (17,453) |
| Cottage Lake: | 1.6% (59) |
| Washington: | 0.8% (9,457) |
Place of birth for U.S.-born residents:
- This state: 10,156
- Other state: 8,852
- Northeast: 1,277
- Midwest: 2,248
- South: 1,133
- West: 4,207
94.3% of Cottage Lake residents lived in the same house 1 years ago.
Out of people who lived in different houses, 43.2% lived in this county.
Out of people who lived in different counties, 53.9% lived in Washington.
| Cottage Lake: | 94.3% |
| State average: | 85.2% |
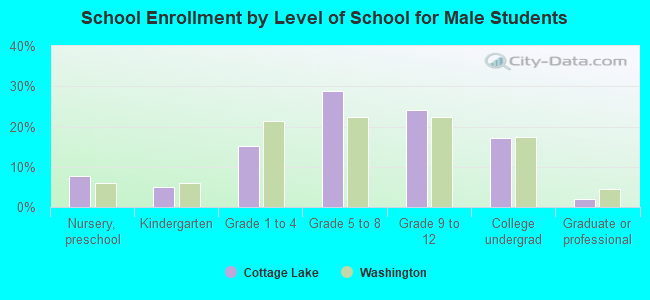
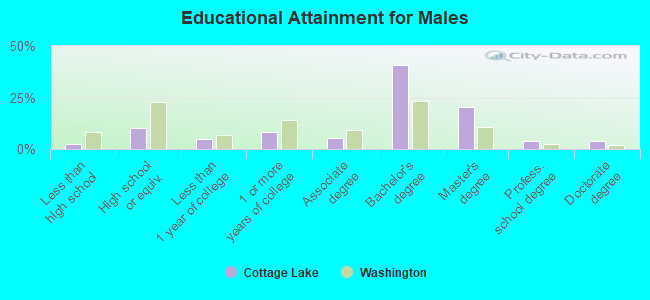
Education attainment for males 25 years and older:
- No schooling: 0
- Nursery to 4th grade: 0
- 5th and 6th grade: 43
- 7th and 8th grade: 58
- 9th grade: 29
- 10th grade: 8
- 11th grade: 0
- 12th grade, no diploma: 76
- High school graduate (or equivalency): 855
- Less than 1 year of college: 411
- Some college more than 1 year, no degree: 720
- Associate degree: 452
- Bachelor's degree: 3,510
- Master's degree: 1,740
- Professional school degree: 326
- Doctorate degree: 345
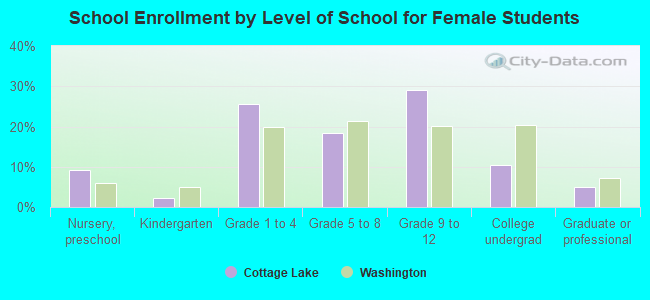
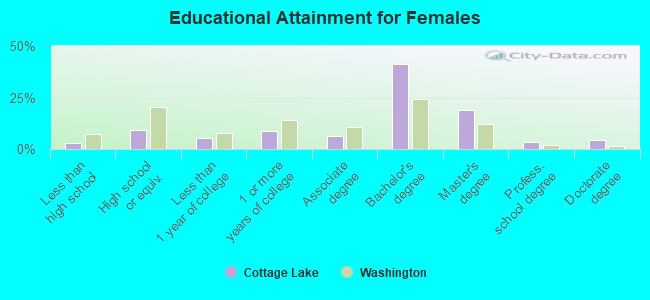
Education attainment for females 25 years and older:
- No schooling: 55
- Nursery to 4th grade: 0
- 5th and 6th grade: 71
- 7th and 8th grade: 0
- 9th grade: 17
- 10th grade: 30
- 11th grade: 0
- 12th grade, no diploma: 61
- High school graduate (or equivalency): 774
- Less than 1 year of college: 444
- Some college more than 1 year, no degree: 709
- Associate degree: 508
- Bachelor's degree: 3,375
- Master's degree: 1,560
- Professional school degree: 282
- Doctorate degree: 341


Housing units in structures:
- One, detached: 8,043
- One, attached: 124
- Two: 10
- 20 to 49: 3
- Mobile homes: 89
- Boats, RVs, vans, etc.: 9
Housing units lacking complete kitchen facilities in 2022: 0.3%
House/condo owner moved in on average 16 years ago
Renter moved in on average 6 years ago
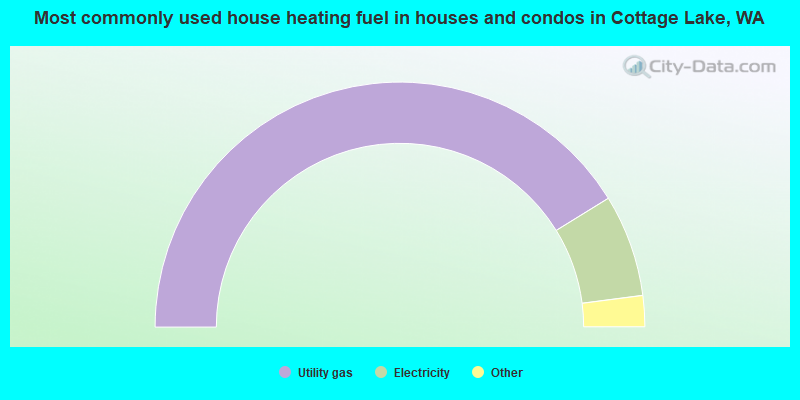
- 82.3%Utility gas
- 13.5%Electricity
- 2.1%Bottled, tank, or LP gas
- 1.0%Other fuel
- 0.6%Wood
- 0.4%Fuel oil, kerosene, etc.
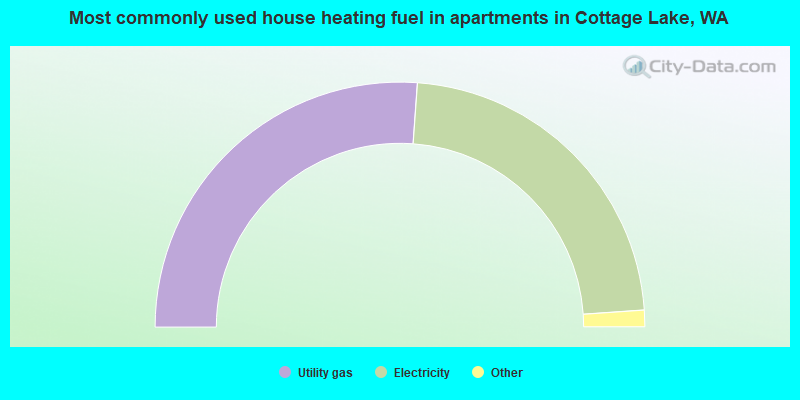
- 52.3%Utility gas
- 45.5%Electricity
- 1.1%Bottled, tank, or LP gas
- 1.1%Wood
Private vs. public school enrollment:
| Here: | 19.6% |
| Washington: | 12.4% |
| Here: | 8.5% |
| Washington: | 9.2% |
| Here: | 17.4% |
| Washington: | 16.5% |