Crestwood, MO (Missouri) Houses and Residents
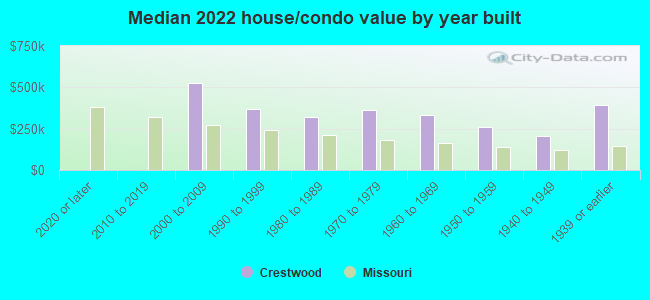
| Crestwood: | $287,614 |
| Missouri: | $221,200 |
Total population: 11,951 (Urban population: 11,720, Rural population: 0)
Houses: 4,990 (4,838 occupied: 4,221 owner occupied, 606 renter occupied)
| % of renters here: | 13% |
| State: | 32% |
Housing density: 1,386 houses/condos per square mile
Median price asked for vacant for-sale houses and condos in 2022: $135,287.
Median contract rent in 2022: $917 (lower quartile is $749, upper quartile is $1,098)
Median rent asked for vacant for-rent units in 2022: $907
Median gross rent in Crestwood, MO in 2022: $1,033
Housing units in Crestwood with a mortgage: 2,504 (215 second mortgage, 0 home equity loan, 212 both second mortgage and home equity loan)
Houses without a mortgage: 105
Median household income for houses/condos with a mortgage: $125,567
Median household income for apartments without a mortgage: $97,647
Median monthly housing costs: $1,183
Compare current foreclosures near Crestwood, MO:
| Photo | Address | Area | Beds / Baths | Price | Details |
|---|---|---|---|---|---|

|
#1
Lothian Cir
Saint Louis, MO 63137
|
1,044 sq. feet
|
1 baths 2 beds |
$99,900
|
show details |

|
#2
Concord Pl
Saint Louis, MO 63147
|
768 sq. feet
|
1 baths 2 beds |
$59,900
|
show details |

|
#3
Idaho Ave
Saint Louis, MO 63111
|
979 sq. feet
|
1 baths 2 beds |
$129,900
|
show details |

|
#4
Bagley Dr
Saint Louis, MO 63136
|
982 sq. feet
|
1 baths 2 beds |
$119,900
|
show details |

|
#5
Ross Ave
Saint Louis, MO 63146
|
1,520 sq. feet
|
2 baths 3 beds |
$218,400
|
show details |

|
#6
E Milton Ave
Saint Louis, MO 63114
|
1,325 sq. feet
|
1 baths 2 beds |
$184,900
|
show details |

|
#7
Louisiana Ave
Saint Louis, MO 63118
|
2,360 sq. feet
|
2 baths 2 beds |
$187,000
|
show details |

|
#8
Connor Rd
House Springs, MO 63051
|
1,076 sq. feet
|
2 baths 3 beds |
$224,900
|
show details |

|
#9
Old State Route 21
Imperial, MO 63052
|
1,763 sq. feet
|
2 baths 3 beds |
$144,900
|
show details |

|
#10
Hodiamont Ave # E4
Saint Louis, MO 63112
|
1 sq. feet
|
2 baths 2 beds |
$167,000
|
show details |
| Photo | Address | Area | Beds / Baths | Price | Details |
|---|---|---|---|---|---|

|
#11
Saint Charles St Apt 801
Saint Louis, MO 63101
|
1,688 sq. feet
|
2 baths 1 beds |
$154,900
|
show details |

|
#12
Jerries Ln
Saint Louis, MO 63136
|
1,380 sq. feet
|
1 baths 3 beds |
$219,900
|
show details |

|
#13
Ridge Ave
Saint Louis, MO 63113
|
1,868 sq. feet
|
2 baths 6 beds |
$114,900
|
show details |

|
#14
Deer St
Saint Louis, MO 63113
|
1,646 sq. feet
|
1 baths 3 beds |
$250,000
|
show details |

|
#15
N New Florissant Roa
Florissant, MO 63031
|
840 sq. feet
|
1 baths 2 beds |
$167,000
|
show details |

|
#16
Hannover Ave
Saint Louis, MO 63123
|
912 sq. feet
|
1 baths 2 beds |
$159,900
|
show details |

|
#17
Mallet Hl
Ballwin, MO 63021
|
4,530 sq. feet
|
4 baths 5 beds |
$649,900
|
show details |

|
#18
Rosewood Ave
Saint Louis, MO 63120
|
1,152 sq. feet
|
1 baths 2 beds |
$125,000
|
show details |

|
#19
Sims Ave
Saint Louis, MO 63114
|
1,278 sq. feet
|
1 baths 3 beds |
$195,000
|
show details |

|
#20
Cunniff Pl
Saint Louis, MO 63135
|
1,596 sq. feet
|
1 baths 3 beds |
$84,900
|
show details |
| Photo | Address | Area | Beds / Baths | Price | Details |
|---|---|---|---|---|---|

|
#21
Washington Ave
Saint Louis, MO 63101
|
- sq. feet
|
2 baths 2 beds |
$229,900
|
show details |

|
#22
Hamilton Ave
Saint Louis, MO 63136
|
832 sq. feet
|
1 baths 2 beds |
$17,900
|
show details |

|
#23
Oregon Ave
Saint Louis, MO 63118
|
1,782 sq. feet
|
2 baths - beds |
$12,000
|
show details |

|
#24
Paris Ave
Saint Louis, MO 63115
|
1,650 sq. feet
|
1 baths - beds |
$24,900
|
show details |

|
#25
S Spring Ave
Saint Louis, MO 63116
|
1,592 sq. feet
|
1 baths 3 beds |
show details | |

|
#26
Northland Pl
Saint Louis, MO 63113
|
1,736 sq. feet
|
1 baths - beds |
$23,900
|
show details |

|
#27
Grover St
Saint Louis, MO 63112
|
792 sq. feet
|
1 baths - beds |
$12,000
|
show details |

|
#28
Summit Pl
Saint Louis, MO 63136
|
1,039 sq. feet
|
1 baths - beds |
$15,900
|
show details |

|
#29
Woodland Point Dr Apt I
Saint Louis, MO 63146
|
1,050 sq. feet
|
2 baths 2 beds |
show details | |

|
#30
Hollis Dr
Saint Louis, MO 63136
|
1,054 sq. feet
|
2 baths 3 beds |
show details |
| Photo | Address | Area | Beds / Baths | Price | Details |
|---|---|---|---|---|---|

|
#31
Page Ave
Saint Louis, MO 63133
|
860 sq. feet
|
1 baths 2 beds |
show details | |

|
#32
N 72nd St
East Saint Louis, IL 62203
|
720 sq. feet
|
1 baths 2 beds |
show details | |

|
#33
Edwards St
Granite City, IL 62040
|
1,202 sq. feet
|
1 baths 3 beds |
show details | |

|
#34
Wyoming St
Saint Louis, MO 63118
|
4,440 sq. feet
|
4 baths 4 beds |
show details | |

|
#35
Winona Ave
Saint Louis, MO 63109
|
936 sq. feet
|
1 baths 3 beds |
show details | |

|
#36
Virginia Ave
Saint Louis, MO 63111
|
2,220 sq. feet
|
2 baths 3 beds |
show details | |

|
#37
Spring Ave
Saint Ann, MO 63074
|
888 sq. feet
|
1 baths 3 beds |
show details | |

|
#38
Oleatha Ave
Saint Louis, MO 63139
|
1,548 sq. feet
|
2 baths 4 beds |
show details | |

|
#39
Enright Ave
Saint Louis, MO 63108
|
2,122 sq. feet
|
2 baths 3 beds |
show details | |

|
#40
Ashby Rd
Saint Louis, MO 63114
|
972 sq. feet
|
1 baths 2 beds |
show details |
| Photo | Address | Area | Beds / Baths | Price | Details |
|---|---|---|---|---|---|

|
#41
Decatur Dr
Saint Louis, MO 63123
|
792 sq. feet
|
2 baths 2 beds |
show details | |

|
#42
Bethesda Dr
Belleville, IL 62223
|
840 sq. feet
|
1 baths 2 beds |
show details | |

|
#43
Bellefontaine Rd
Saint Louis, MO 63137
|
1,152 sq. feet
|
1 baths 2 beds |
show details | |

|
#44
Bates St
Saint Louis, MO 63111
|
1,076 sq. feet
|
1 baths 3 beds |
show details | |

|
#45
Spoon Dr
Saint Louis, MO 63132
|
1,152 sq. feet
|
1 baths 3 beds |
show details | |

|
#46
Switzer Ave
Saint Louis, MO 63147
|
1,610 sq. feet
|
1 baths 3 beds |
show details | |

|
#47
Butler Dr
Eureka, MO 63025
|
966 sq. feet
|
1 baths 3 beds |
show details | |

|
#48
Lisette Ave
Saint Louis, MO 63109
|
1,932 sq. feet
|
1 baths 4 beds |
show details | |

|
#49
Cooper Dr
East Saint Louis, IL 62206
|
1,192 sq. feet
|
2 baths 4 beds |
show details | |

|
Check over 1 million property listings on Foreclosure.com!
|
browse all offers | |||

Latest news about housing in Crestwood, MO collected exclusively by city-data.com from local newspapers, TV, and radio stations

 | Long ago on independence square (13162 replies) |
| Interesting Mid-Century Modern Homes/Neighborhoods (2 replies) |
| Things You Remember About St. Louis (229 replies) |
| Luxury Apartments (empty nesters) (7 replies) |
| Overwhelmed House Shopper (12 replies) |
| Young family looking to rent single family home in S. City/near county (3 replies) |

Median year apartment built: 1972
Household type by relationship:
Households: 12,200- Male householders: 2,491 (294 living alone), Female householders: 2,290 (705 living alone)
3,019 spouses (3,008 opposite-sex spouses), 234 unmarried partners, (234 opposite-sex unmarried partners), 3,452 children (3,297 natural, 95 adopted, 60 stepchildren), 165 grandchildren, 51 brothers or sisters, 42 parents, 12 foster children, 159 other relatives, 264 non-relatives
- In group quarters: 14
Size of family households: 1,753 2-persons, 818 3-persons, 598 4-persons, 398 5-persons, 73 6-persons, 8 7-or-more-persons.
Size of nonfamily households: 988 1-person, 173 2-persons, 9 3-persons.
2,240 married couples with children.
223 single-parent households (39 men, 184 women).
94.9% of residents of Crestwood speak English at home.
2.3% of residents speak Spanish at home (63% speak English very well, 37% speak English not well).
1.7% of residents speak other Indo-European language at home (76% speak English very well, 17% speak English well, 8% speak English not well).
0.6% of residents speak Asian or Pacific Island language at home (77% speak English very well, 13% speak English well, 10% speak English not well).
0.4% of residents speak other language at home (62% speak English very well, 38% speak English not well).
Foreign born population: 418 (3.4%)
(72.5% of them are naturalized citizens)
| Here: | 6.8 |
| State: | 6.4 |
| Here: | 4.1 |
| State: | 4.4 |
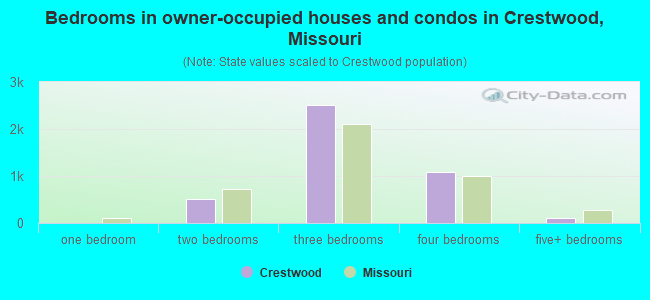
- Bedrooms in owner-occupied houses and condos in Crestwood, Missouri
- 0no bedroom
- 101 bedroom
- 5052 bedrooms
- 2,5173 bedrooms
- 1,0824 bedrooms
- 1075+ bedrooms
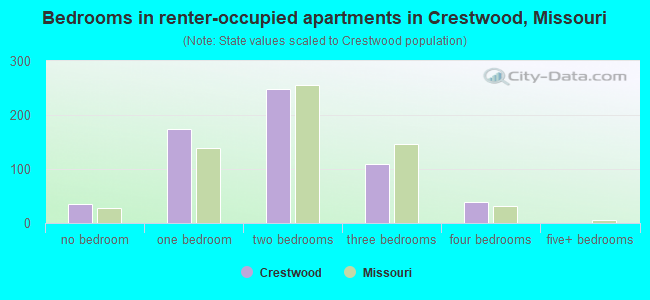
- Bedrooms in renter-occupied apartments in Crestwood, Missouri
- 35no bedroom
- 1751 bedroom
- 2482 bedrooms
- 1093 bedrooms
- 394 bedrooms
- 05+ bedrooms
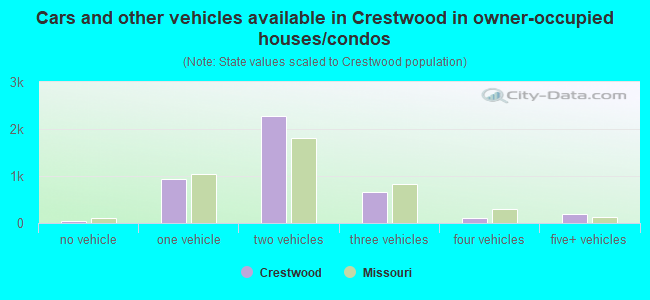
- Cars and other vehicles available in Crestwood in owner-occupied houses/condos
- 38no vehicle
- 9381 vehicle
- 2,2722 vehicles
- 6573 vehicles
- 1174 vehicles
- 1995+ vehicles
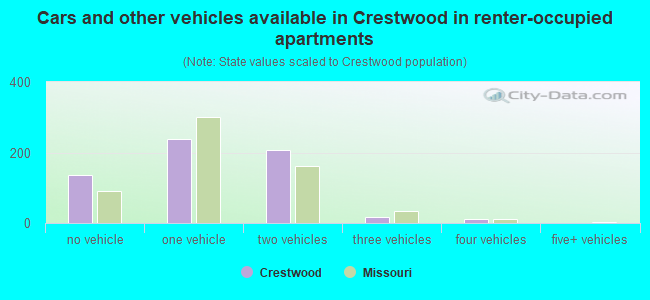
- Cars and other vehicles available in Crestwood in renter-occupied apartments
- 135no vehicle
- 2371 vehicle
- 2062 vehicles
- 173 vehicles
- 114 vehicles
- 05+ vehicles
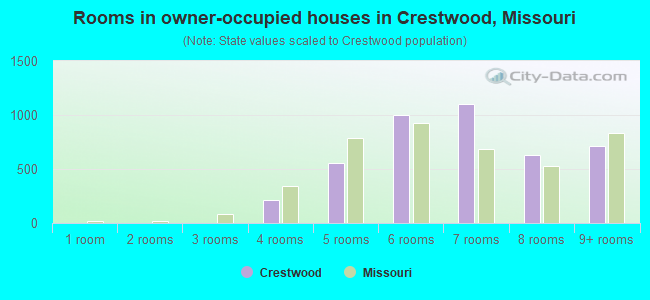
- Rooms in owner-occupied houses in Crestwood, Missouri
- 01 room
- 02 rooms
- 03 rooms
- 2114 rooms
- 5605 rooms
- 9996 rooms
- 1,1047 rooms
- 6318 rooms
- 7169+ rooms
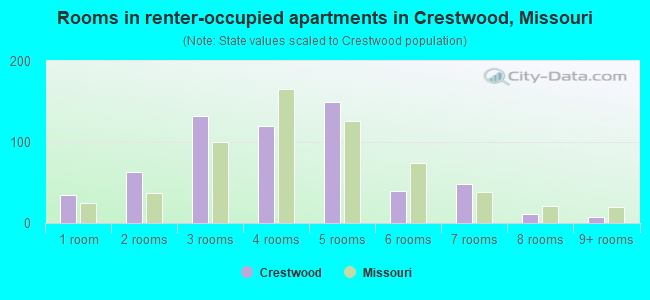
- Rooms in renter-occupied apartments in Crestwood, Missouri
- 351 room
- 632 rooms
- 1323 rooms
- 1204 rooms
- 1495 rooms
- 406 rooms
- 487 rooms
- 118 rooms
- 89+ rooms
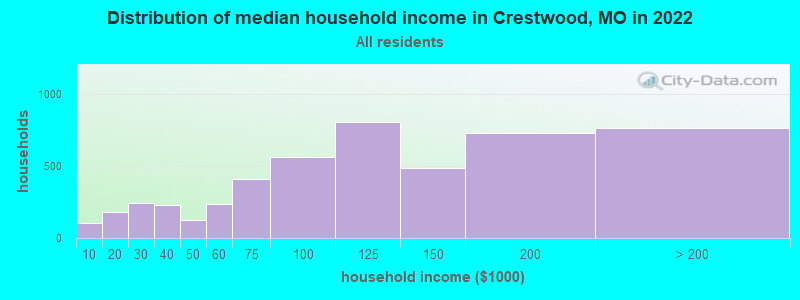
Crestwood, MO household income distribution

- 102Less than $10,000
- 183$10,000 to $19,999
- 245$20,000 to $29,999
- 225$30,000 to $39,999
- 126$40,000 to $49,999
- 235$50,000 to $59,999
- 408$60,000 to $74,999
- 558$75,000 to $99,999
- 803$100,000 to $124,999
- 488$125,000 to $149,999
- 724$150,000 to $199,999
- 759$200,000 or more
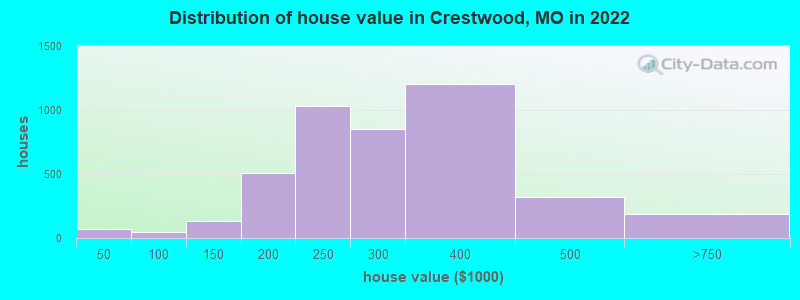
Home value of owner - occupied houses in 2022 in Crestwood, MO
-
- 24Less than $10,000
- 37$20,000 to $24,999
- 6$25,000 to $29,999
- 6$50,000 to $59,999
- 9$70,000 to $79,999
- 28$90,000 to $99,999
- 42$100,000 to $124,999
- 90$125,000 to $149,999
- 274$150,000 to $174,999
- 233$175,000 to $199,999
- 1,033$200,000 to $249,999
- 847$250,000 to $299,999
- 1,201$300,000 to $399,999
- 317$400,000 to $499,999
- 187$500,000 to $749,999
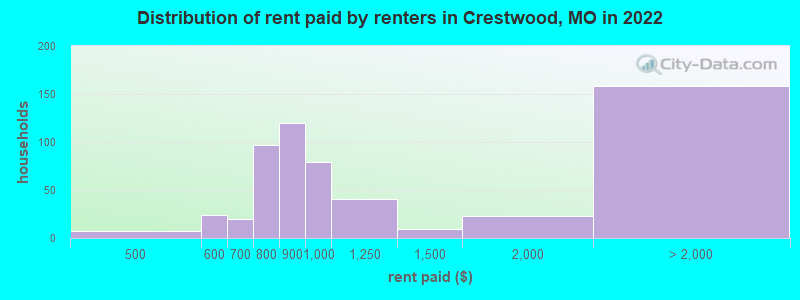
Rent paid by renters in 2022 in Crestwood, MO
-
- 6$450 to $499
- 24$500 to $549
- 20$650 to $699
- 97$700 to $749
- 119$800 to $899
- 79$900 to $999
- 41$1,000 to $1,249
- 8$1,250 to $1,499
- 23$1,500 to $1,999
- 16$2,000 to $2,499
- 15$2,500 to $2,999
- 46$3,000 to $3,499
- 79No cash rent
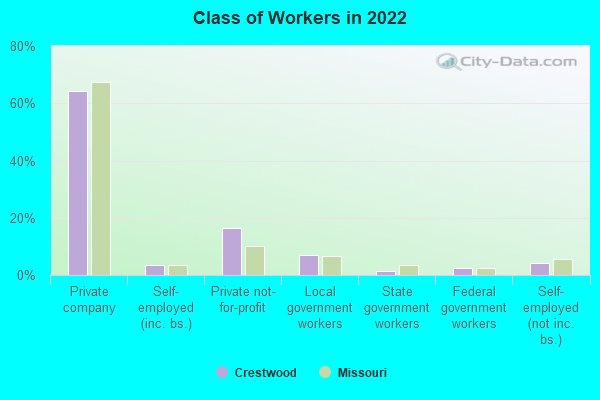
Percentage of workers working in this county: 70.9%
Number of people working at home: 1,398 (21.7% of all workers)
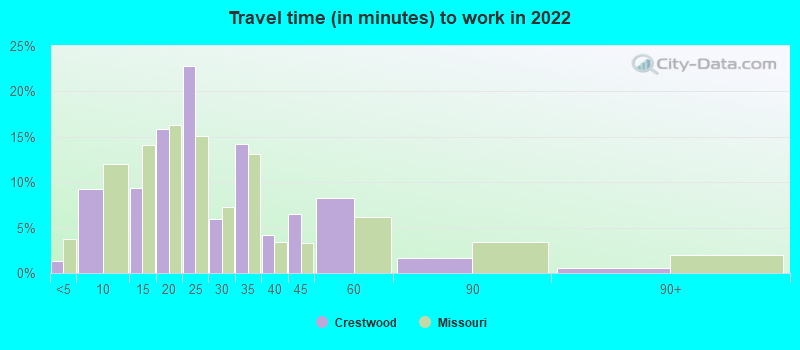
Travel time to work (commute)
- Less than 5 minutes: 87
- 5 to 9 minutes: 416
- 10 to 14 minutes: 624
- 15 to 19 minutes: 1,006
- 20 to 24 minutes: 1,183
- 25 to 29 minutes: 412
- 30 to 34 minutes: 858
- 35 to 39 minutes: 117
- 40 to 44 minutes: 68
- 45 to 59 minutes: 202
- 60 to 89 minutes: 12
- 90 or more minutes: 121
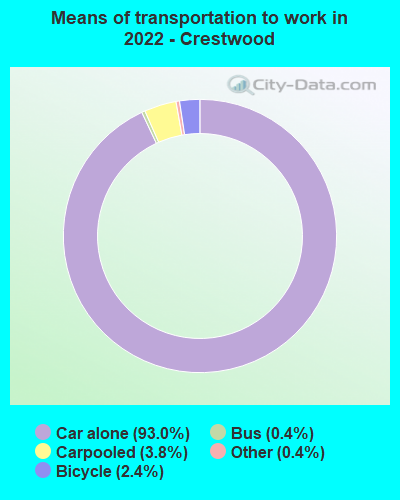
Means of transportation to work:
- Drove a car alone: 3,425 (70.0%)
- Carpooled: 134 (2.7%)
- Bus: 12 (0.2%)
- Taxi: 14 (0.3%)
- Bicycle: 106 (2.2%)
- Worked at home: 1,398 (28.6%)
- Unemployment by race in 2022
- Unemployment rate for White non-Hispanic residents
- 1.2%Males
- 1.0%Females
- Unemployment rate for Black residents
- 11.5%Males
- 6.5%Females
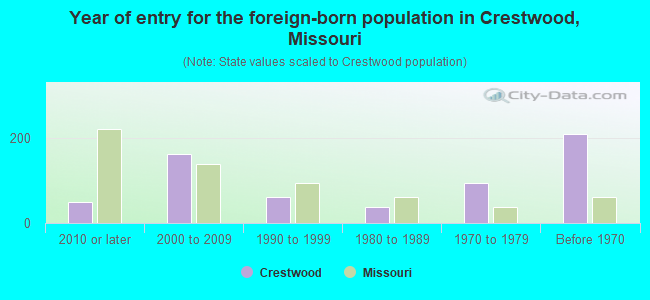
- Year of entry for the foreign-born population in Crestwood, Missouri
- 502010 or later
- 1632000 to 2009
- 621990 to 1999
- 371980 to 1989
- 931970 to 1979
- 209Before 1970
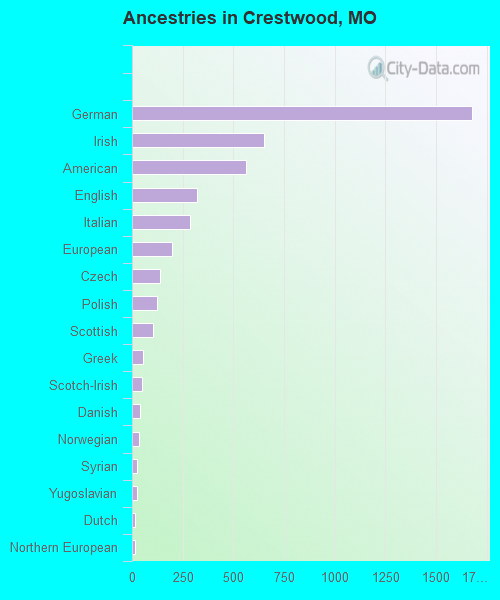
First ancestries reported:
- German: 1,678 (31.9%)
- Irish: 653 (12.4%)
- American: 563 (10.7%)
- English: 319 (6.1%)
- Italian: 285 (5.4%)
- European: 195 (3.7%)
- Czech: 140 (2.7%)
- Polish: 121 (2.3%)
- Scottish: 103 (2.0%)
- Greek: 54 (1.0%)
- Scotch-Irish: 47 (0.9%)
- Danish: 41 (0.8%)
- Norwegian: 36 (0.7%)
- Syrian: 25 (0.5%)
- Yugoslavian: 25 (0.5%)
- Dutch: 17 (0.3%)
- Northern European: 17 (0.3%)
- British: 14 (0.3%)
- French: 14 (0.3%)
- Swedish: 13 (0.2%)
- Czechoslovakian: 10 (0.2%)
- Welsh: 10 (0.2%)
- Ukrainian: 9 (0.2%)
- Armenian: 6 (0.1%)
- Eastern European: 5 (0.09%)
- African: 4 (0.08%)
Most common places of birth for foreign-born residents (%):
| Crestwood: | 21.8% (90) |
| Missouri: | 14.9% (38,568) |
| Crestwood: | 12.4% (51) |
| Missouri: | 0.7% (1,681) |
| Crestwood: | 10.2% (42) |
| Missouri: | 4.2% (10,873) |
| Crestwood: | 10.2% (42) |
| Missouri: | 0.5% (1,214) |
| Crestwood: | 8.7% (36) |
| Missouri: | 0.6% (1,478) |
| Crestwood: | 7.5% (31) |
| Missouri: | 3.2% (8,168) |
| Crestwood: | 5.1% (21) |
| Missouri: | 0.4% (1,155) |
| Crestwood: | 3.2% (13) |
| Missouri: | 8.9% (22,932) |
| Crestwood: | 2.7% (11) |
| Missouri: | 1.1% (2,796) |
| Crestwood: | 2.7% (11) |
| Missouri: | 0.4% (1,043) |
| Crestwood: | 2.4% (10) |
| Missouri: | 0.1% (148) |
| Crestwood: | 2.4% (10) |
| Missouri: | 6.6% (17,002) |
| Crestwood: | 1.9% (8) |
| Missouri: | 1.9% (4,806) |
Place of birth for U.S.-born residents:
- This state: 8,934
- Other state: 2,783
- Northeast: 334
- Midwest: 1,570
- South: 473
- West: 393
91.3% of Crestwood residents lived in the same house 1 years ago.
Out of people who lived in different houses, 30.4% lived in this county.
Out of people who lived in different counties, 54.1% lived in Missouri.
| Crestwood: | 91.3% |
| State average: | 87.1% |
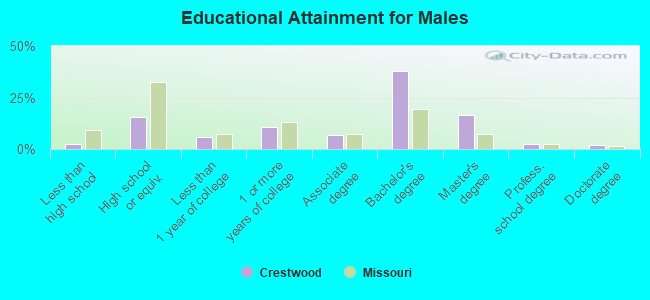
Education attainment for males 25 years and older:
- No schooling: 21
- Nursery to 4th grade: 0
- 5th and 6th grade: 0
- 7th and 8th grade: 13
- 9th grade: 0
- 10th grade: 26
- 11th grade: 0
- 12th grade, no diploma: 42
- High school graduate (or equivalency): 690
- Less than 1 year of college: 255
- Some college more than 1 year, no degree: 476
- Associate degree: 299
- Bachelor's degree: 1,696
- Master's degree: 736
- Professional school degree: 107
- Doctorate degree: 97
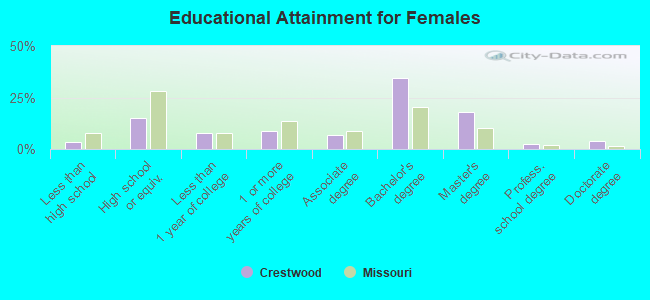
Education attainment for females 25 years and older:
- No schooling: 3
- Nursery to 4th grade: 12
- 5th and 6th grade: 7
- 7th and 8th grade: 8
- 9th grade: 0
- 10th grade: 52
- 11th grade: 36
- 12th grade, no diploma: 42
- High school graduate (or equivalency): 721
- Less than 1 year of college: 364
- Some college more than 1 year, no degree: 432
- Associate degree: 339
- Bachelor's degree: 1,664
- Master's degree: 858
- Professional school degree: 114
- Doctorate degree: 179


Housing units in structures:
- One, detached: 4,462
- One, attached: 35
- Two: 50
- 3 or 4: 63
- 5 to 9: 16
- 10 to 19: 159
- 20 to 49: 29
- 50 or more: 175
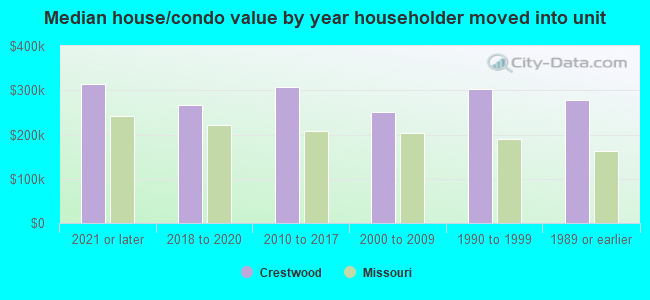
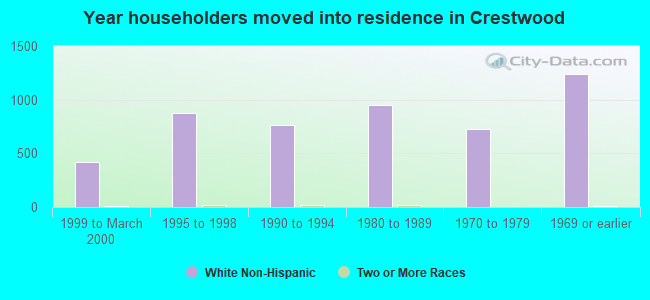
House/condo owner moved in on average 14 years ago
Renter moved in on average 4 years ago
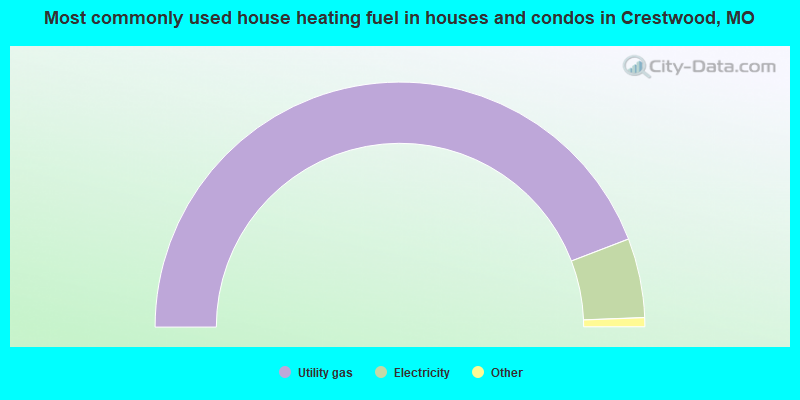
- 88.4%Utility gas
- 10.5%Electricity
- 0.9%Bottled, tank, or LP gas
- 0.2%Fuel oil, kerosene, etc.
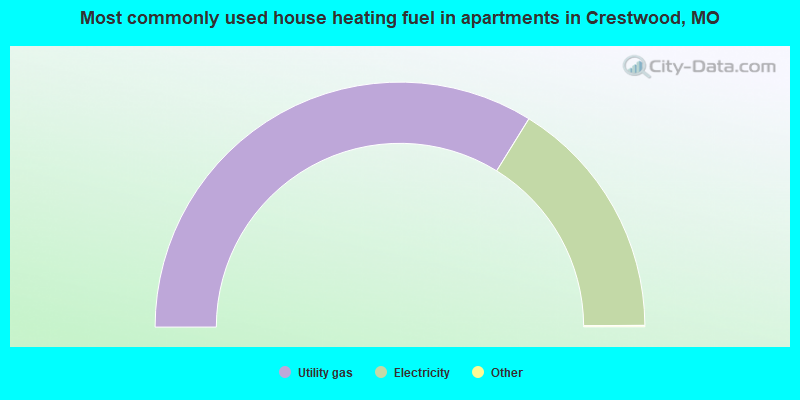
- 67.8%Utility gas
- 32.2%Electricity
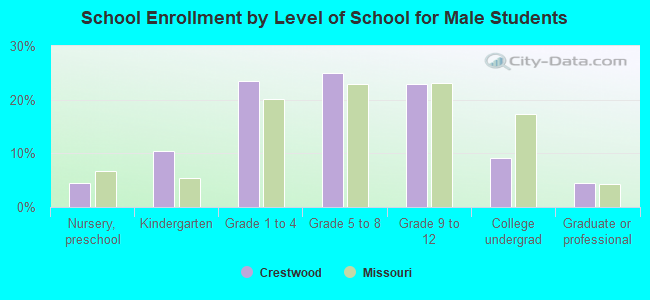
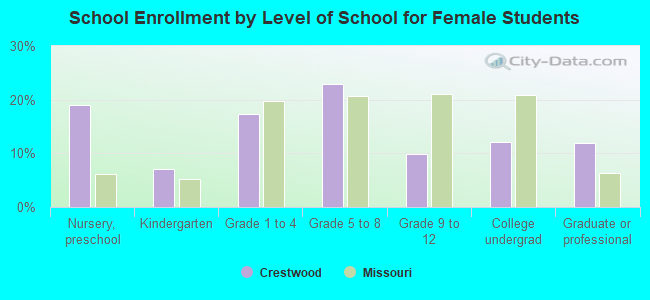
Private vs. public school enrollment:
| Here: | 26.2% |
| Missouri: | 15.4% |
| Here: | 26.2% |
| Missouri: | 13.9% |
| Here: | 27.2% |
| Missouri: | 22.6% |