Davenport, IA (Iowa) Houses and Residents
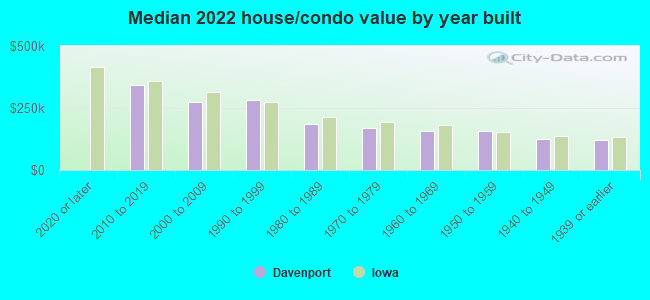
| Davenport: | $161,800 |
| Iowa: | $194,600 |
Mean price in 2022:
Detached houses: $202,600
Here: $202,600 State: $245,224 Townhouses or other attached units: $312,195
Here: $312,195 State: $238,767 In 2-unit structures: $186,942
Here: $186,942 State: $243,070 In 3-to-4-unit structures: $69,780
Here: $69,780 State: $162,139 In 5-or-more-unit structures: $120,036
Here: $120,036 State: $190,519 Mobile homes: $21,078
Here: $21,078 State: $51,271
Total population: 102,448 (Urban population: 96,125, Rural population: 2,232 (53 farm, 2,179 nonfarm))
Houses: 48,386 (44,709 occupied: 28,005 owner occupied, 16,704 renter occupied)
| % of renters here: | 37% |
| State: | 28% |
Housing density: 771 houses/condos per square mile
Median price asked for vacant for-sale houses and condos in 2022: $150,683.
Median contract rent in 2022: $782 (lower quartile is $618, upper quartile is $962)
Median rent asked for vacant for-rent units in 2022: $875
Median gross rent in Davenport, IA in 2022: $904
Housing units in Davenport with a mortgage: 17,972 (1,452 second mortgage, 90 home equity loan, 1,130 both second mortgage and home equity loan)
Houses without a mortgage: 424
Median household income for houses/condos with a mortgage: $82,787
Median household income for apartments without a mortgage: $56,957
Median monthly housing costs: $952
Compare current foreclosures in Davenport, IA:
| Photo | Address | Area | Beds / Baths | Price | Details |
|---|---|---|---|---|---|

|
#1
N Lincoln Ave
Davenport, IA 52804
|
952 sq. feet
|
1 baths 2 beds |
$179,900
|
show details |

|
#2
W 16th St
Davenport, IA 52804
|
- sq. feet
|
1 baths 3 beds |
$53,550
|
show details |

|
#3
Waverly Rd
Davenport, IA 52804
|
1,194 sq. feet
|
1 baths 2 beds |
show details | |

|
#4
Rockingham Rd
Davenport, IA 52802
|
1,666 sq. feet
|
2 baths 3 beds |
show details | |

|
#5
N Elsie Ave
Davenport, IA 52806
|
916 sq. feet
|
2 baths 4 beds |
show details | |

|
#6
Grove St
Davenport, IA 52804
|
- sq. feet
|
1 baths 2 beds |
show details | |

|
#7
W 9th St
Davenport, IA 52803
|
- sq. feet
|
2 baths 4 beds |
show details | |

|
#8
W 55th St
Davenport, IA 52806
|
- sq. feet
|
- baths - beds |
show details | |

|
#9
Welshire Dr
Davenport, IA 52806
|
- sq. feet
|
- baths - beds |
show details | |

|
#10
W Hayes St
Davenport, IA 52804
|
- sq. feet
|
- baths - beds |
show details |
| Photo | Address | Area | Beds / Baths | Price | Details |
|---|---|---|---|---|---|

|
#11
Telegraph Rd
Davenport, IA 52804
|
- sq. feet
|
- baths - beds |
show details | |

|
#12
Rueben Dr
Davenport, IA 52806
|
- sq. feet
|
- baths - beds |
show details | |

|
#13
N Nevada Ave
Davenport, IA 52804
|
- sq. feet
|
- baths - beds |
show details | |

|
#14
N Fairmount St # 98
Davenport, IA 52806
|
- sq. feet
|
- baths - beds |
show details | |

|
#15
W 15th St
Davenport, IA 52803
|
- sq. feet
|
- baths - beds |
show details | |

|
#16
Tremont Ave
Davenport, IA 52803
|
- sq. feet
|
- baths - beds |
show details | |

|
#17
W 61st St
Davenport, IA 52806
|
- sq. feet
|
- baths - beds |
show details | |

|
#18
W 15th St Apt 131
Davenport, IA 52804
|
- sq. feet
|
- baths - beds |
show details | |

|
#19
Telegraph Rd
Davenport, IA 52804
|
- sq. feet
|
- baths - beds |
show details | |

|
#20
E Kimberly Rd, Ste I Pmb 104
Davenport, IA 52806
|
- sq. feet
|
- baths - beds |
show details |
| Photo | Address | Area | Beds / Baths | Price | Details |
|---|---|---|---|---|---|

|
#21
N Lincoln Ave
Davenport, IA Array
|
- sq. feet
|
- baths - beds |
show details | |

|
#22
N Lincoln Ave
Davenport, IA 52804
|
- sq. feet
|
- baths - beds |
show details | |

|
#23
Eastern Ave Apt G3
Davenport, IA 52807
|
- sq. feet
|
- baths - beds |
show details | |

|
#24
Sheridan St Apt A6
Davenport, IA 52806
|
- sq. feet
|
- baths - beds |
show details | |

|
#25
Waverly Rd
Davenport, IA 52804
|
- sq. feet
|
- baths - beds |
show details | |

|
#26
S Pine St
Davenport, IA 52802
|
- sq. feet
|
- baths - beds |
show details | |

|
#27
E 13th St
Davenport, IA 52803
|
- sq. feet
|
- baths - beds |
show details | |

|
#28
Mississippi Ave
Davenport, IA 52803
|
- sq. feet
|
- baths - beds |
show details | |

|
#29
Calvin St
Davenport, IA 52804
|
- sq. feet
|
- baths - beds |
show details | |

|
#30
N Division St
Davenport, IA 52804
|
- sq. feet
|
- baths - beds |
show details |
| Photo | Address | Area | Beds / Baths | Price | Details |
|---|---|---|---|---|---|

|
#31
Mississippi Ave
Davenport, IA 52803
|
- sq. feet
|
- baths - beds |
show details | |

|
#32
W 51st St
Davenport, IA 52806
|
- sq. feet
|
- baths - beds |
show details | |

|
#33
N Main St
Davenport, IA 52803
|
- sq. feet
|
- baths - beds |
show details | |

|
#34
E High St
Davenport, IA 52803
|
- sq. feet
|
- baths - beds |
show details | |

|
#35
Warren St
Davenport, IA 52804
|
- sq. feet
|
- baths - beds |
show details | |

|
#36
Regency Ct
Davenport, IA 52806
|
- sq. feet
|
- baths - beds |
show details | |

|
#37
W 7th St
Davenport, IA 52802
|
- sq. feet
|
- baths - beds |
show details | |

|
#38
Western Ave
Davenport, IA 52801
|
- sq. feet
|
- baths - beds |
show details | |

|
#39
Imperial Ct
Davenport, IA 52807
|
- sq. feet
|
- baths - beds |
show details | |

|
#40
Belle Ave
Davenport, IA 52807
|
- sq. feet
|
- baths - beds |
show details |
| Photo | Address | Area | Beds / Baths | Price | Details |
|---|---|---|---|---|---|

|
#41
W 55th St
Davenport, IA 52806
|
- sq. feet
|
- baths - beds |
show details | |

|
#42
W 51st St
Davenport, IA 52806
|
- sq. feet
|
- baths - beds |
show details | |

|
#43
N Birchwood Ave
Davenport, IA 52806
|
- sq. feet
|
- baths - beds |
show details | |

|
#44
E Laurel St
Davenport, IA 52803
|
- sq. feet
|
- baths - beds |
show details | |

|
#45
Cedar St
Davenport, IA 52804
|
- sq. feet
|
- baths - beds |
show details | |

|
#46
Ricker Hill Rd
Davenport, IA 52802
|
- sq. feet
|
- baths - beds |
show details | |

|
#47
Rockingham Rd
Davenport, IA 52802
|
- sq. feet
|
- baths - beds |
show details | |

|
#48
Washington Ln
Davenport, IA 52804
|
- sq. feet
|
- baths - beds |
show details | |

|
#49
Jackson Ave
Davenport, IA 52802
|
- sq. feet
|
- baths - beds |
show details | |

|
Check over 1 million property listings on Foreclosure.com!
|
browse all offers | |||

Latest news about housing in Davenport, IA collected exclusively by city-data.com from local newspapers, TV, and radio stations


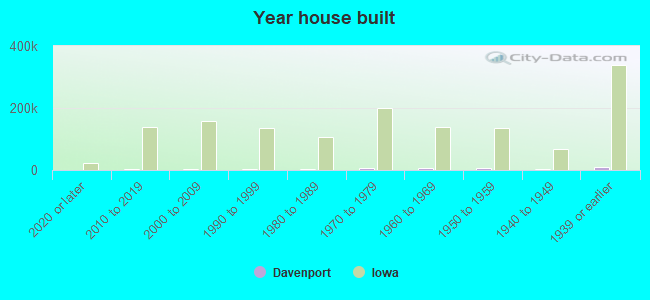
Median year apartment built: 1973
Household type by relationship:
Households: 100,491- Male householders: 20,859 (8,884 living alone), Female householders: 23,850 (8,511 living alone)
16,224 spouses (16,081 opposite-sex spouses), 3,765 unmarried partners, (3,495 opposite-sex unmarried partners), 25,039 children (21,765 natural, 1,160 adopted, 2,114 stepchildren), 1,432 grandchildren, 1,108 brothers or sisters, 209 parents, 0 foster children, 679 other relatives, 4,212 non-relatives
- In group quarters: 3,114
Size of family households: 12,386 2-persons, 6,129 3-persons, 3,499 4-persons, 1,704 5-persons, 264 6-persons, 208 7-or-more-persons.
Size of nonfamily households: 17,395 1-person, 2,678 2-persons, 171 3-persons, 62 4-persons, 56 6-persons, 157 7-or-more-persons.
12,155 married couples with children.
7,509 single-parent households (1,662 men, 5,847 women).
92.7% of residents of Davenport speak English at home.
4.2% of residents speak Spanish at home (60% speak English very well, 17% speak English well, 11% speak English not well, 11% don't speak English at all).
1.3% of residents speak other Indo-European language at home (64% speak English very well, 14% speak English well, 21% speak English not well, 1% don't speak English at all).
1.4% of residents speak Asian or Pacific Island language at home (42% speak English very well, 35% speak English well, 12% speak English not well, 11% don't speak English at all).
0.3% of residents speak other language at home (62% speak English very well, 18% speak English well, 21% speak English not well).
Foreign born population: 6,469 (6.4%)
(29.6% of them are naturalized citizens)
| Here: | 6.5 |
| State: | 6.8 |
| Here: | 3.8 |
| State: | 4.2 |
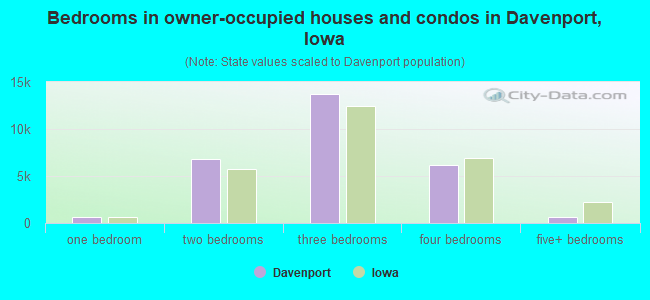
- Bedrooms in owner-occupied houses and condos in Davenport, Iowa
- 0no bedroom
- 6391 bedroom
- 6,8032 bedrooms
- 13,7413 bedrooms
- 6,1694 bedrooms
- 6535+ bedrooms
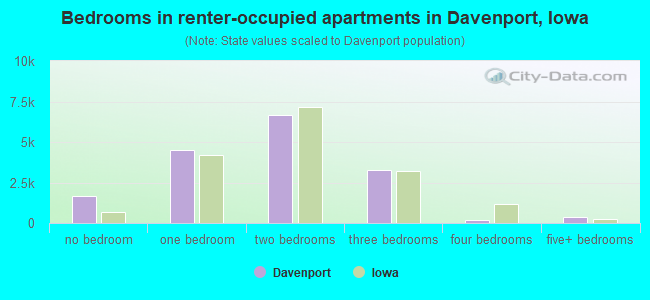
- Bedrooms in renter-occupied apartments in Davenport, Iowa
- 1,664no bedroom
- 4,5241 bedroom
- 6,6832 bedrooms
- 3,2623 bedrooms
- 2054 bedrooms
- 3665+ bedrooms
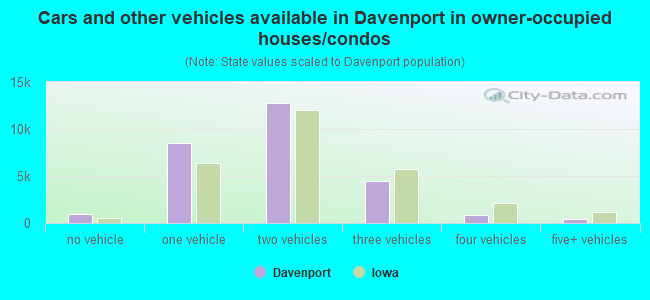
- Cars and other vehicles available in Davenport in owner-occupied houses/condos
- 925no vehicle
- 8,5341 vehicle
- 12,7432 vehicles
- 4,4533 vehicles
- 8744 vehicles
- 4765+ vehicles
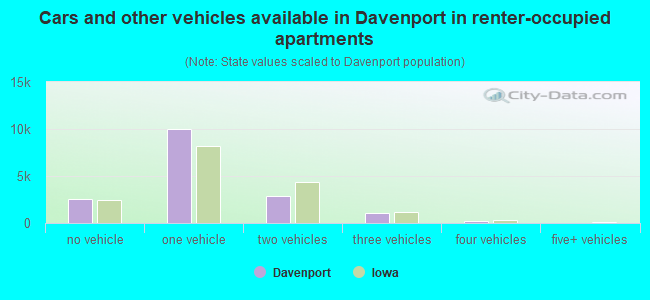
- Cars and other vehicles available in Davenport in renter-occupied apartments
- 2,548no vehicle
- 10,0091 vehicle
- 2,8752 vehicles
- 1,0973 vehicles
- 1754 vehicles
- 05+ vehicles
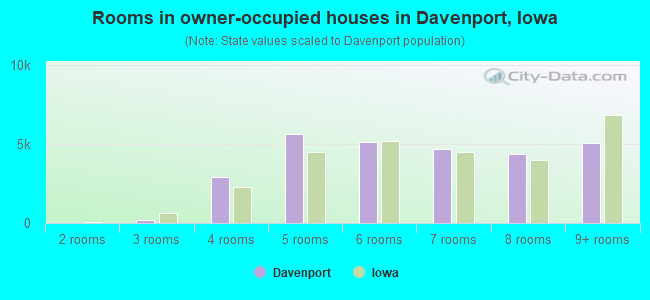
- Rooms in owner-occupied houses in Davenport, Iowa
- 01 room
- 02 rooms
- 2153 rooms
- 2,9114 rooms
- 5,6425 rooms
- 5,1296 rooms
- 4,6887 rooms
- 4,3568 rooms
- 5,0649+ rooms
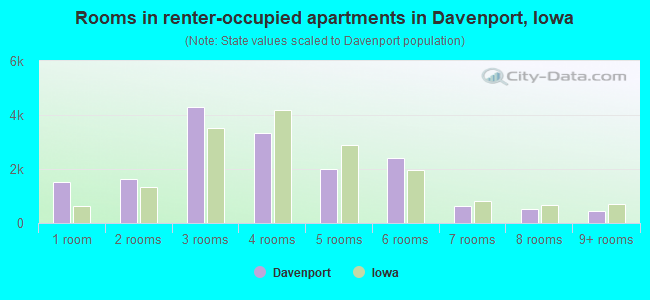
- Rooms in renter-occupied apartments in Davenport, Iowa
- 1,5191 room
- 1,6312 rooms
- 4,2883 rooms
- 3,3234 rooms
- 1,9865 rooms
- 2,3906 rooms
- 6277 rooms
- 5148 rooms
- 4269+ rooms
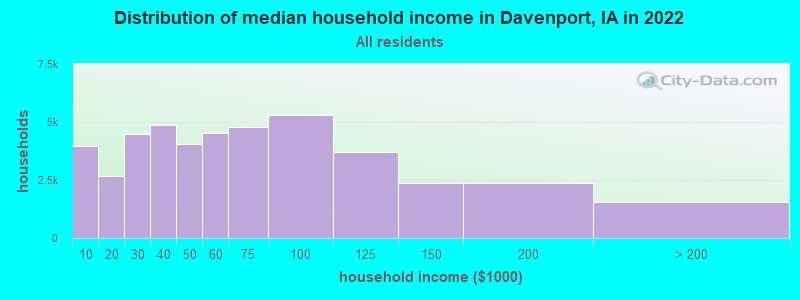
Davenport, IA household income distribution

- 3,945Less than $10,000
- 2,668$10,000 to $19,999
- 4,497$20,000 to $29,999
- 4,881$30,000 to $39,999
- 4,073$40,000 to $49,999
- 4,547$50,000 to $59,999
- 4,780$60,000 to $74,999
- 5,297$75,000 to $99,999
- 3,715$100,000 to $124,999
- 2,383$125,000 to $149,999
- 2,353$150,000 to $199,999
- 1,570$200,000 or more
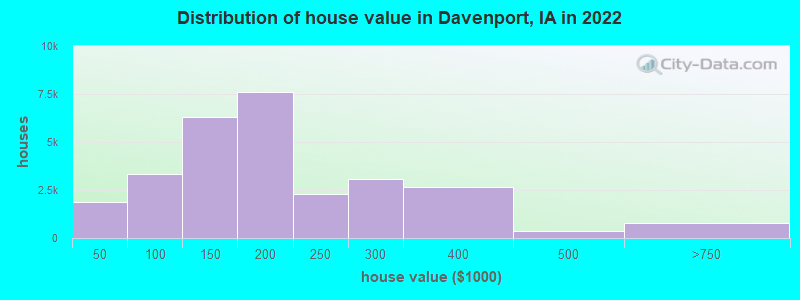
Home value of owner - occupied houses in 2022 in Davenport, IA
-
- 730Less than $10,000
- 302$10,000 to $14,999
- 268$15,000 to $19,999
- 54$20,000 to $24,999
- 134$25,000 to $29,999
- 82$30,000 to $34,999
- 24$35,000 to $39,999
- 294$40,000 to $49,999
- 66$50,000 to $59,999
- 924$60,000 to $69,999
- 264$70,000 to $79,999
- 730$80,000 to $89,999
- 1,034$90,000 to $99,999
- 3,928$100,000 to $124,999
- 2,377$125,000 to $149,999
- 5,908$150,000 to $174,999
- 1,712$175,000 to $199,999
- 2,316$200,000 to $249,999
- 3,071$250,000 to $299,999
- 2,651$300,000 to $399,999
- 355$400,000 to $499,999
- 718$500,000 to $749,999
- 33$750,000 to $999,999
- 30$1,000,000 to $1,499,999
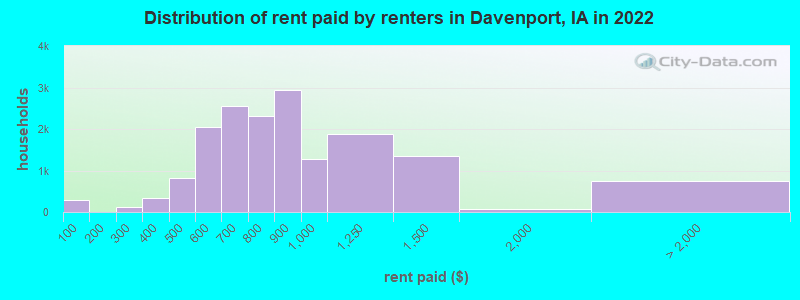
Rent paid by renters in 2022 in Davenport, IA
-
- 281Less than $100
- 128$200 to $249
- 82$300 to $349
- 258$350 to $399
- 441$400 to $449
- 376$450 to $499
- 1,173$500 to $549
- 877$550 to $599
- 1,236$600 to $649
- 1,320$650 to $699
- 1,348$700 to $749
- 959$750 to $799
- 2,929$800 to $899
- 1,273$900 to $999
- 1,869$1,000 to $1,249
- 1,342$1,250 to $1,499
- 69$1,500 to $1,999
- 72$2,500 to $2,999
- 154$3,000 to $3,499
- 81$3,500 or more
- 436No cash rent
Percentage of workers working in this county: 80.7%
Number of people working at home: 5,536 (10.9% of all workers)
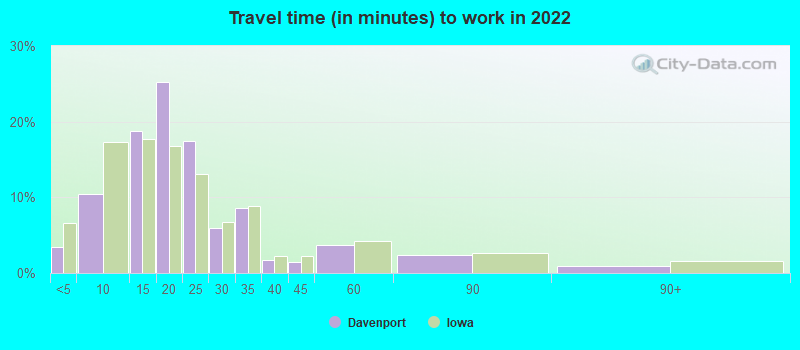
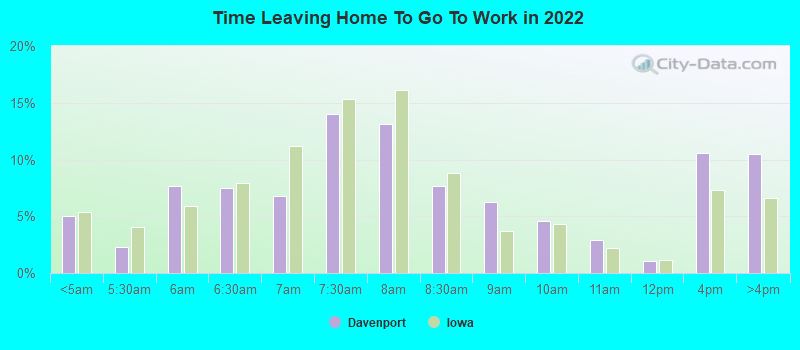
Travel time to work (commute)
- Less than 5 minutes: 966
- 5 to 9 minutes: 5,332
- 10 to 14 minutes: 8,152
- 15 to 19 minutes: 12,118
- 20 to 24 minutes: 8,647
- 25 to 29 minutes: 1,791
- 30 to 34 minutes: 3,552
- 35 to 39 minutes: 746
- 40 to 44 minutes: 463
- 45 to 59 minutes: 1,236
- 60 to 89 minutes: 1,011
- 90 or more minutes: 612
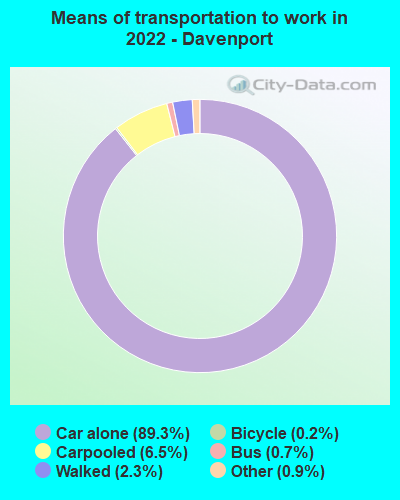
Means of transportation to work:
- Drove a car alone: 47,836 (77.5%)
- Carpooled: 5,176 (8.4%)
- Bus: 360 (0.6%)
- Subway or elevated rail: 10 (0.0%)
- Long-distance train or commuter rail: 37 (0.1%)
- Ferryboat: 6 (0.0%)
- Taxi: 823 (1.3%)
- Bicycle: 141 (0.2%)
- Walked: 1,281 (2.1%)
- Worked at home: 5,536 (9.0%)
- Unemployment by race in 2022
- Unemployment rate for White non-Hispanic residents
- 4.8%Males
- 1.9%Females
- Unemployment rate for Black residents
- 13.0%Males
- 10.1%Females
- Unemployment rate for American Indian and Alaska Native residents
- 10.4%Females
- Unemployment rate for Asian residents
- 2.9%Males
- Unemployment rate for other race residents
- 1.2%Males
- 2.3%Females
- Unemployment rate for two or more race residents
- 6.6%Males
- 6.1%Females
- Unemployment rate for Hispanic or Latino residents
- 3.2%Males
- 0.7%Females
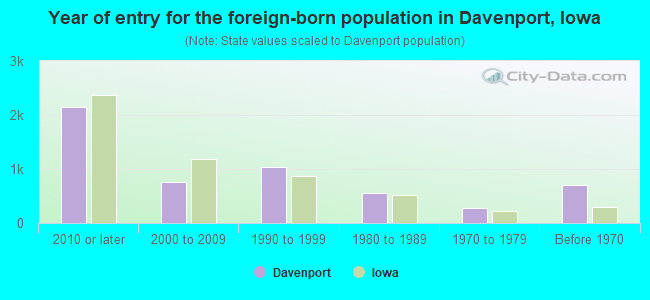
- Year of entry for the foreign-born population in Davenport, Iowa
- 2,1562010 or later
- 7552000 to 2009
- 1,0421990 to 1999
- 5491980 to 1989
- 2871970 to 1979
- 697Before 1970
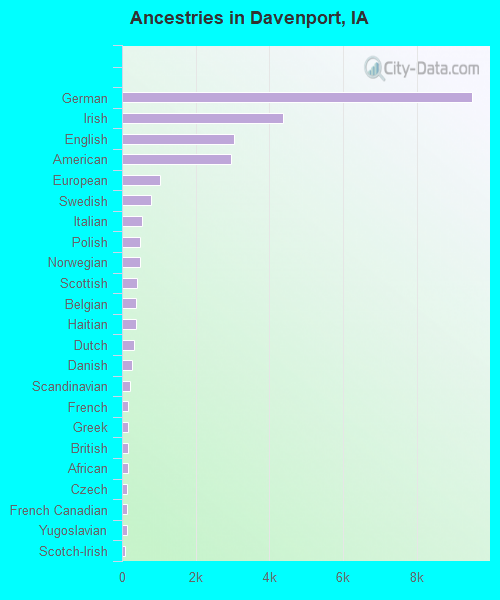
First ancestries reported:
- German: 9,494 (20.8%)
- Irish: 4,366 (9.5%)
- English: 3,045 (6.7%)
- American: 2,968 (6.5%)
- European: 1,035 (2.3%)
- Swedish: 781 (1.7%)
- Italian: 556 (1.2%)
- Polish: 498 (1.1%)
- Norwegian: 489 (1.1%)
- Scottish: 412 (0.9%)
- Belgian: 384 (0.8%)
- Haitian: 376 (0.8%)
- Dutch: 326 (0.7%)
- Danish: 270 (0.6%)
- Scandinavian: 220 (0.5%)
- French: 176 (0.4%)
- Greek: 167 (0.4%)
- British: 163 (0.4%)
- African: 159 (0.3%)
- Czech: 145 (0.3%)
- French Canadian: 143 (0.3%)
- Yugoslavian: 142 (0.3%)
- Scotch-Irish: 87 (0.2%)
- Welsh: 79 (0.2%)
- Ukrainian: 78 (0.2%)
- Russian: 64 (0.1%)
- Hungarian: 63 (0.1%)
- Portuguese: 59 (0.1%)
- Northern European: 58 (0.1%)
- Swiss: 56 (0.1%)
- Jamaican: 55 (0.1%)
- Pennsylvania German: 40 (0.09%)
- Canadian: 37 (0.08%)
- Egyptian: 37 (0.08%)
- Eastern European: 32 (0.07%)
- Armenian: 30 (0.07%)
- Czechoslovakian: 29 (0.06%)
- Finnish: 24 (0.05%)
- Croatian: 24 (0.05%)
- South African: 20 (0.04%)
- Latvian: 18 (0.04%)
- Iranian: 18 (0.04%)
- Turkish: 14 (0.03%)
- Arab: 10 (0.02%)
- Austrian: 10 (0.02%)
- Kenyan: 10 (0.02%)
- Bulgarian: 10 (0.02%)
- Slavic: 6 (0.01%)
- Lithuanian: 4 (0.01%)
- Lebanese: 3 (0.01%)
- Brazilian: 3 (0.01%)
Most common places of birth for foreign-born residents (%):
| Davenport: | 38.6% (1,865) |
| Iowa: | 23.3% (41,625) |
| Davenport: | 13.0% (629) |
| Iowa: | 4.2% (7,428) |
| Davenport: | 5.1% (247) |
| Iowa: | 0.4% (788) |
| Davenport: | 3.9% (189) |
| Iowa: | 2.6% (4,675) |
| Davenport: | 3.4% (164) |
| Iowa: | 3.2% (5,751) |
| Davenport: | 3.0% (143) |
| Iowa: | 0.4% (798) |
| Davenport: | 2.7% (132) |
| Iowa: | 2.9% (5,155) |
| Davenport: | 2.5% (123) |
| Iowa: | 0.7% (1,209) |
| Davenport: | 2.5% (120) |
| Iowa: | 1.6% (2,873) |
| Davenport: | 1.9% (92) |
| Iowa: | 2.8% (4,967) |
Place of birth for U.S.-born residents:
- This state: 56,463
- Other state: 36,595
- Northeast: 1,723
- Midwest: 25,759
- South: 3,821
- West: 5,292
83.8% of Davenport residents lived in the same house 1 years ago.
Out of people who lived in different houses, 37.8% lived in this county.
Out of people who lived in different counties, 33.2% lived in Iowa.
| Davenport: | 83.8% |
| State average: | 87.2% |
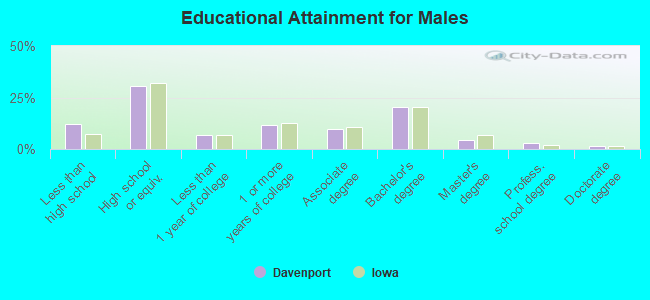
Education attainment for males 25 years and older:
- No schooling: 344
- Nursery to 4th grade: 88
- 5th and 6th grade: 1,111
- 7th and 8th grade: 176
- 9th grade: 84
- 10th grade: 603
- 11th grade: 712
- 12th grade, no diploma: 994
- High school graduate (or equivalency): 10,386
- Less than 1 year of college: 2,249
- Some college more than 1 year, no degree: 3,981
- Associate degree: 3,260
- Bachelor's degree: 7,005
- Master's degree: 1,524
- Professional school degree: 1,035
- Doctorate degree: 457
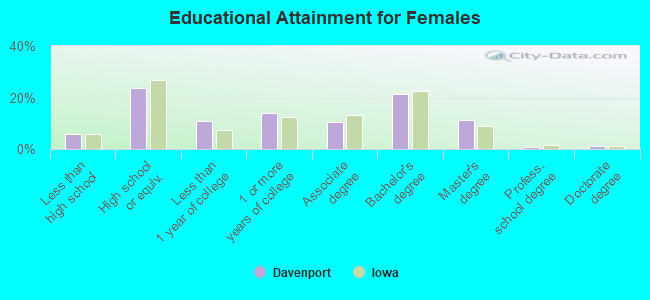
Education attainment for females 25 years and older:
- No schooling: 505
- Nursery to 4th grade: 0
- 5th and 6th grade: 126
- 7th and 8th grade: 161
- 9th grade: 0
- 10th grade: 319
- 11th grade: 532
- 12th grade, no diploma: 510
- High school graduate (or equivalency): 8,557
- Less than 1 year of college: 3,926
- Some college more than 1 year, no degree: 4,995
- Associate degree: 3,843
- Bachelor's degree: 7,784
- Master's degree: 4,090
- Professional school degree: 331
- Doctorate degree: 434
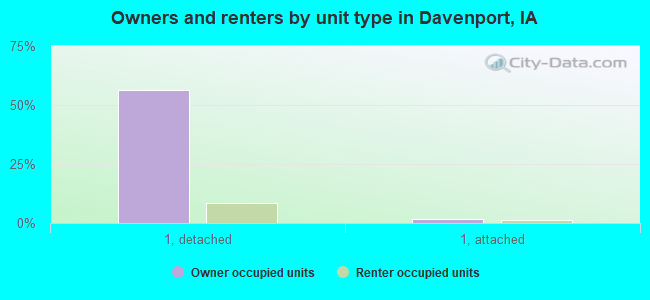
Housing units in structures:
- One, detached: 30,500
- One, attached: 1,498
- Two: 3,001
- 3 or 4: 1,158
- 5 to 9: 3,230
- 10 to 19: 3,107
- 20 to 49: 3,273
- 50 or more: 1,651
- Mobile homes: 968
Median worth of mobile homes: $17,900
Housing units lacking complete kitchen facilities in 2022: 2.7%
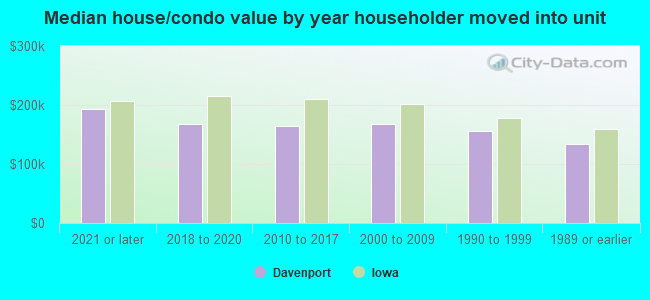
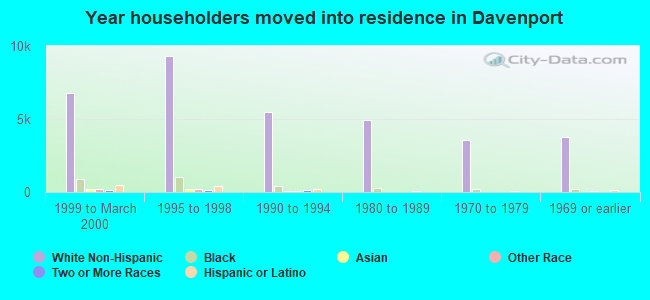
House/condo owner moved in on average 10 years ago
Renter moved in on average 2 years ago
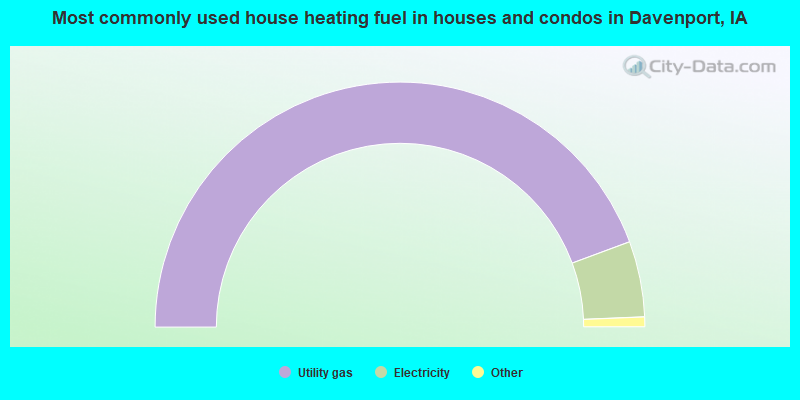
- 88.7%Utility gas
- 10.0%Electricity
- 0.9%Bottled, tank, or LP gas
- 0.2%Wood
- 0.1%Other fuel
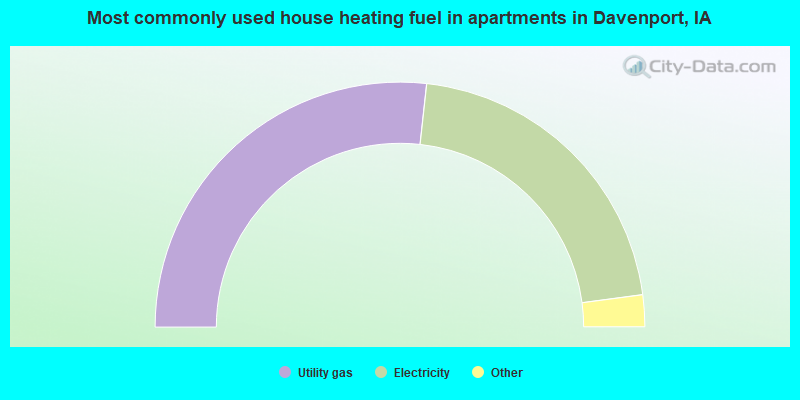
- 53.5%Utility gas
- 42.3%Electricity
- 2.2%Bottled, tank, or LP gas
- 1.1%No fuel used
- 0.8%Other fuel
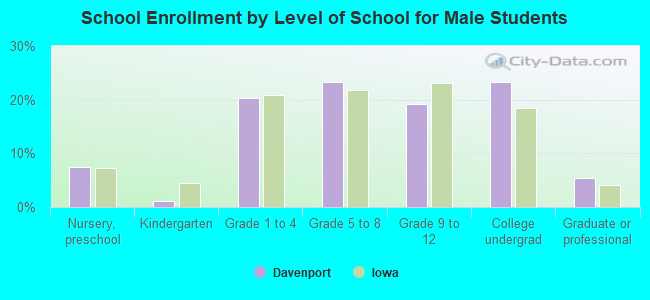
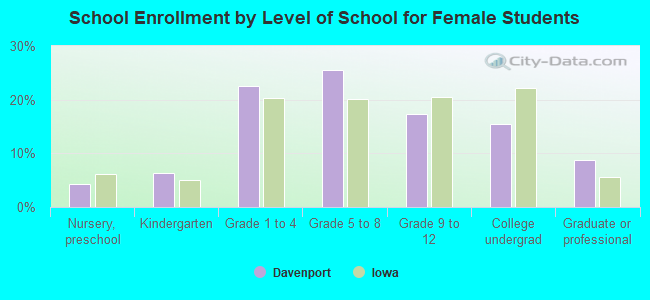
Private vs. public school enrollment:
| Here: | 16.0% |
| Iowa: | 10.6% |
| Here: | 11.2% |
| Iowa: | 7.9% |
| Here: | 43.7% |
| Iowa: | 23.9% |